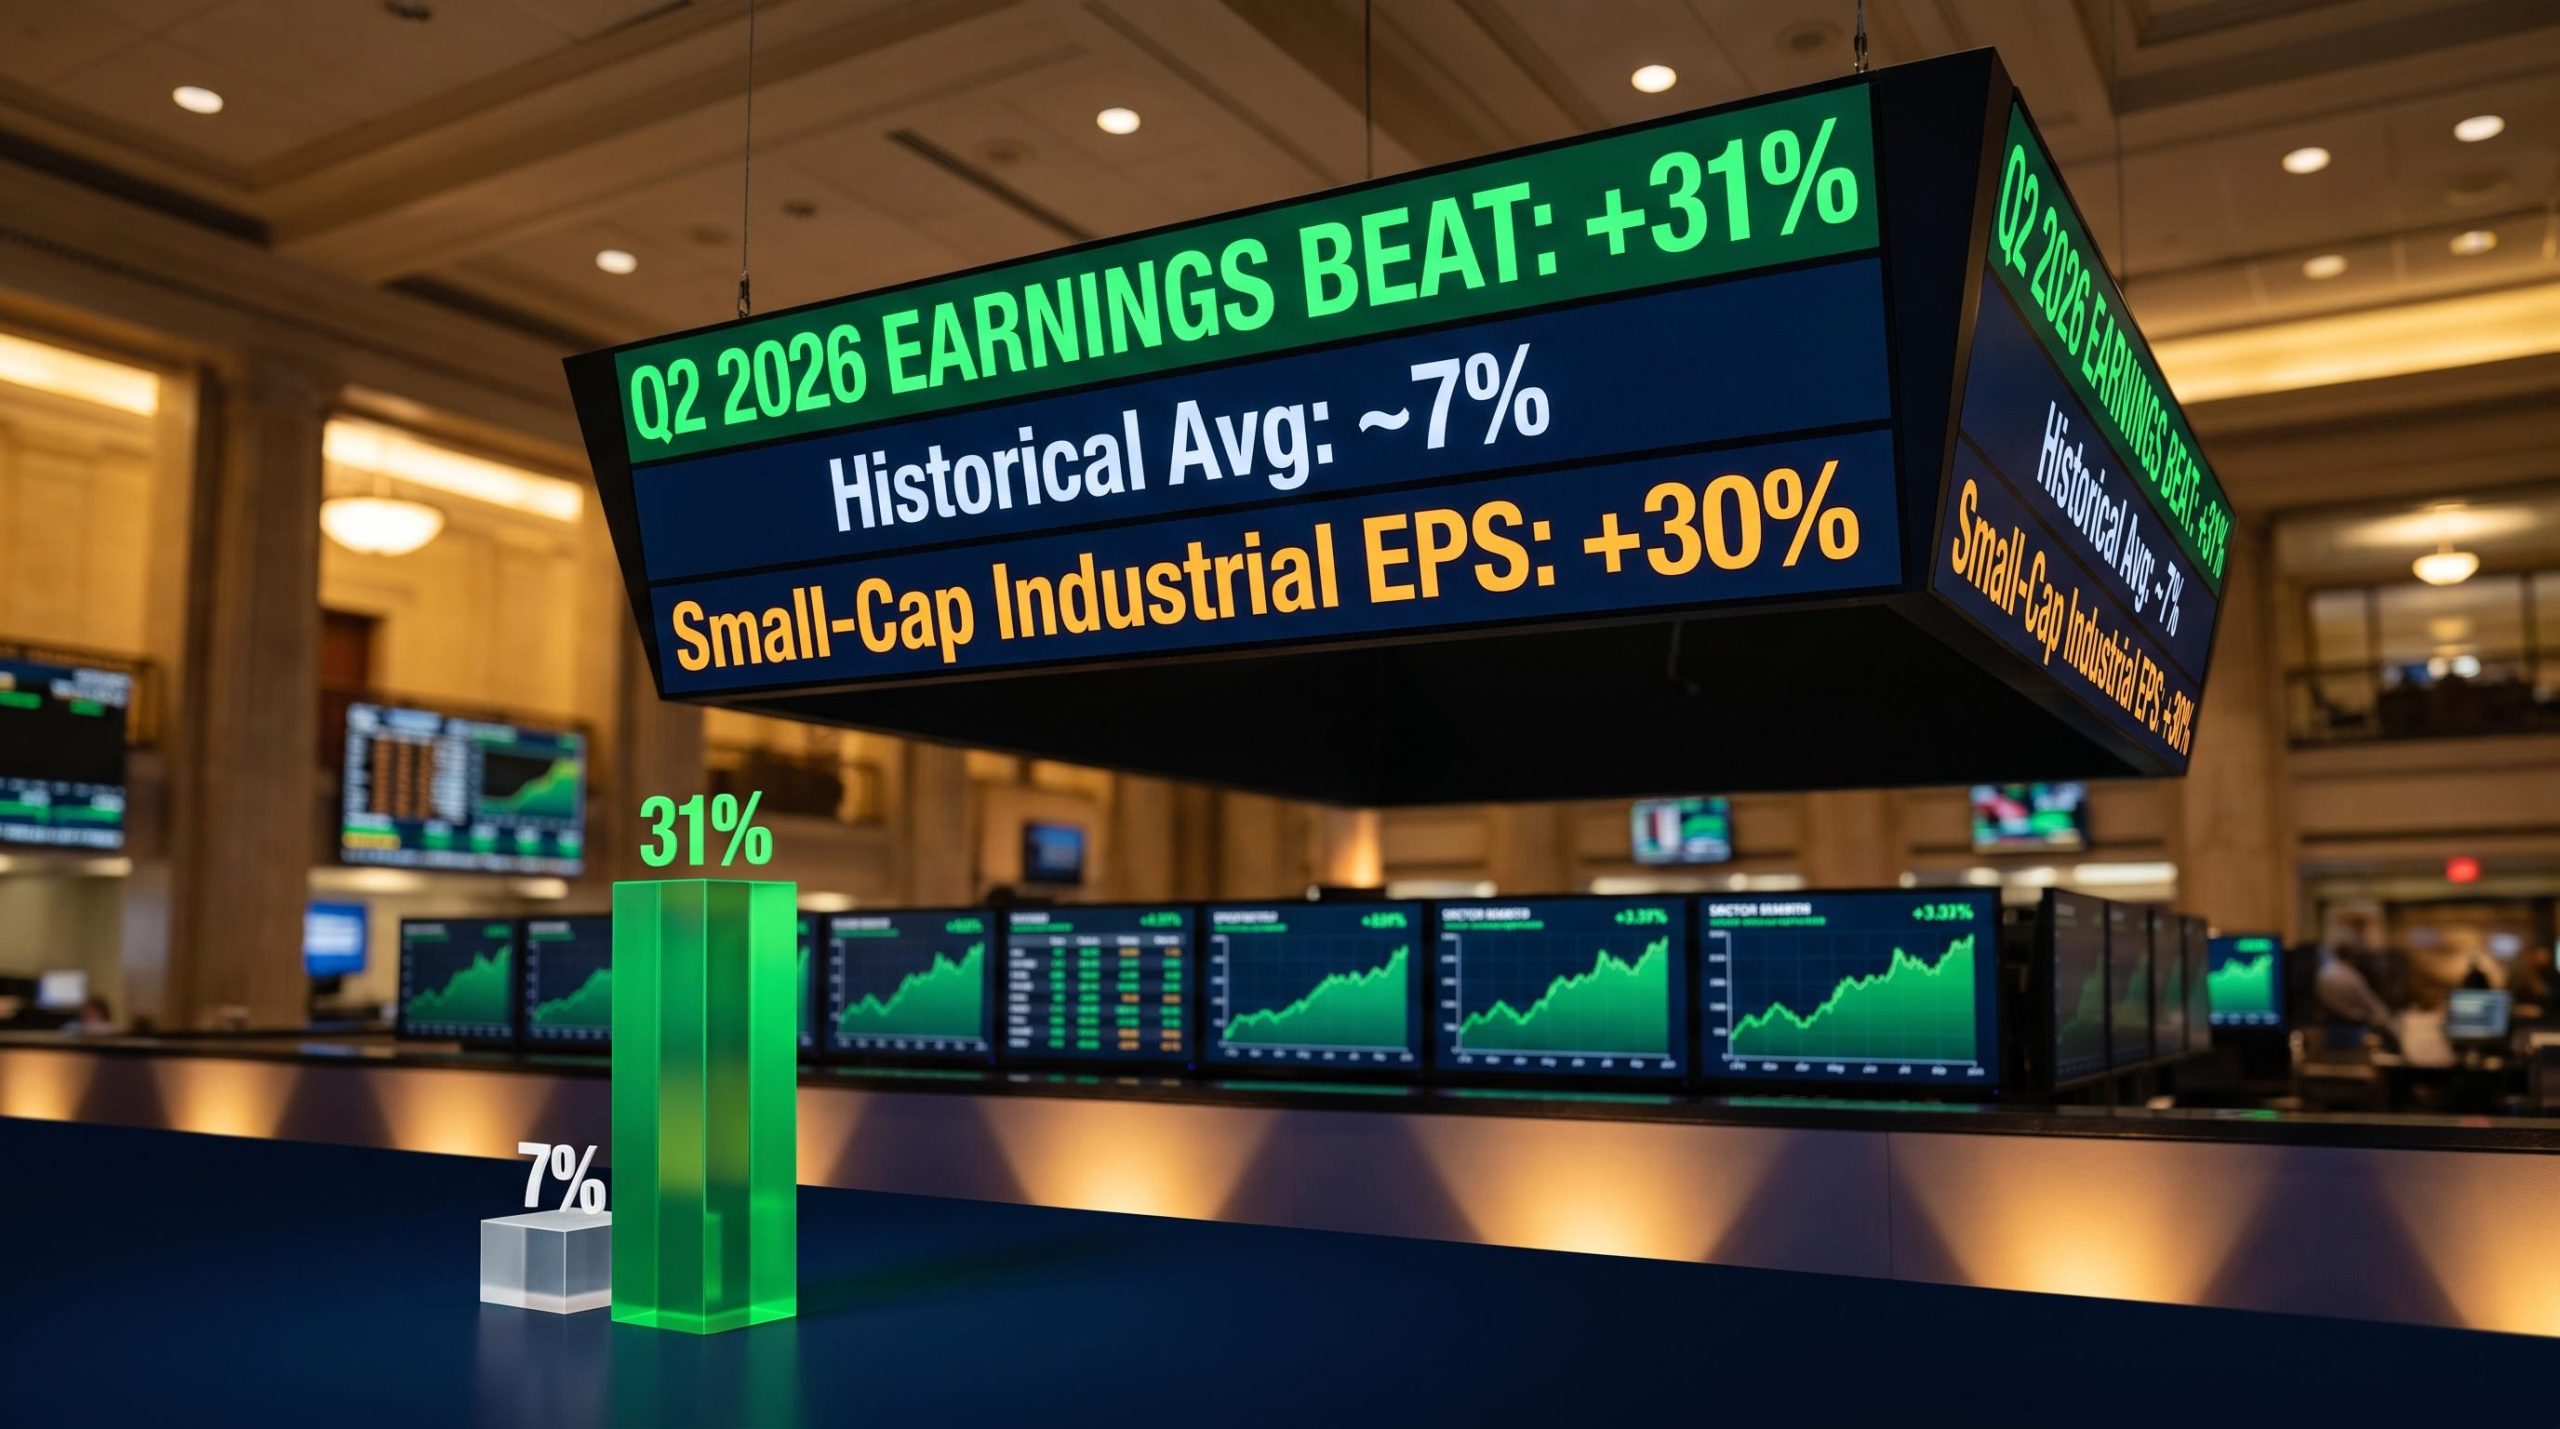
Q2 2026 is producing earnings beats running approximately 31% above analyst consensus. The five- and ten-year average surprise rate sits at roughly 7%. That is not a marginal outperformance. It is a four-fold deviation from the historical norm, and it points to something structural that consensus models failed to capture.
The season’s character is defined by two sector stories operating simultaneously. The first is the hyperscaler AI infrastructure buildout, now measured in hundreds of billions of dollars of incremental capital expenditure. The second is an industrial sector delivering earnings growth and margin expansion that most equity screens have not yet priced. Neither story is fully visible in headline index-level commentary focused on mega-cap technology returns.
Here is where the actual earnings momentum sits right now, what is driving each sector story, and what both mean for how you think about sector exposure heading into the second half of 2026.
The earnings season that rewrote the baseline
The scale of the deviation from historical norms is the starting point. According to FactSet, S&P 500 companies are reporting Q2 2026 earnings approximately 31% above consensus estimates. The five- and ten-year average surprise rate is roughly 7%.
Q2 2026 in context: Companies are beating consensus by 31% on average, against a historical norm of approximately 7%. That gap is the widest in at least five years.
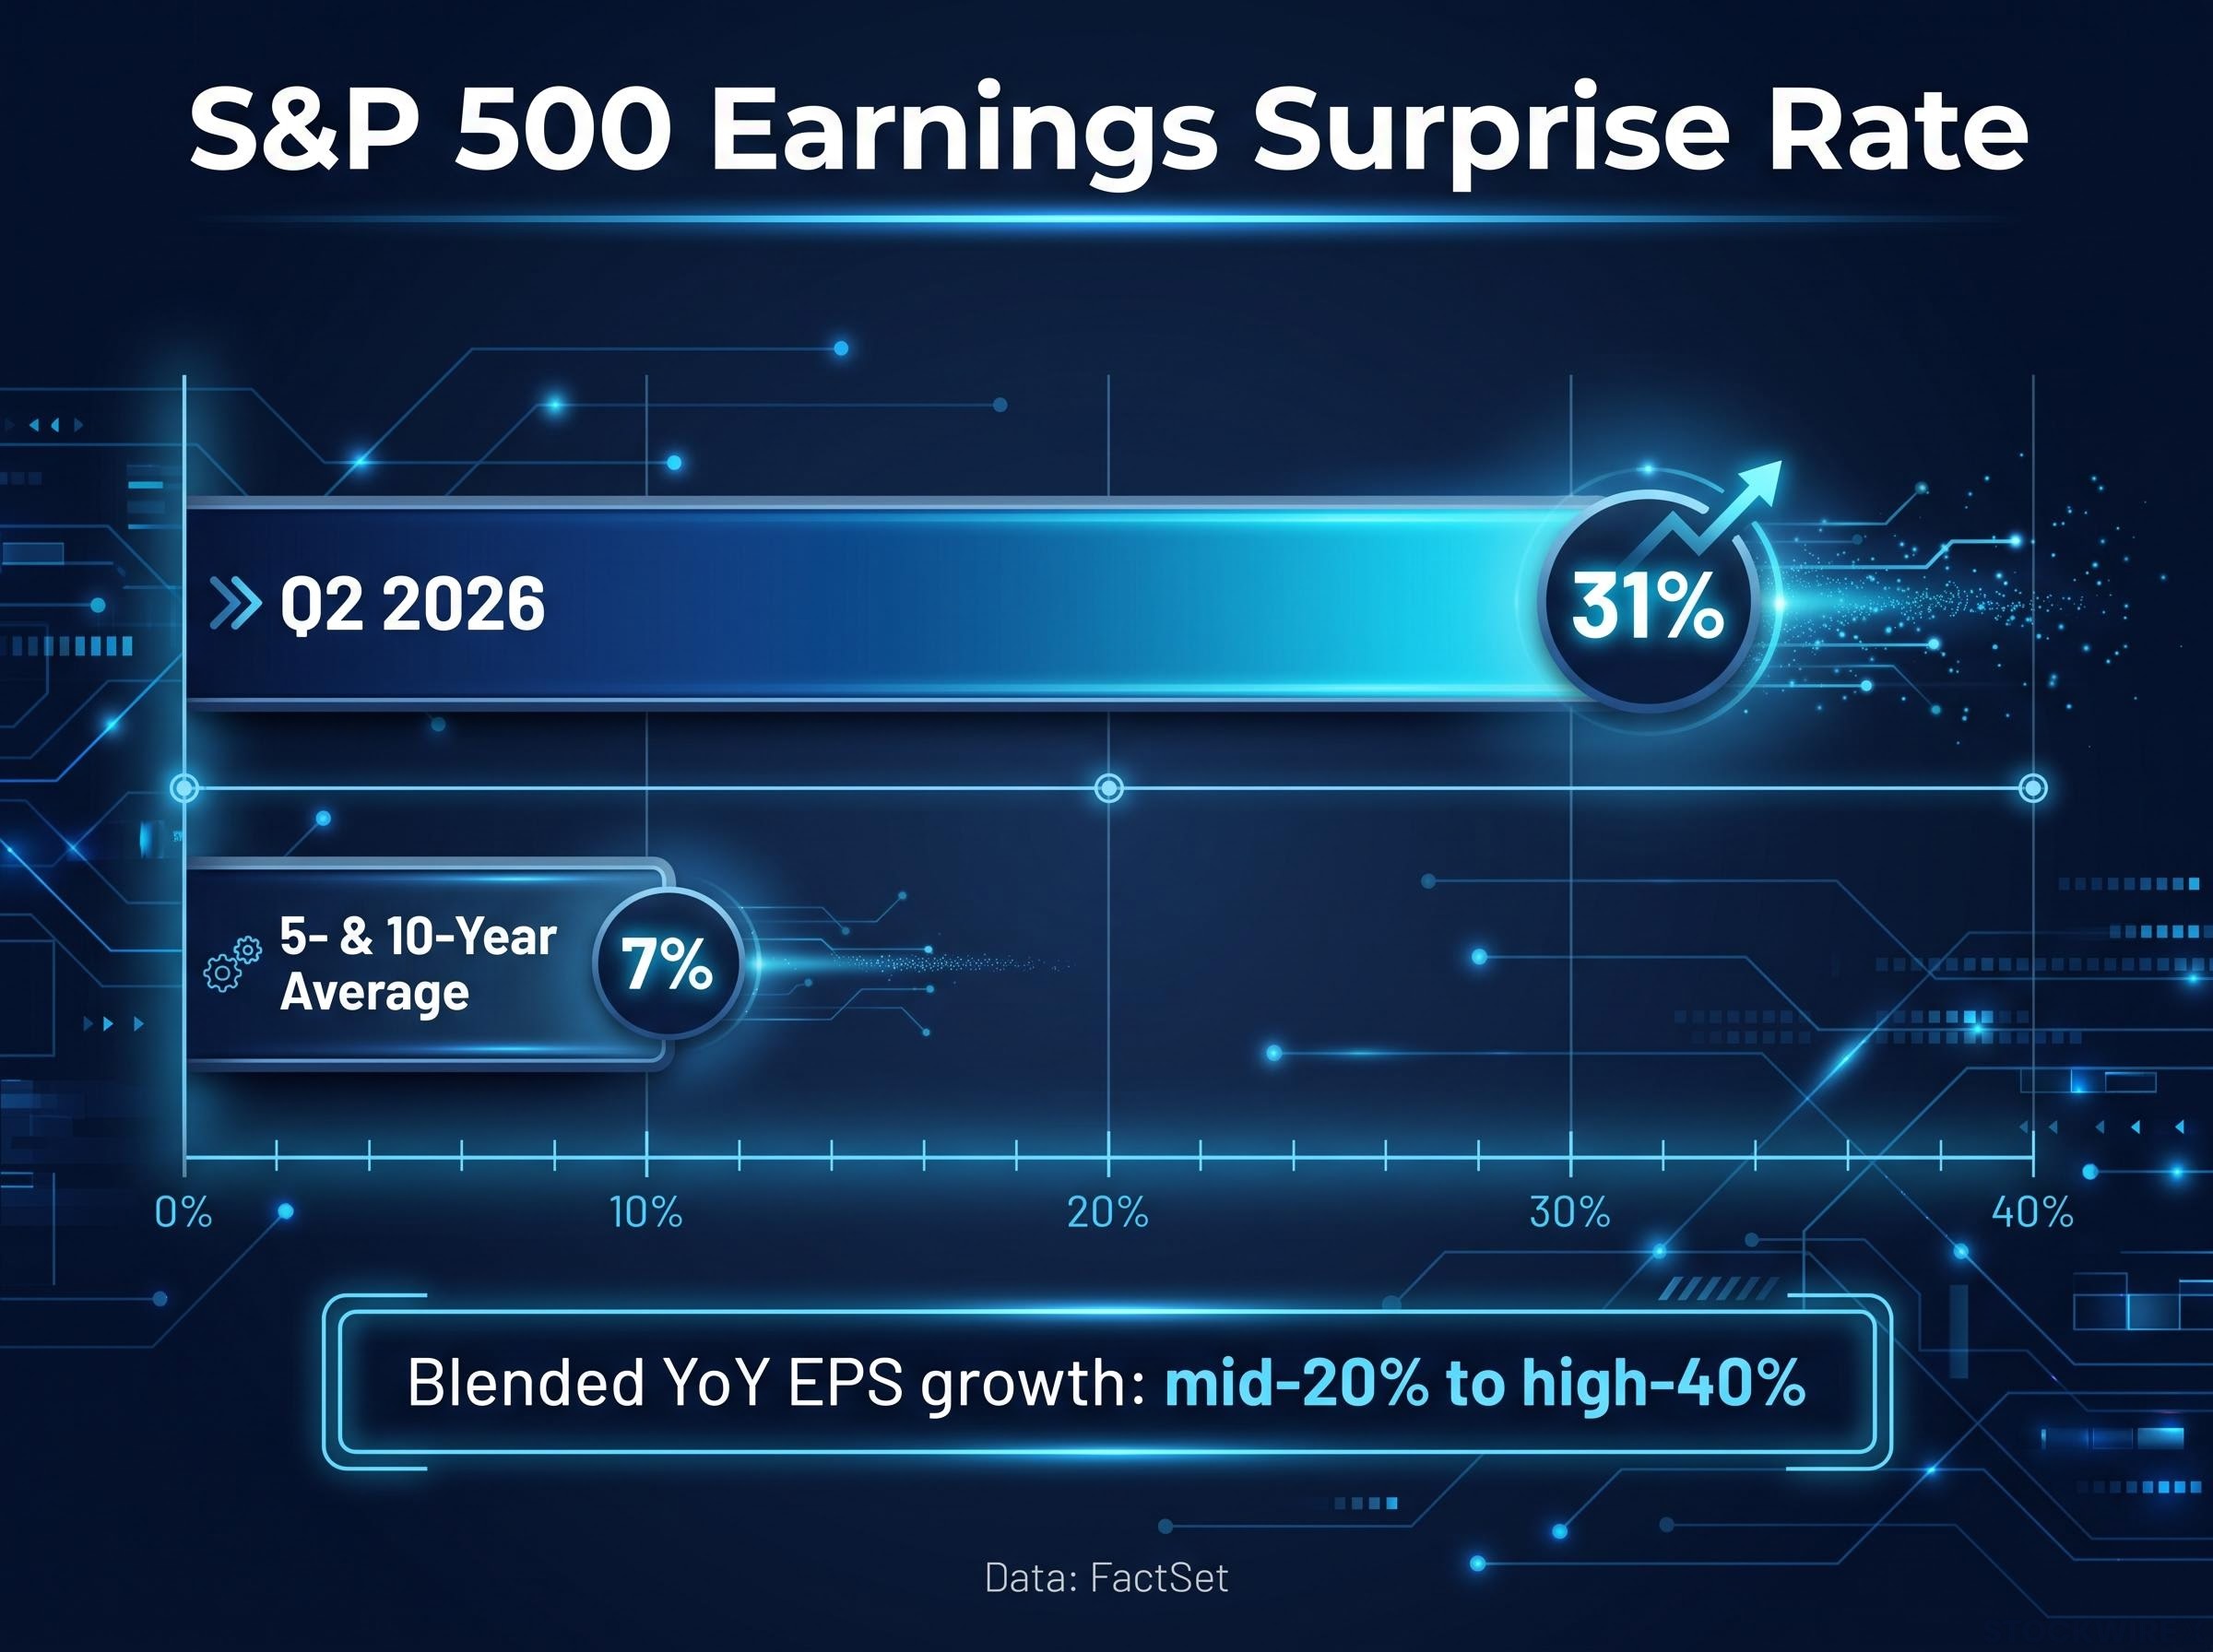
Blended year-over-year earnings per share growth is running in the mid-20% to high-40% range depending on methodology, consistent with characterisations of Q2 2026 as the largest earnings increase in roughly five years. What matters most for sector positioning is that the surprise breadth is not concentrated in a single index constituent. It is spread across sectors.
The FactSet Earnings Insight report for the period ending July 31, 2026 places blended year-over-year EPS growth at 47.4% for the S&P 500, with 86% of reporting companies delivering positive surprises, the data underpinning the scale of deviation from the historical seven-percent norm.
- Average earnings surprise rate: approximately 31% above consensus (FactSet)
- Historical average surprise rate: approximately 7% over five- and ten-year windows (FactSet)
- Blended YoY EPS growth: mid-20% to high-40% range across multiple tracking methodologies
That gap between the current surprise rate and the long-run average tells you that analyst models systematically underestimated something fundamental this quarter. The two sections that follow explain what that something is.
What makes the Q2 2026 beat rate structurally different is that analysts raised estimates by 3.4% during the quarter, the opposite of the historical 2.7% cut, meaning the 31% surprise rate reflects genuine outperformance against a harder hurdle, not a lowered bar engineered for easy analyst estimate revisions.
When big ASX news breaks, our subscribers know first
What $300 billion in new backlogs actually signals
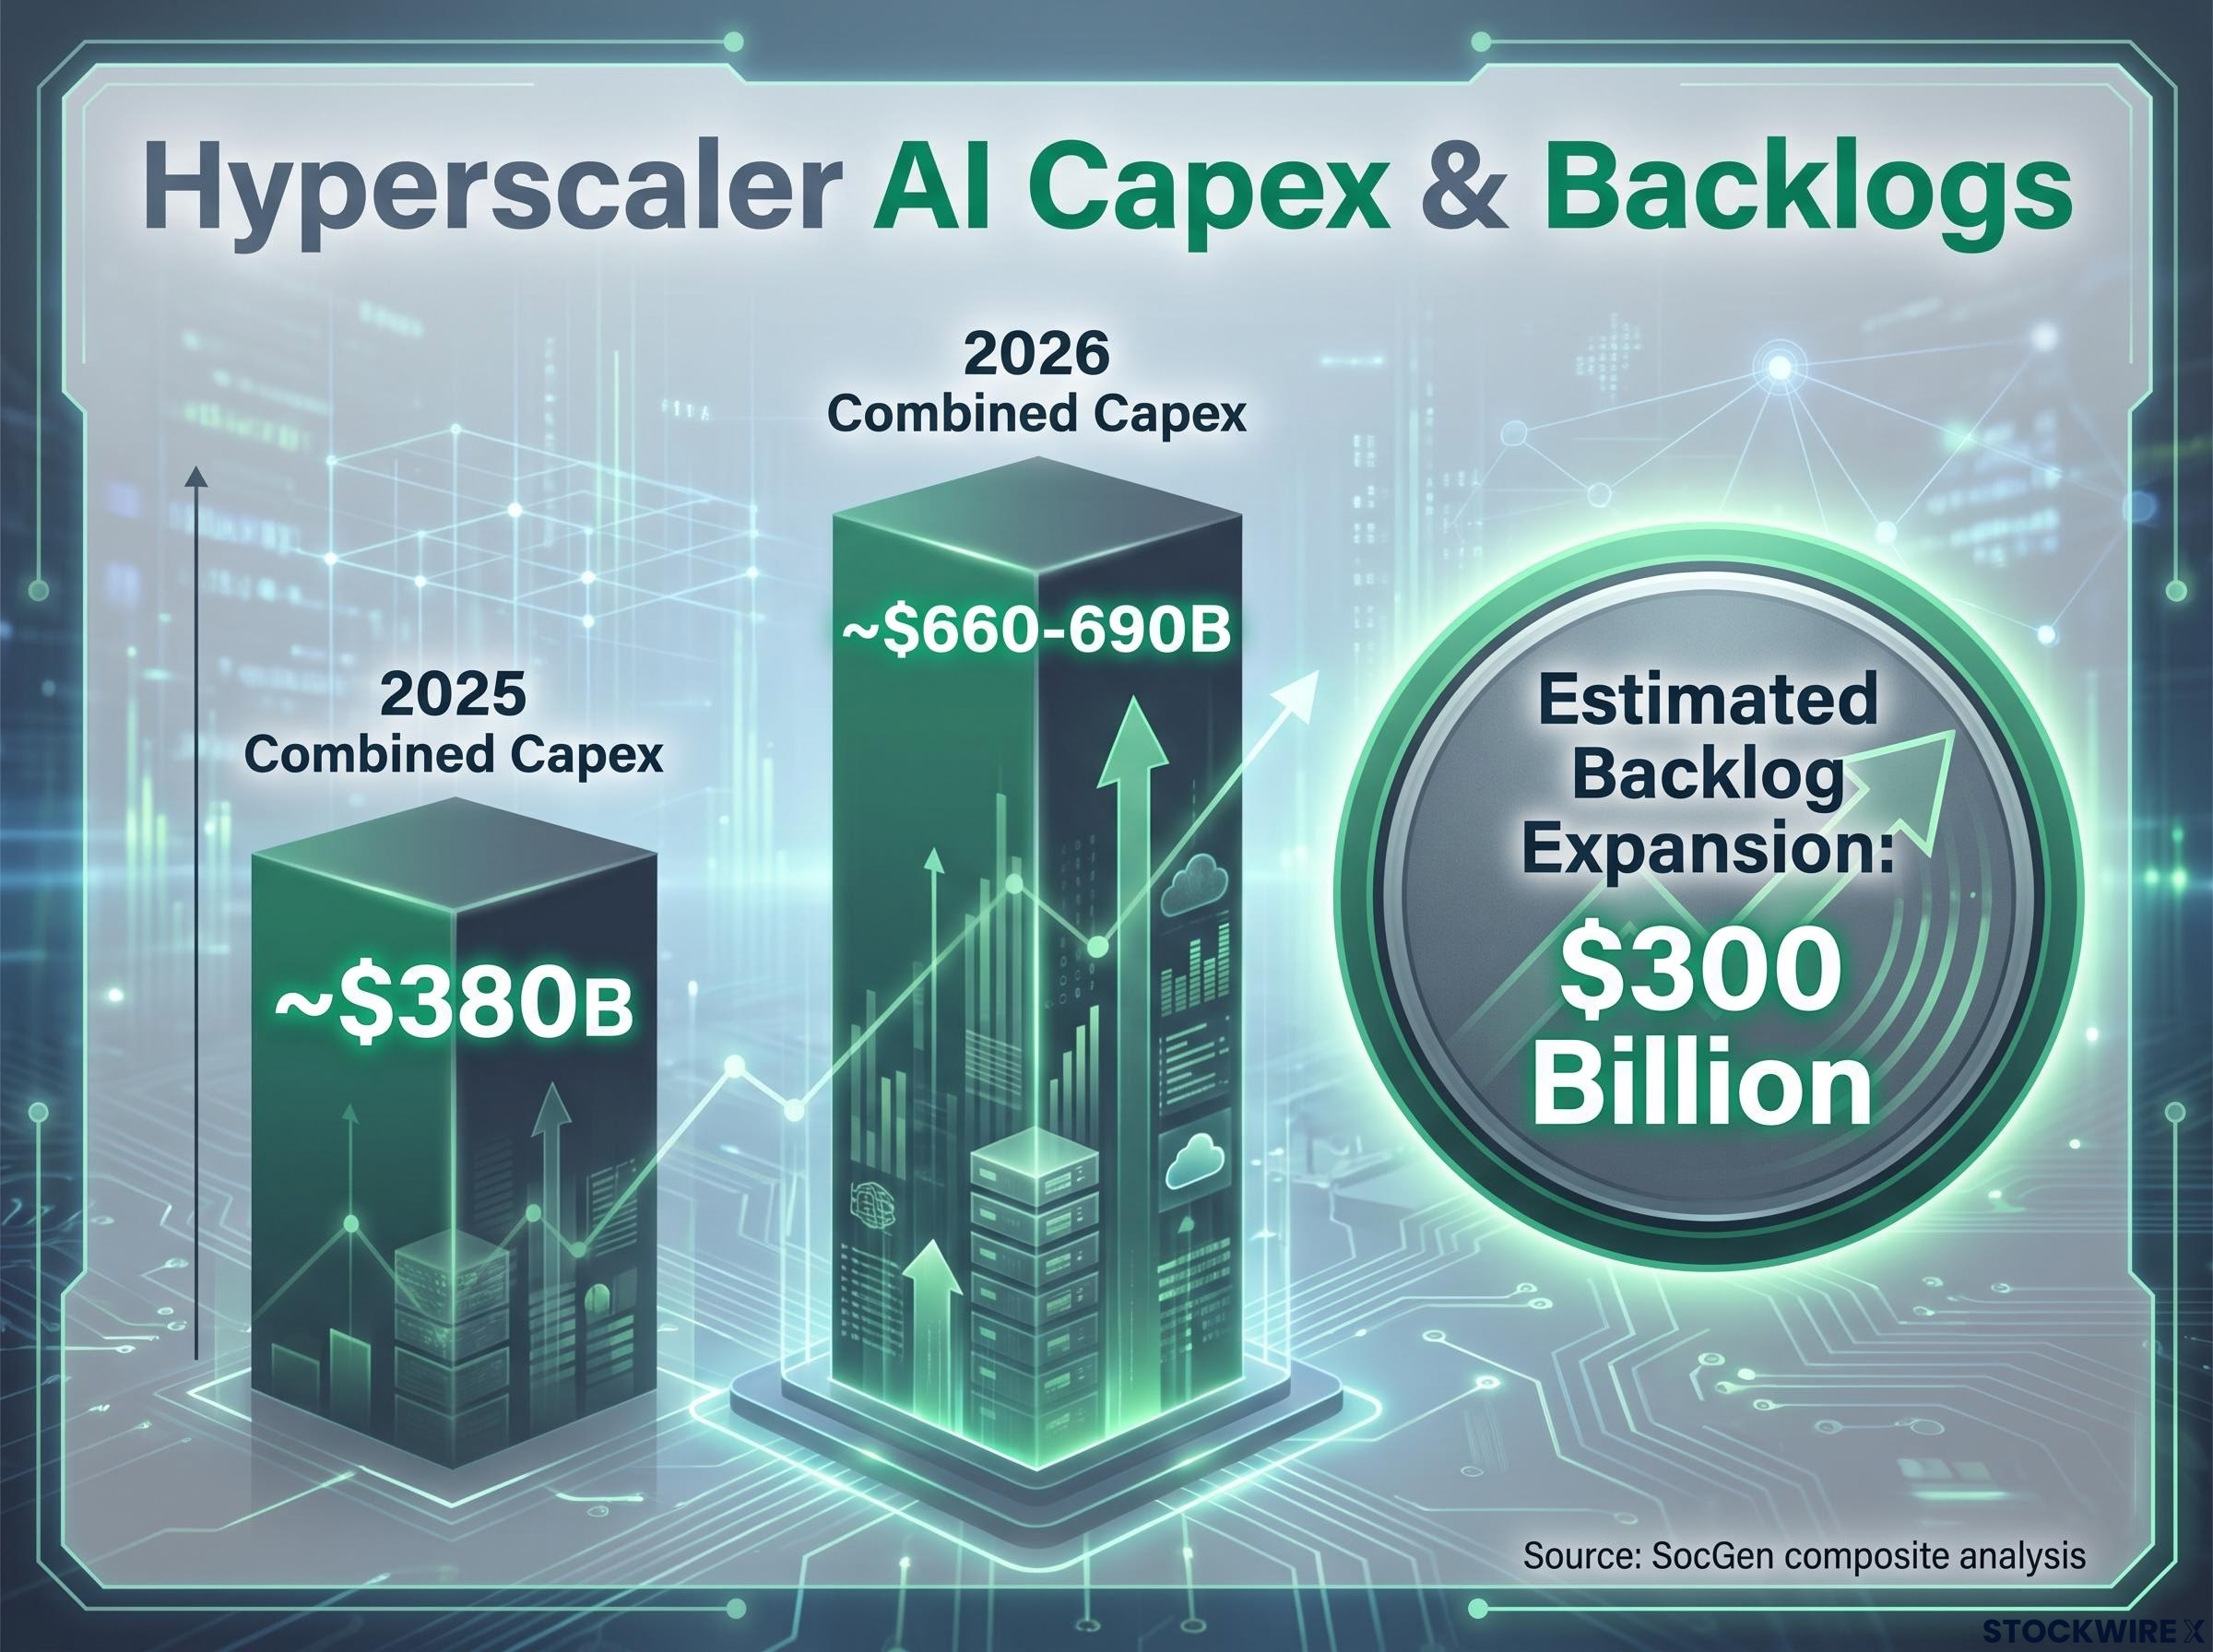
In SocGen’s assessment of the AI infrastructure buildout, Manish Kabra — the firm’s Chief U.S. Equity Strategist — quantified the scale of commitment across the three major hyperscale cloud providers: order backlogs expanded by an estimated $300 billion in aggregate, while capex guidance from that same group rose by roughly $150 billion across the 2025-to-2026 window, based on SocGen’s composite analysis.
Those figures gain credibility when you walk through the company-level moves underneath them. Hyperscaler combined capex shifted from approximately $380 billion in 2025 to approximately $660-690 billion in 2026, a trajectory corroborated across multiple public sources. Both Meta and Alphabet revised their 2026 capex ranges higher in response to AI demand and component costs.
| Hyperscaler Group | 2025 Capex | 2026 Capex | Change |
|---|---|---|---|
| Combined (Microsoft, Alphabet, Amazon, Meta, Oracle) | ~$380B | ~$660-690B | +$280-310B |
Note: The $660-690 billion figure is corroborated across public sources. The $300 billion backlog expansion is a SocGen/Kabra proprietary composite estimate rather than a single externally reported industry statistic.
A $300 billion backlog expansion is not a revenue line yet. But it is a forward commitment that gives suppliers multi-quarter revenue visibility, and that visibility is what changes how institutional investors price the supply chain. The distinction between the platforms generating AI revenue and the suppliers capturing AI infrastructure spend is where the sector allocation decision sits.
How AI capex moves through the supply chain
The reason the AI infrastructure story matters for S&P 500 sector performance, rather than just mega-cap technology returns, is the transmission path. Hyperscaler capex does not stay within information technology. It flows through four primary downstream channels, each creating earnings momentum in a different sector.
- Custom silicon and GPUs: Direct beneficiaries of hyperscaler AI compute buildout. This is the most visible link, covering semiconductor designers and fabricators supplying AI accelerators.
- Networking and data centre hardware: Server, switch, and interconnect suppliers capturing spend as data centre density scales. Revenue here tracks capex commitments with a short lag.
- Power and grid infrastructure: Utility-scale power demand from data centre load growth is pulling capital into generation, transmission, and grid modernisation at a pace utilities have not seen in decades.
The physical-economy channels
- Data centre real estate and construction: Physical footprint expansion requiring land, buildings, steel, electrical systems, HVAC, backup power, and automation equipment. This is the channel connecting AI capex directly to industrial-sector earnings.
AI infrastructure (GPUs, servers, data centres, and networking) represents an estimated 70-80% of total hyperscaler capex, according to sell-side estimates, implying a substantial but difficult-to-verify range of AI-specific spend flowing through these channels.
The linkage between AI data centre construction and industrial-category demand is the most under-discussed channel in mainstream investment commentary. It is also the one that explains why industrial earnings accelerated so sharply in Q2. That supply chain map tells you that sector exposure to AI infrastructure earnings growth is available without owning the hyperscalers themselves, and that is the portfolio construction insight most individual investors are missing.
Mapping the full AI supply chain across semiconductors, foundries, networking, and physical infrastructure reveals where the $660-690 billion in hyperscaler capex is concentrating profit and where suppliers capture durable multi-quarter revenue, rather than one-time project spend.
The industrial sector’s earnings story is not what most screens show
The numbers are the surprise. SocGen’s analysis, as presented by Kabra, shows that Q2 2026 brought large-cap industrial earnings per share growth of roughly 15%, while the equivalent figure for small-cap industrials reached approximately 30%.
The standout figure: Small-cap industrial EPS growth of approximately 30% in Q2 2026, according to SocGen/Kabra’s analysis, against a Q1 baseline where industrial earnings grew just 2-3%.
That step-change becomes sharper when you set it against the Q1 2026 baseline. In the prior quarter, industrial revenue was up approximately 10%, but earnings grew only 2-3%, with margins compressing roughly 1 percentage point versus the prior year. Kabra’s read on the sector also pointed to profit margins running at multi-year highs and a pattern of analyst upgrades outpacing downgrades, both of which Kabra characterised as forward momentum indicators.
| Metric | Q1 2026 | Q2 2026 (SocGen/Kabra) |
|---|---|---|
| Revenue growth (YoY) | ~10% | Strengthening |
| Large-cap EPS growth | ~2-3% | ~15% |
| Small-cap EPS growth | ~2-3% | ~30% |
| Margins | Down ~1pp vs prior year | Multi-year highs |
Three structural demand drivers sit behind the acceleration:
- Reshoring and supply-chain reconfiguration: Manufacturing and logistics infrastructure investment driven by policy incentives and strategic diversification away from concentrated sourcing.
- Infrastructure and grid investment: Public and private capital flowing into power, transportation, and grid modernisation at scale.
- Data centre construction demand: Physical AI infrastructure buildout creating sustained demand for steel, electrical systems, HVAC, backup power systems, and automation equipment, the direct link back to the capex story above.
Small-cap industrial EPS growth of approximately 30% against a Q1 baseline of 2-3% signals a step-change in demand conditions, not a continuation of trend. That distinction matters for how you size a position. The industrials story offers earnings growth that is structurally supported across multiple demand drivers and is not dependent on AI platform revenue monetisation, which makes it a portfolio diversification argument as much as a return argument.
Where the risks sit in both sector stories
Understanding the thesis is necessary. Understanding where it breaks is what separates an informed position from a reactive one.
AI capex risks
- End-customer monetisation is the binding constraint. The real ceiling on sustained hyperscaler capex is whether enterprise and consumer customers successfully monetise AI tools in ways that justify ongoing infrastructure investment. This is the variable most stressed by institutional commentators. If enterprise adoption stalls or AI use cases fail to generate measurable return on investment, the capex trajectory will compress.
- Backlogs are commitments, not revenue. Order backlogs and remaining performance obligations reflect commitments made, not revenue already earned. They do not absorb potential project delays, contract renegotiations, or execution risk. A $300 billion backlog expansion is a forward signal, not a forward guarantee.
Industrials sector risks
- Margin sustainability faces pressure. Elevated input costs and labour cost pressure have already compressed margins in some quarters, as Q1 2026 demonstrated with a 1 percentage point margin decline. Whether Q2 represents a genuine inflection or a temporary uplift depends on the durability of the demand drivers described above.
- Small-cap cyclicality is the asymmetric risk. Smaller industrial companies carry elevated sensitivity to the economic cycle. The same structural tailwinds producing 30% EPS growth create concentrated downside exposure if infrastructure or reshoring spend decelerates. The growth rate reflects both the opportunity and the risk.
Industrial sector valuations tell a more complicated story than the earnings momentum alone: Morningstar’s H2 2026 analysis placed the sector approximately 14% above fair value, with the premium concentrated in AI data centre construction plays and electrical equipment manufacturers, making stock selection within the sector more consequential than broad sector exposure.
Both sector stories are sound but contingent. AI capex sustainability depends on demand-side monetisation. Industrials growth depends on the durability of reshoring and infrastructure spend. Neither of those variables is resolved by the Q2 data alone.
Where earnings visibility actually sits heading into the second half
The two sector stories are complementary rather than competing. AI infrastructure capex creates durable supplier earnings visibility measured in quarters, not months, given the scale of the $380 billion to $660-690 billion capex trajectory. Industrials deliver earnings growth from multiple demand sources that are partially, but not entirely, dependent on AI construction demand.
The 31% surprise rate versus the 7% historical average is evidence of broad-based rather than concentrated earnings strength. That breadth, more than any single company’s beat, is the structural signal worth carrying into second-half positioning. SocGen’s Kabra highlighted rising analyst upgrade activity in industrials as an additional forward momentum indicator, suggesting the re-rating cycle has further to run.
Institutional capital rotation into industrials and energy in 2026 has already produced year-to-date sector returns exceeding 16% for industrials against a broad market return under 1%, making the sector allocation case visible in price data as well as in earnings fundamentals.
For each sector story, the monitoring variables are specific:
- AI infrastructure: Watch enterprise AI monetisation rates and whether hyperscaler capex guidance holds or compresses at the next reporting cycle. The backlog-to-revenue conversion rate is the leading indicator.
- Industrials: Watch reshoring policy continuity and infrastructure appropriations at the federal level. If either decelerates, small-cap industrials are the first to feel it in margins and order flow.
The market’s earnings base is wider than mega-cap technology exposure alone. Investors who have not mapped that breadth are underexposed to the sectors where forward visibility is strongest. Q2 2026 made that visible. The question heading into the second half is whether you have positioned for it.
This article is for informational purposes only and should not be considered financial advice. Investors should conduct their own research and consult with financial professionals before making investment decisions. Past performance does not guarantee future results. Financial projections are subject to market conditions and various risk factors.