
#
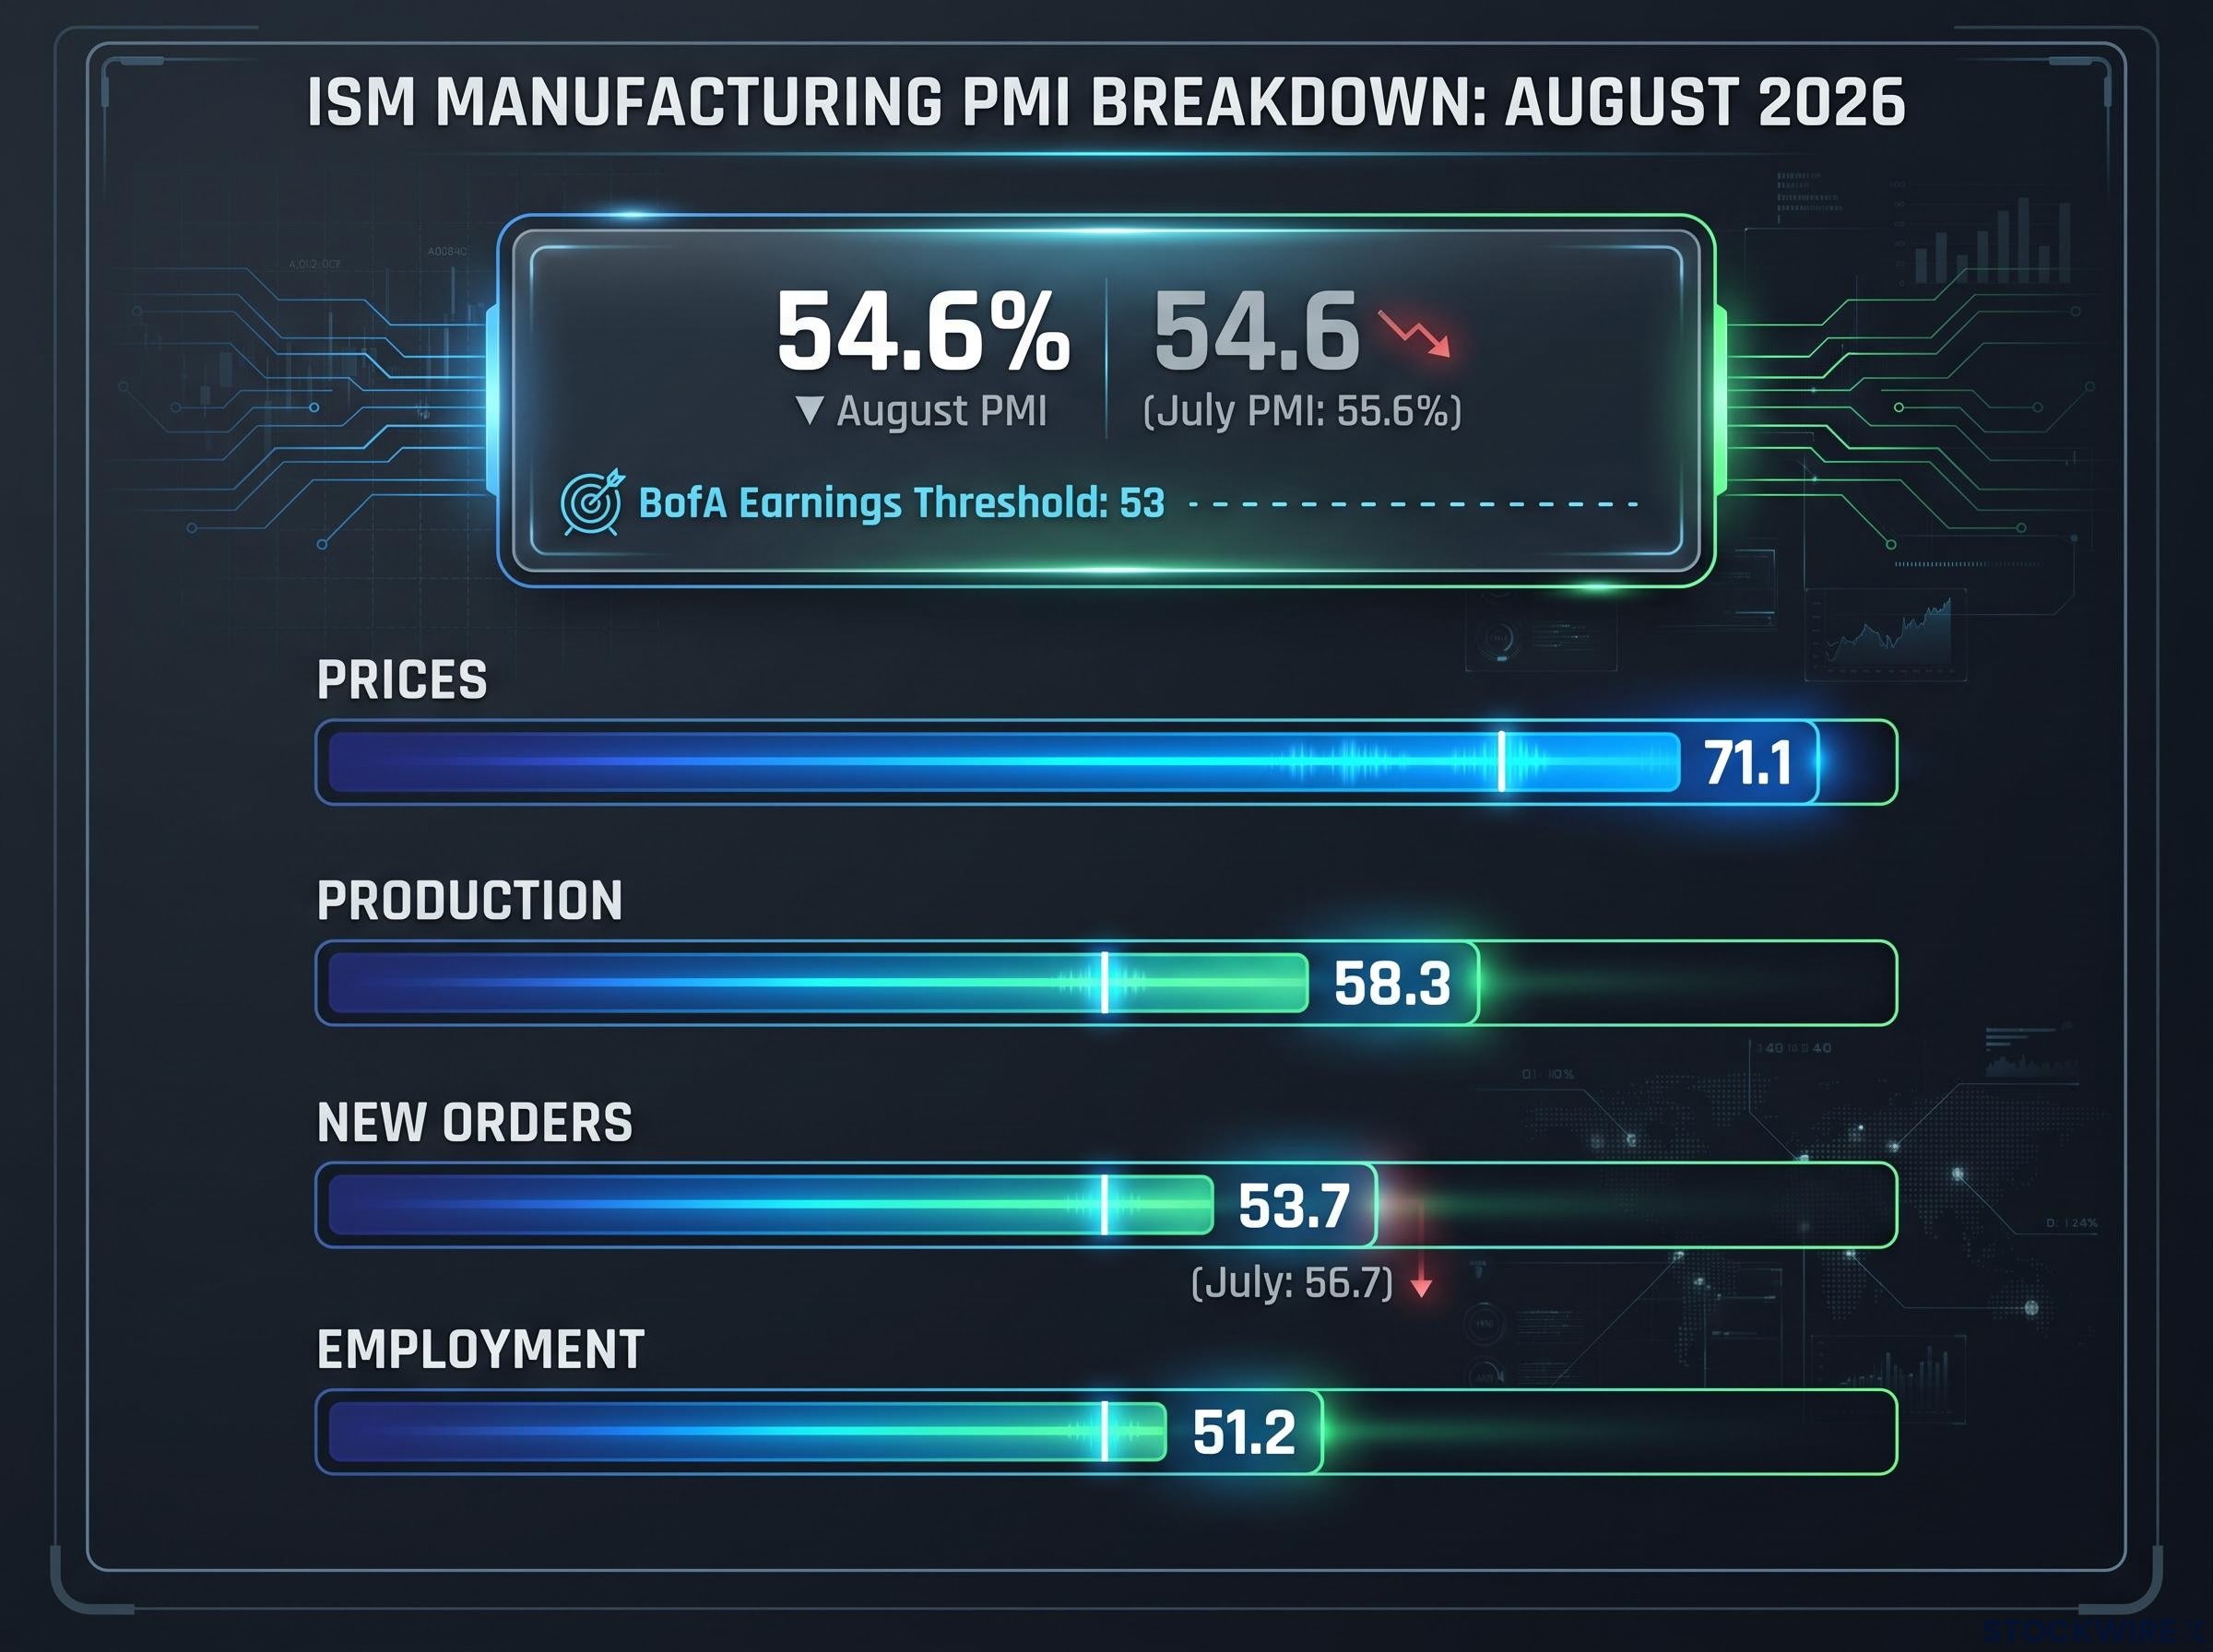
Consensus expects the S&P 500 to deliver roughly 10-15% earnings growth in 2027. That forecast quietly rests on an assumption most investors never explicitly signed off on: that U.S. manufacturing stays above a level it has already begun sliding away from. The ISM Manufacturing PMI printed 54.6% in August 2026, down from 55.6% in July, and its new-orders sub-index fell to 53.7 from 56.7. The direction, not just the level, is what makes those numbers worth a second look.
That is the tension Bank of America strategists Jared Woodard and Michael Hartnett have put in front of clients. Their warning arrives at a pointed moment. Weekly global equity inflows that peaked near $52 billion in July have swung to roughly $7 billion in weekly outflows, and U.S. equity funds shed $14.2 billion over the three weeks to mid-September. The Federal Reserve, meanwhile, has signalled a return to monetary discipline.
Here is what the BofA earnings warning actually means for your portfolio: it gives you a specific threshold to test your earnings assumptions against, and a concrete picture of what the alternative positioning looks like. This is a diagnostic tool, not a market outlook. By the time you finish, you will know which scenario your current allocation is quietly betting on.
Why the 53 threshold is the number that matters most right now
Start with what the ISM Manufacturing PMI actually measures. It is a survey of purchasing managers across U.S. factories, and while it reads as an industrial activity gauge, strategists treat it as something more useful: a leading proxy for the revenue conditions that drive corporate profits. Stronger manufacturing tends to coincide with higher nominal sales, better pricing power, and more operating leverage. All three feed directly into earnings.
The ISM Manufacturing PMI report for August 2026 confirms the index registered 54.6 percent, with ISM’s own published methodology noting that a PMI above 47.5 percent over time generally indicates expansion of the overall economy, the same correlation that underpins strategists’ use of the index as a leading earnings proxy.
The link runs through GDP. ISM’s own historical mapping, cited in a Piedmont Crescent Capital analysis of the August report, associates the current PMI level with roughly 2.4% real GDP growth. That is above-trend, and above-trend activity is historically consistent with double-digit earnings gains. When PMI drifts toward 50-51, the implied slowdown starts showing up as weaker revenues and margin pressure, and consensus forecasts get revised down to catch up with reality.
That is where BofA plants its flag.
The August flash PMI release landed into a macro backdrop already under stress from Dollar weakness and a softer NFP print, conditions that amplified how the manufacturing and services sub-indices were interpreted across currency and equity markets in the days preceding the official ISM survey.
BofA strategists argue that consensus earnings growth of 10-15% for 2027 requires the ISM manufacturing index to remain sustainably above 53.
Read that against where the index sits. August’s 54.6 is above the line, but not by much, and it fell from July’s four-year high. The trailing 12-month average is 51.8, with a low of 47.9 in December, which tells you the index has already spent time below 50 in the past year before recovering. The buffer above 53 is real but narrow.
What the new-orders decline signals about forward momentum
New orders are the leading edge of the PMI. Current production reflects work already booked; new orders reflect demand still coming in the door. That distinction matters right now, because the two are pulling apart.
Production held strong at 58.3 in August. New orders came in at 53.7. That gap is itself a warning: factories can keep output elevated for a while on existing backlogs even as incoming demand cools, but that arrangement does not hold indefinitely.
Here is where the August sub-indices stood:
- New orders: 53.7 (down from 56.7 in July)
- Production: 58.3
- Employment: 51.2
- Prices: 71.1
The forward signal is in that new-orders number. If your earnings thesis for 2027 was not built on an explicit view about where ISM travels from 54.6, then it was built on an assumption you may never have consciously made. Watching whether new orders stabilise or keep falling over the next couple of readings lets you update your conviction before the earnings misses arrive, not after.
When big ASX news breaks, our subscribers know first
How crowded is the bullish trade, exactly?
Positioning is the second leg of BofA’s argument, and the numbers show a trade that ran to an extreme before starting to reverse. Earlier in 2026, the appetite was enormous. U.S. equity funds attracted approximately $63.8 billion in capital during the week ending 16 September 2026, and total equity fund inflows for the week ending 16 September 2026 reached about $79.3 billion.
Then sentiment turned. A Bloomberg report dated 11 September 2026 put three-week U.S. equity fund outflows at $14.2 billion, the largest since January, citing EPFR Global.
The velocity is the story: global stock funds swung from averaging $52 billion in weekly inflows in July to roughly $7 billion in weekly outflows by mid-September.
Here is the flow picture in one place:
| Time Period | Direction | Amount | Notes |
|---|---|---|---|
| July 2026 | Inflow (weekly avg) | $52B | Global equity funds, peak appetite |
| Week to 16 Sep 2026 | Inflow | $79.3B | Total equity funds, single week |
| 3 weeks to 11 Sep 2026 | Outflow | $14.2B | U.S. equity funds, largest since January |
| Mid-September 2026 | Outflow (weekly avg) | ~$7B | Global stock funds, sentiment swing |
Fund flows are a positioning barometer, not a price signal. But when the gap between peak inflows and the onset of outflows is this large and this sudden, it tells you the path of least resistance for sentiment has shifted.
There is a detail worth holding onto. In BofA’s client flow note for the week ending 31 August 2026, clients were net buyers of U.S. equities by $7.0 billion, with institutional clients adding $5.8 billion. Private retail clients, however, were net sellers for the sixth consecutive week. That split tells you who is still holding risk at the extreme and who has already begun trimming.
BofA’s read is straightforward: crowded positioning amplifies the downside if the macro picture disappoints. When everyone is already in, there is no marginal buyer left to cushion a stumble.
Market breadth deterioration was already visible beneath the headline S&P 500 gains earlier in 2026, with only 23% of index constituents outperforming the benchmark and BofA’s Sell Side Indicator sitting within two percentage points of a sell signal, a set of conditions that makes the current crowded positioning even harder to unwind cleanly.
The bull case in plain terms: why Goldman, Barclays, and Jefferies disagree
The competing view deserves its full weight, because it is not a fringe position. Goldman Sachs, Barclays, and Jefferies each project earnings that meet or exceed the consensus BofA is questioning, and they build the case on more than optimism.
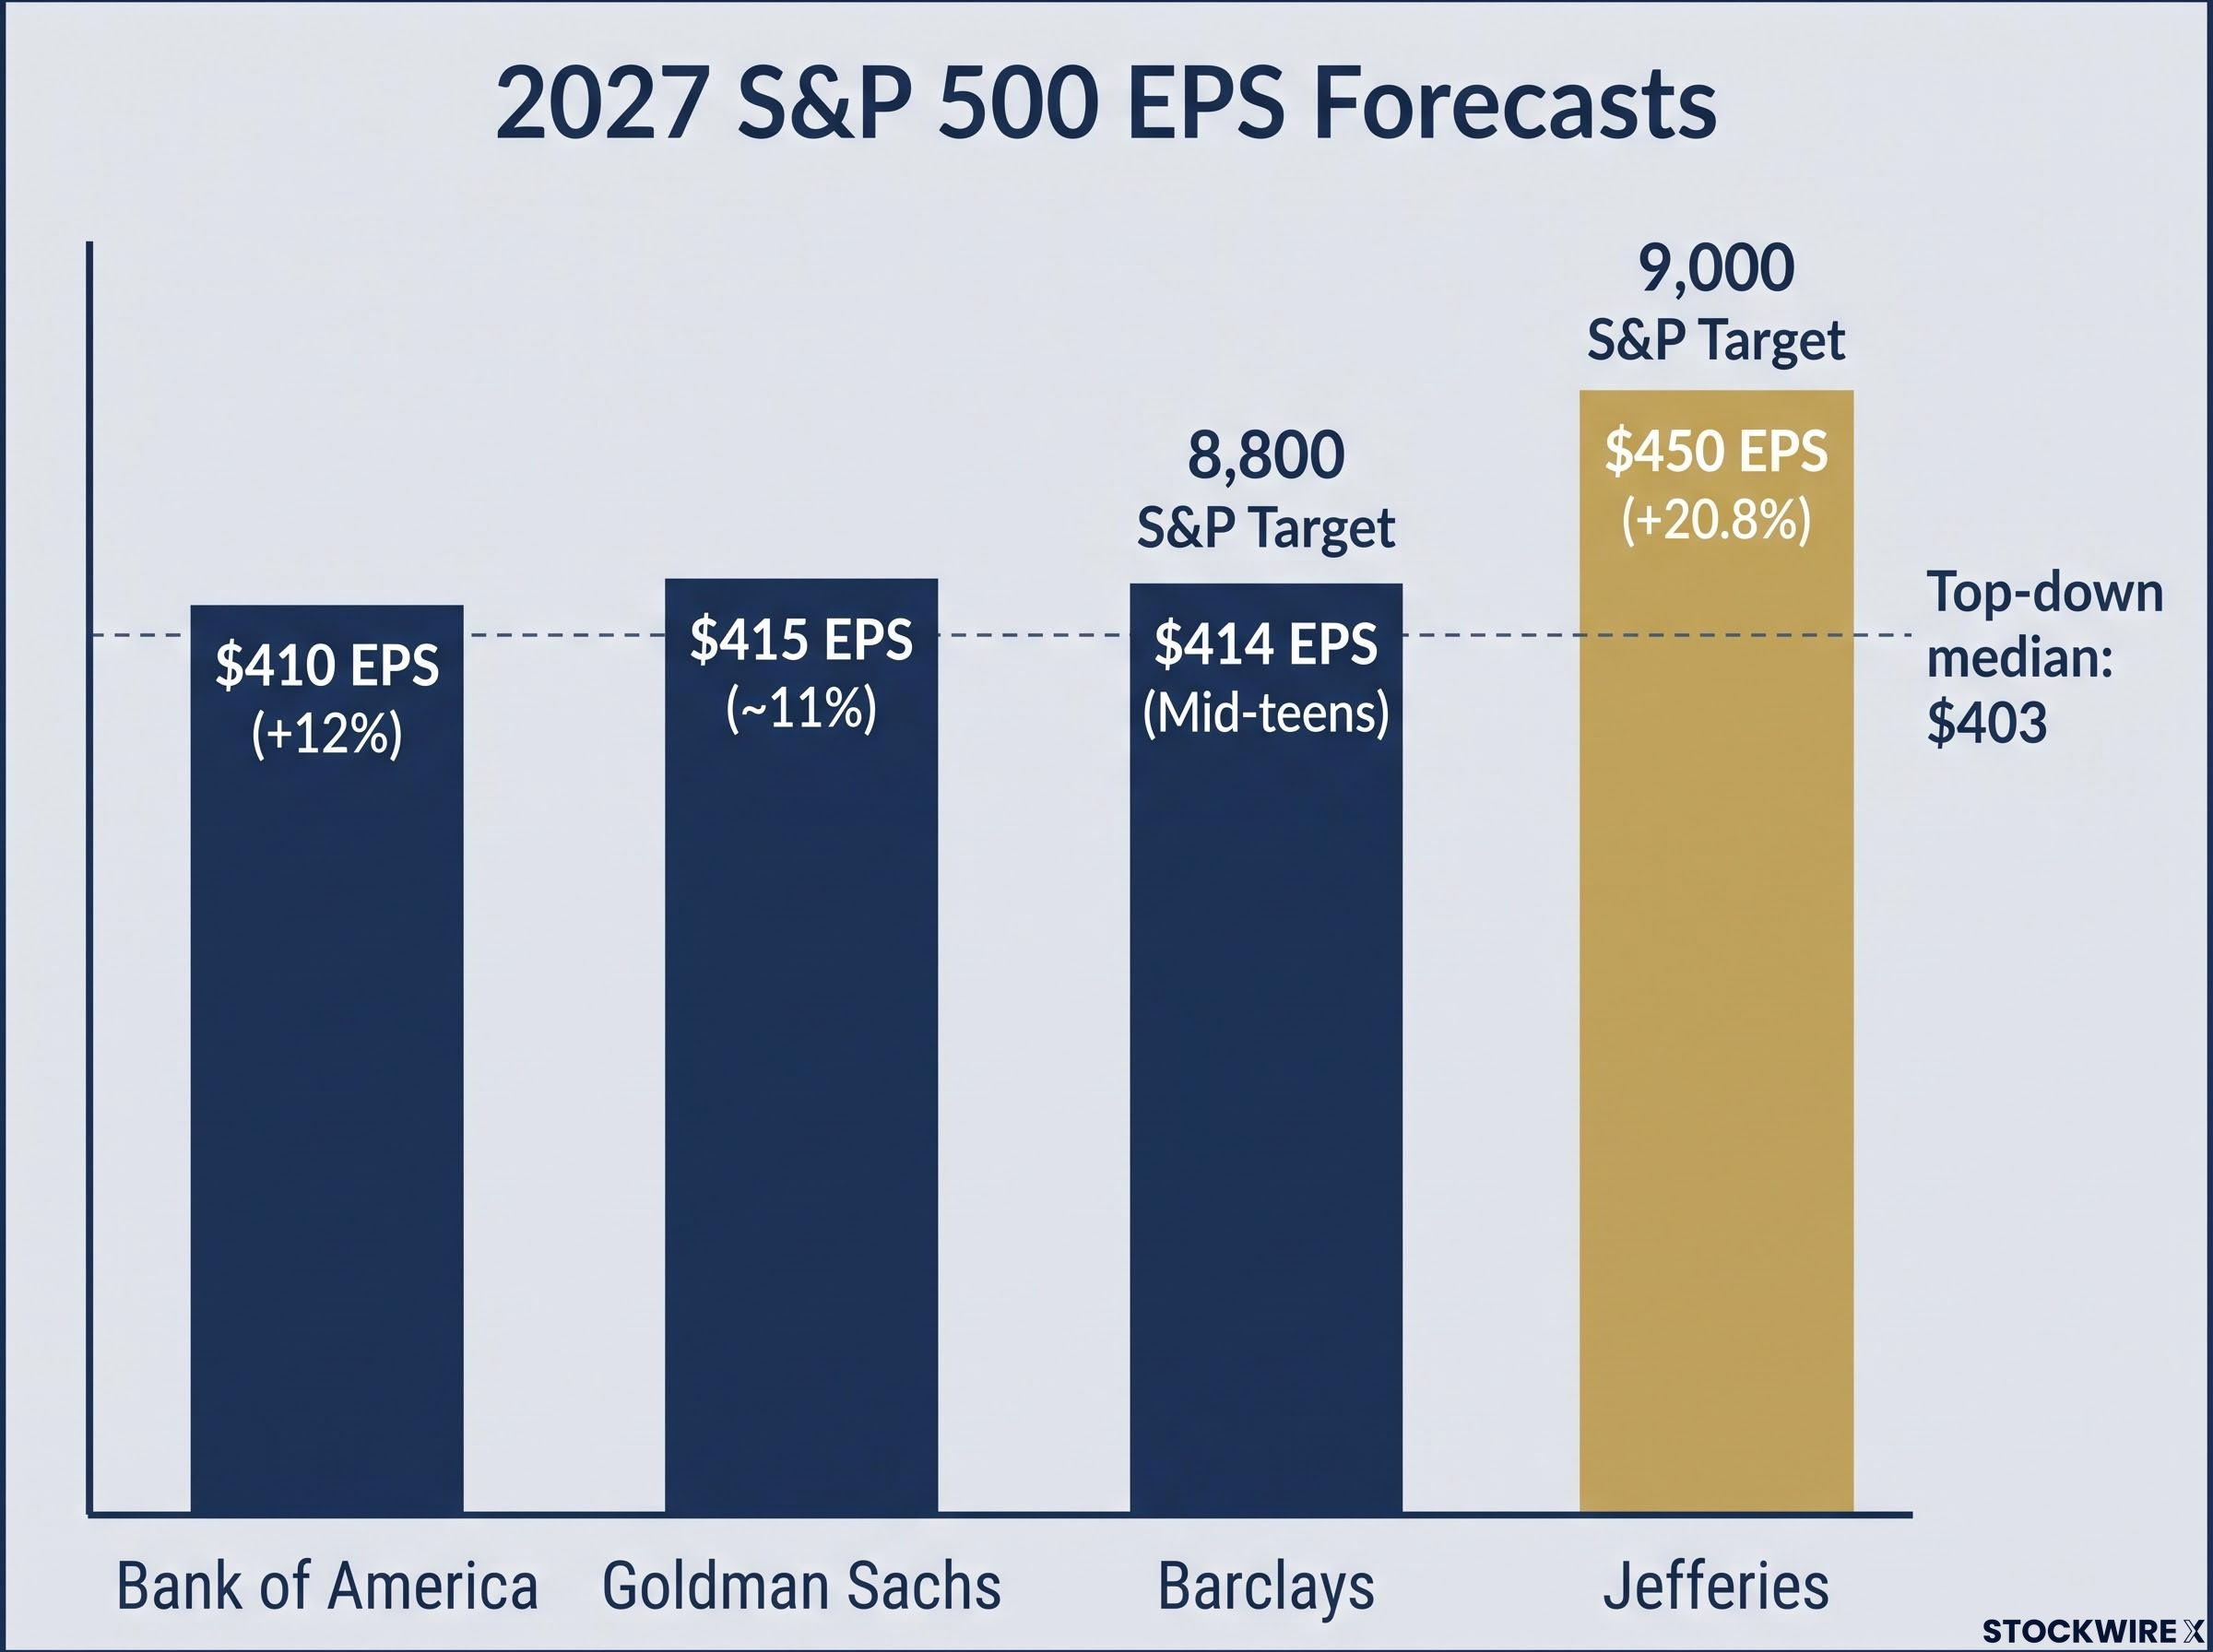
Goldman Sachs forecasts 2027 EPS of $415, around 11% growth, with AI contributing an estimated 1-2 percentage points annually. Barclays sits close, at $414 for 2027, and carries a year-end 2027 S&P 500 target of 8,800, describing the recent earnings season as a “standout” led by technology. Jefferies is the most bullish of the three, projecting 2027 EPS of $450, a 20.8% year-on-year jump, with an S&P 500 target of 9,000.
Set against BofA’s own $410 forecast, characterised as “above-trend but decelerating”, the disagreement comes into focus.
| Institution | 2027 EPS Estimate | YoY Growth | S&P 500 Target |
|---|---|---|---|
| Bank of America | $410 | +12% | Not specified |
| Goldman Sachs | $415 | ~11% | Not specified |
| Barclays | $414 | Mid-teens | 8,800 |
| Jefferies | $450 | +20.8% | 9,000 |
Bottom-up consensus lands near $405-420 for 2027, above the top-down strategist median of $403. The gap between the two is itself a clue that analysts covering individual companies are more optimistic than strategists modelling the macro backdrop.
The AI decoupling argument and its limits
The structural pillar of the bull case is AI-driven productivity. The argument runs like this: high-margin software and AI-related revenue streams are less tethered to manufacturing conditions than old-economy revenues. If a large and growing share of S&P 500 earnings comes from businesses whose margins expand through automation rather than factory throughput, then the ISM threshold matters less than it historically did. Earnings could, in theory, decouple from manufacturing PMI.
That is a genuine analytical possibility, not a hand-wave. But it has limits worth naming.
The structural case for AI decoupling from manufacturing conditions carries an embedded risk that the bulls rarely price in: AI earnings inflation from circular financing arrangements and deferred depreciation may be flattering the very profit figures that justify high-multiple AI exposure, meaning the margin expansion story could be narrower than it appears even before manufacturing conditions become a headwind.
Even high-margin AI businesses sell into an economy. If consumer demand softens or enterprise spending slows, top-line pressure eventually reaches them too, and PMI remains a reasonable proxy for that broader spending environment. The gap between Jefferies’ +20.8% and BofA’s +12% is not a rounding difference. It is a structural disagreement about whether AI has rewired the relationship between manufacturing and profits. Whichever way you hold index exposure, you are implicitly endorsing one side of that bet.
What quality, value, and dividends actually mean as a portfolio posture
BofA’s tactical answer to all this is a preference for quality, value, and dividend yield, attributed to Woodard and Hartnett. Stripped of the factor labels, that means leaning toward sectors like consumer staples, utilities, financials, and industrials: businesses with steadier earnings, lower valuations, and reliable payouts, rather than high-multiple growth names.
The reasoning follows from the first three sections. Accommodative policy tailwinds are fading, the ISM buffer is thin, and positioning has started to reverse. In that setup, quality and value historically hold up better than speculative growth.
BofA is explicit that this is not a call for a full defensive rotation at this stage.
That caveat matters, because a defensive tilt carries real costs if the bulls are right.
Historical episodes when consensus ran ahead of manufacturing
The pattern BofA is leaning on has precedent. In late 2017 and 2018, consensus earnings expectations were strong following tax cuts and synchronised global growth, but manufacturing PMIs peaked in early 2018 and rolled over as trade tensions and tighter conditions took hold. The gap closed the hard way: earnings revisions turned lower and the market delivered the sharp Q4 2018 sell-off.
The 2021-2022 episode rhymes. Manufacturing readings and earnings forecasts stayed elevated longer than usual, but as supply-chain stress, inflation, and policy tightening intensified, PMIs and margins eventually compressed, and crowded high-valuation trades took the largest drawdowns. The through-line is consistent: persistent gaps between elevated consensus and weakening manufacturing tend to resolve through downgrades or factor rotation.
Here are the specific trade-offs of tilting defensive now:
- Interest-rate sensitivity: rising long-term yields can derate bond-like dividend stocks, eroding their appeal.
- Factor underperformance risk: value and quality can lag for multi-year stretches during prolonged megacap growth rallies.
- Cyclical exposure: value names in financials, energy, and traditional industrials can suffer heavily if a mild deceleration deepens into recession.
- Reinvestment constraint: high payout ratios limit the capital available to chase new growth themes such as AI or reshoring.
The key distinction: BofA is not calling a bear market. It is flagging an asymmetry between how bullishly investors are positioned and the macro conditions that would need to hold for that positioning to pay off. Understanding that difference is what separates a deliberate repositioning from a reactive one.
For investors exploring what the quality-value-dividend tilt actually looks like in a structured portfolio, our dedicated guide to the Dividend Aristocrat strategy examines 35 years of backtested data, including how Aristocrats outperformed the S&P 500 by an average of 13 percentage points in every calendar-year market decline since 1989.
Three variables that will determine whether BofA or the bulls are right
The useful part of this debate is that it is testable in real time. Three variables carry a data event in the next 60-90 days, which means you do not have to wait until 2027 to see which scenario is unfolding.
- ISM new orders. The trajectory over the next two to three monthly readings will show whether August’s softening was noise or the start of a trend. Stabilisation supports the bulls. Continued declines toward 50-51 validate BofA’s threshold concern.
- Federal Reserve posture. BofA read the September FOMC statement as a signal of renewed monetary discipline. Any further communication firming up the end of accommodative conditions would strengthen the macro-headwind argument and pressure high-multiple growth stocks.
- Q3 2026 earnings season. Corporate guidance for 2027 will begin to resolve the $410 to $450 forecast range. Guidance clustering near the $405-420 consensus favours the bulls. More cautious language on manufacturing and consumer conditions would tilt toward BofA.
With August ISM at 54.6, the buffer above 53 is narrow enough that a single soft reading would sharpen the debate considerably.
What investors should take from BofA’s warning before Q3 earnings arrive
The central tension is not that one side is obviously right. Bullish positioning was built on conditions, accommodative policy, sustained manufacturing strength, and uninterrupted earnings momentum, that are now at some degree of risk. Yet the structural AI-productivity case is not easily dismissed either.
The practical takeaway is an audit. Map your current sector and factor exposures against the quality-value-dividend framework Woodard and Hartnett favour, and identify where you are implicitly endorsing the Jefferies scenario of +20.8% growth versus BofA’s more cautious $410. If you hold broad index exposure, you have already taken a side, whether you meant to or not.
From there, watch the three variables: the next ISM release, any Fed communication, and Q3 guidance against the $405-420 consensus. The $14.2 billion in recent outflows and the thinning ISM buffer are the signposts.
The value of BofA’s warning is not that it will prove correct. It is that it forces the manufacturing assumption inside your earnings thesis to become explicit rather than invisible.
This article is for informational purposes only and should not be considered financial advice. Investors should conduct their own research and consult with financial professionals before making investment decisions. Past performance does not guarantee future results. Financial projections are subject to market conditions and various risk factors, and forward-looking statements are speculative and subject to change based on market developments.