#
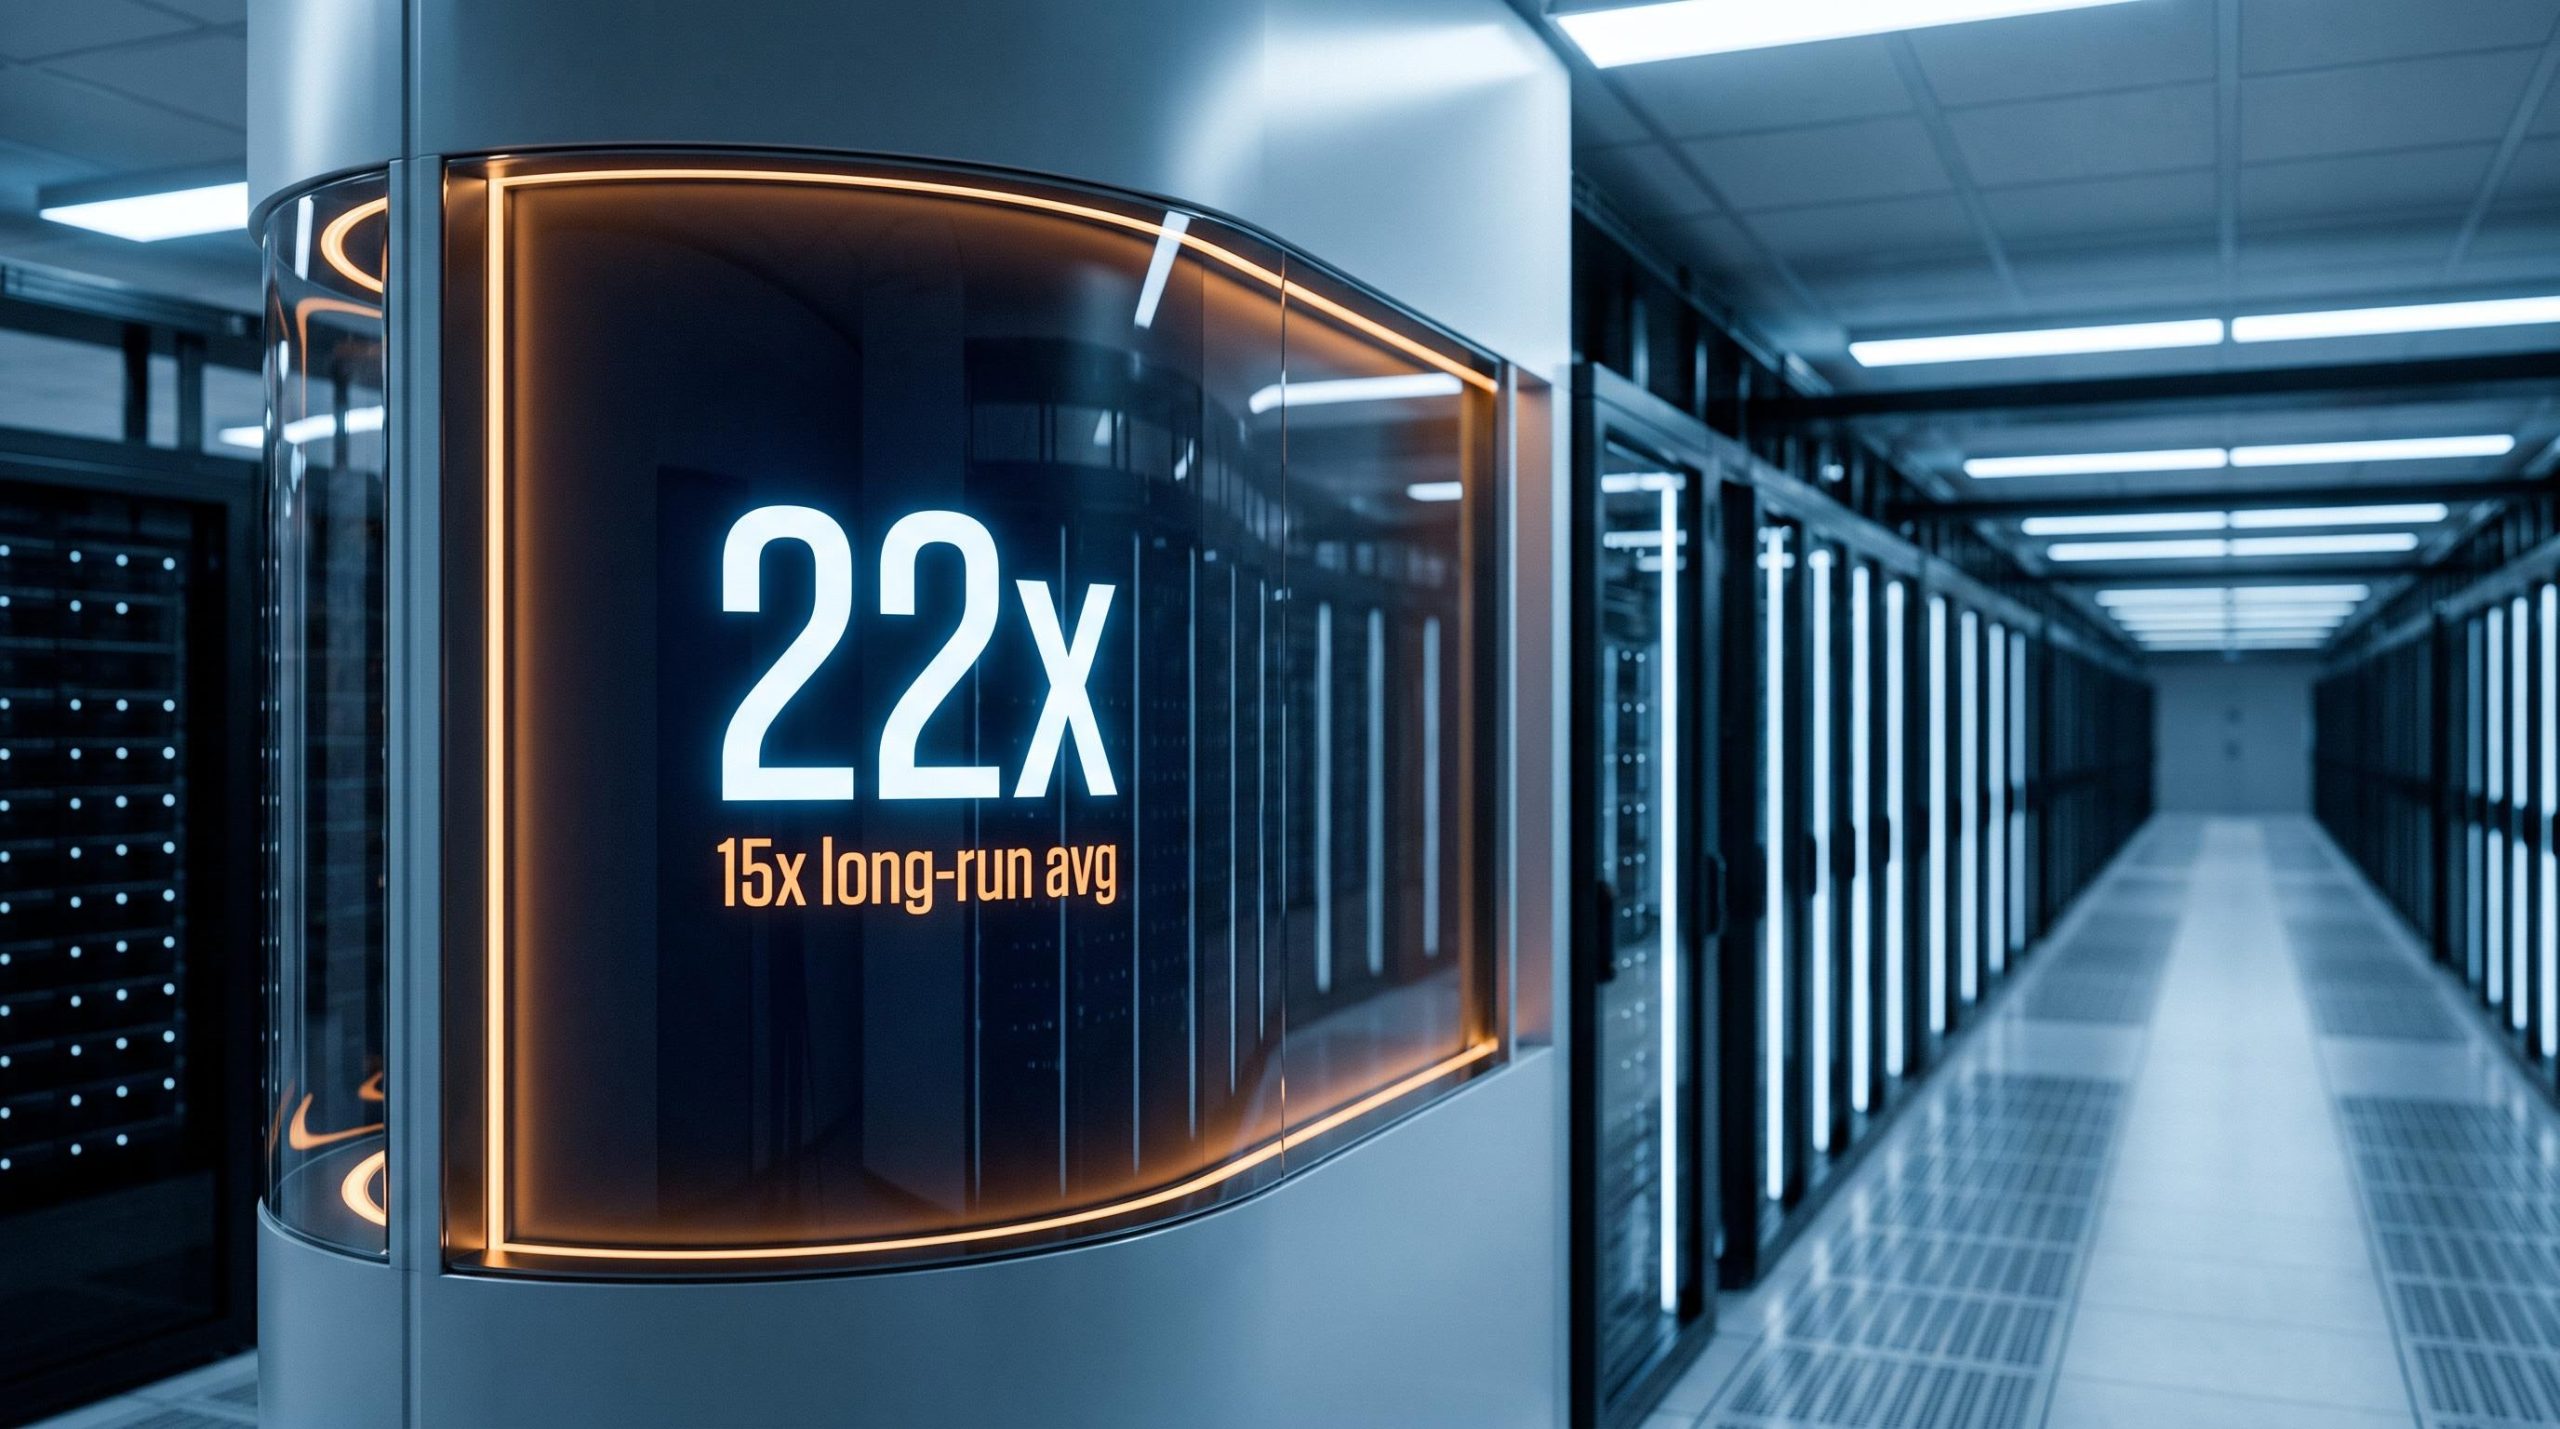
The S&P 500 is trading near a forward price-to-earnings ratio of 22x, according to Goldman Sachs. That multiple is only defensible if earnings keep climbing fast. The problem is that a meaningful slice of those earnings may be a product of accounting choices and financial engineering rather than genuine economic output.
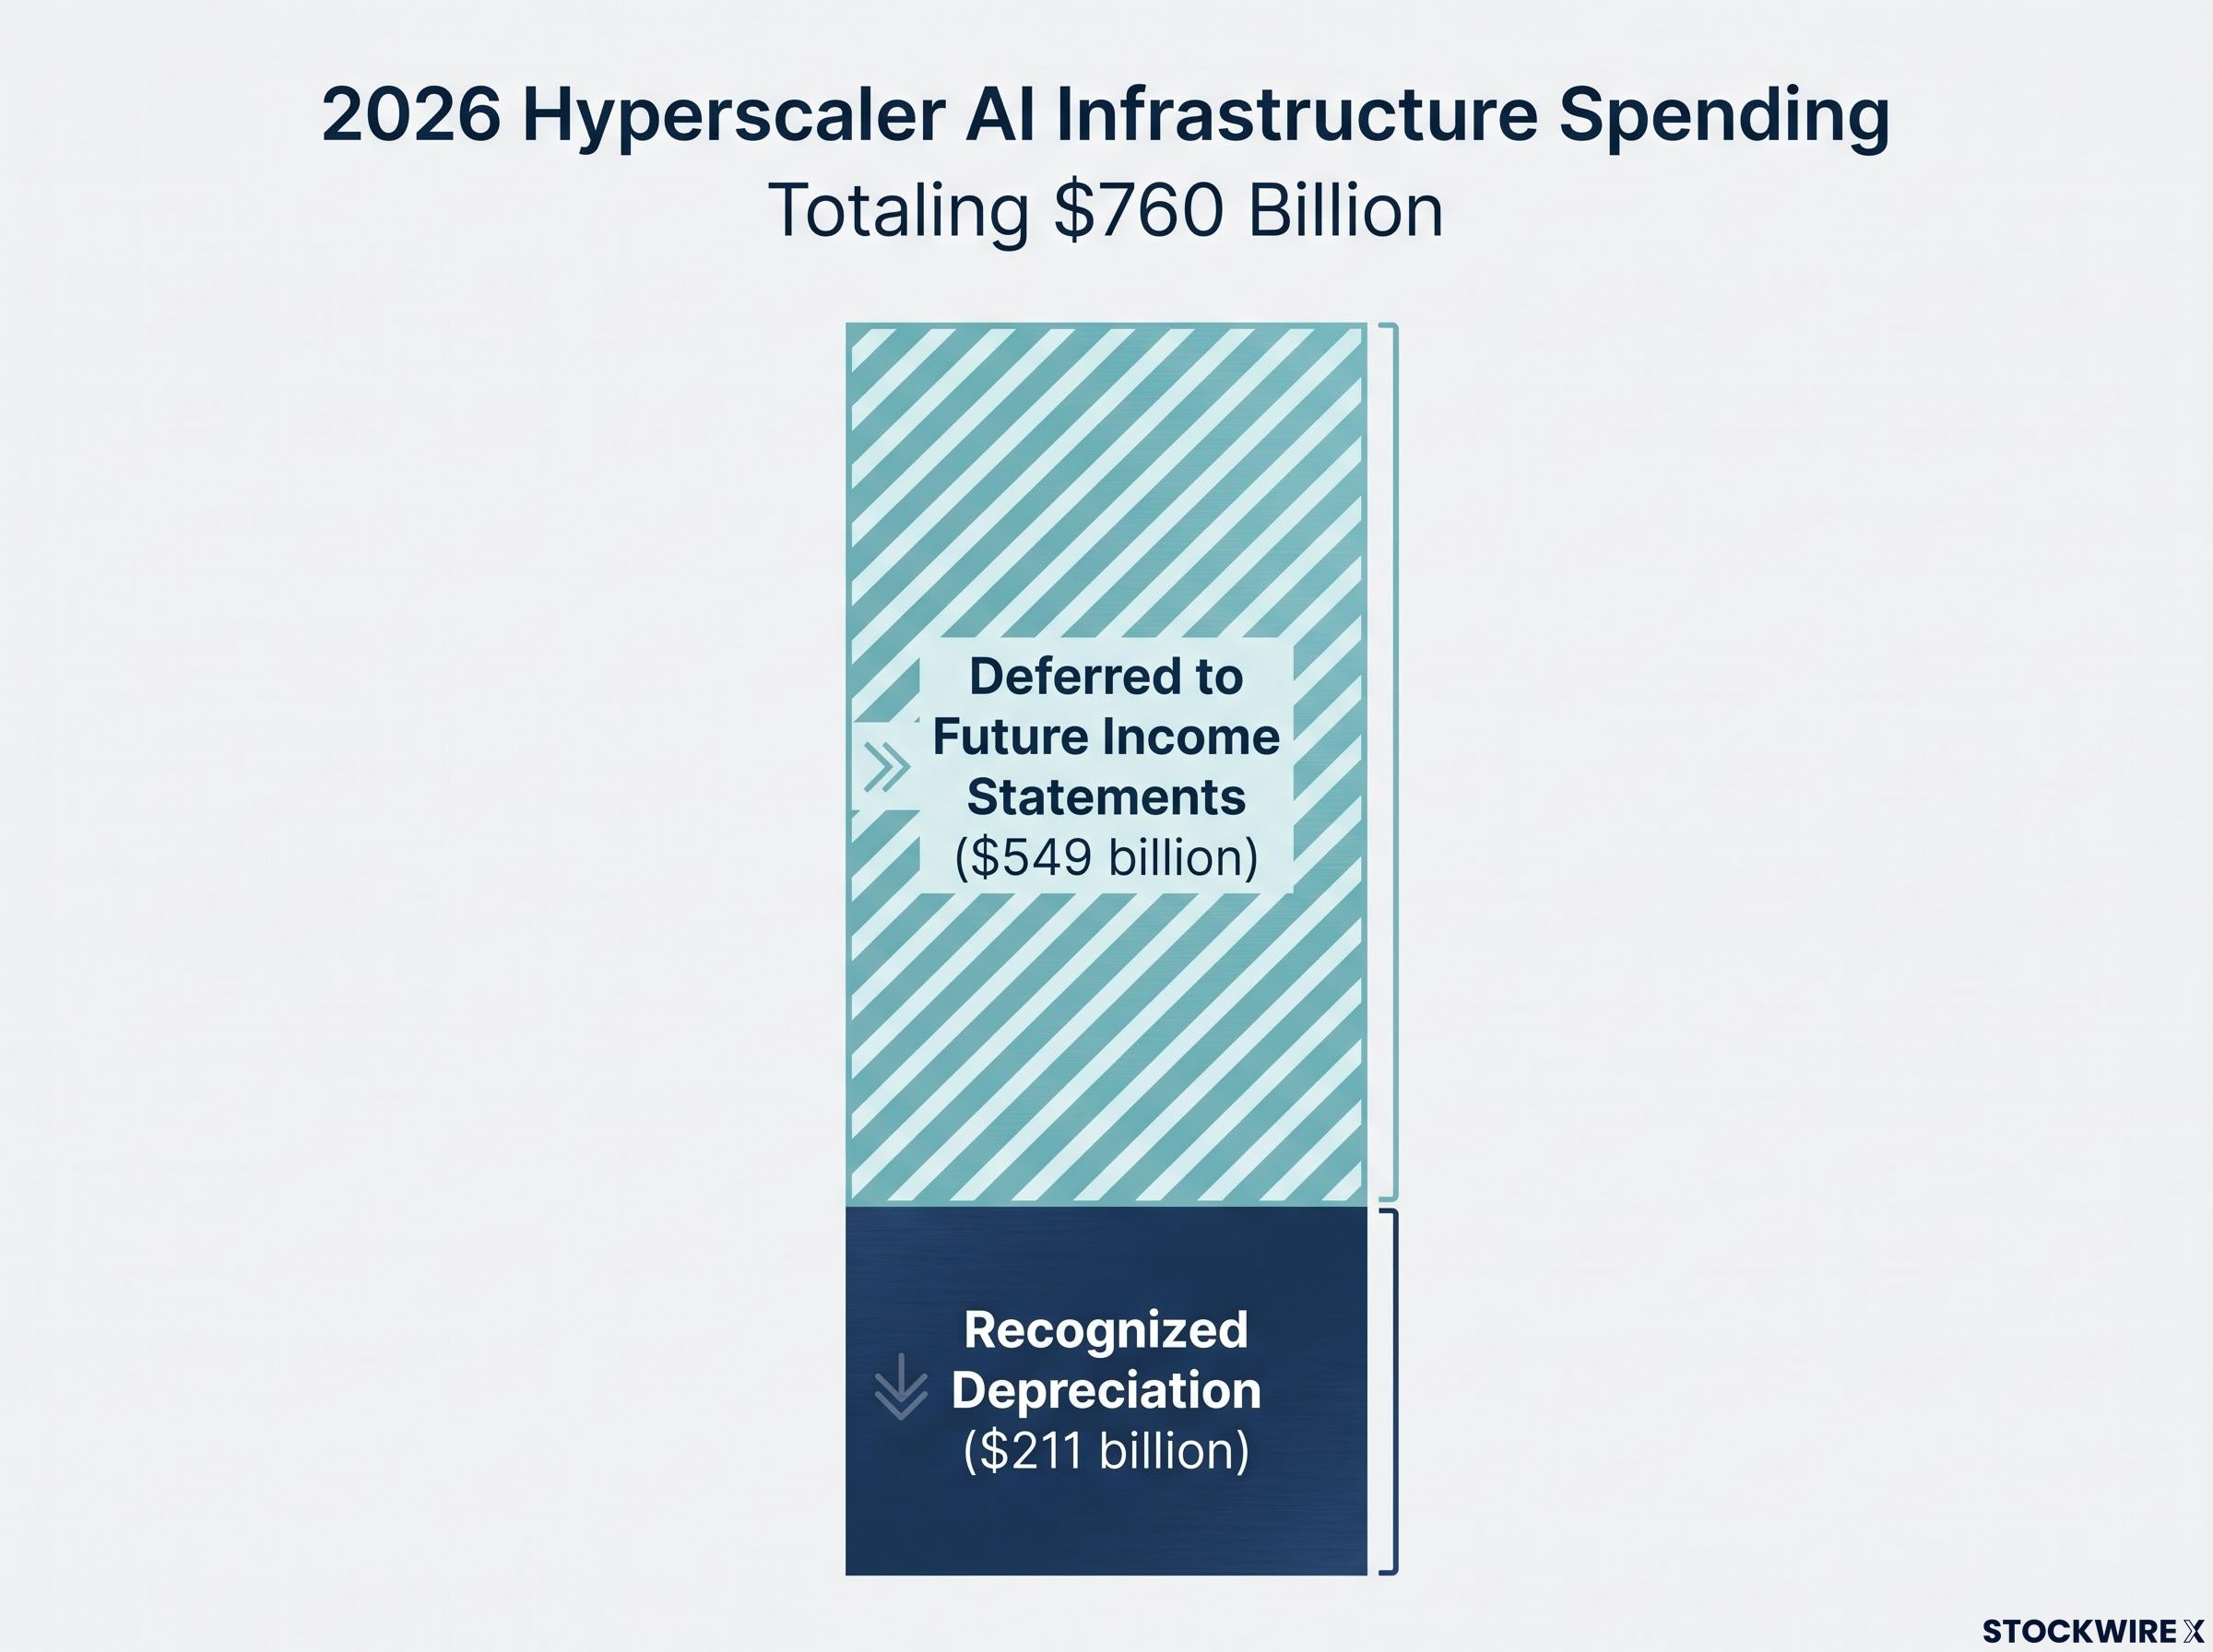
Here is why that gap matters right now. Roughly $760 billion in hyperscaler capital expenditure is being deployed in 2026 alone, yet only about $211 billion of that will land on income statements as depreciation this year. The rest is deferred. At the same time, circular investment arrangements between the largest AI ecosystem participants are generating reported revenues that may be recycled capital rather than fresh demand.
Two mechanisms, running simultaneously, are flattering earnings at the precise moment valuations demand earnings be at their highest. After reading this, you will know which specific financial mechanisms to look for when evaluating any AI-exposed position, and why the distance between reported and economic earnings determines whether current prices are justified or fragile.
The earnings number Wall Street is using may already be wrong
Actual S&P 500 earnings growth averaged roughly 6% annually over the prior five-year period. That stretch included substantial monetary stimulus and no recession, which is about as favourable a backdrop as earnings ever get.
Now look at what analysts are projecting for 2026. Estimates run from 12% at the conservative end to a reported 32% at the aggressive end, with much of the consensus sitting well above the historical 6% base rate. The research is explicit that these figures conflict, so treat the range itself as the honest picture rather than any single headline number.
The bullish case for that leap rests on two assumptions that have not yet been tested at scale: that AI productivity gains translate into measurable earnings per share, and that AI-related investment gains keep rising rather than reversing.
Goldman Sachs embedded assumption A 0.4 percentage point AI productivity boost to EPS in 2026, rising to 1.5 percentage points in 2027.
Those are concrete, and they are also modest relative to the growth being priced. The valuation gap is where the tension becomes visible.
| Earnings scenario | Annual EPS growth | Context at 15x long-run average |
|---|---|---|
| Historical reality (prior 5 years) | ~6% | Consistent with a multiple near the long-run 15x |
| Conservative 2026 projection | ~12% | Requires a premium above the historical multiple to justify |
| Aggressive 2026 projection | Up to ~32% | Only sustainable if AI productivity gains compound as forecast |
The reported figure that AI-driven stocks have accounted for over 80% of S&P 500 gains in 2026 is flagged as unverified in the research, but it points at the concentration risk clearly enough.
Megacap concentration in the S&P 500 compounds the valuation problem: four companies commanding a combined $11.6 trillion market capitalisation represent over 19% of the index, meaning a correction in AI-exposed names would propagate through passive vehicles in ways that a more distributed index would not permit.
Here is what the gap between a 6% historical growth rate and a 22x forward multiple, against a long-run average near 15x, actually tells you. The market is not pricing what has happened. It is pricing what must happen next, and a great deal has to go right for current prices to hold.
When big ASX news breaks, our subscribers know first
How circular money flows are inflating the revenue lines investors trust
Start with a simple observation. When a chipmaker invests billions into a customer, and that customer then spends billions buying the chipmaker’s hardware, the same dollar can be counted twice: once as an investment, once as a sale.
That is the circular financing pattern, and the research documents it as arrangements where the same capital flows simultaneously as a vendor payment and as an equity stake. The consequence is that a portion of reported revenue is recycled investment rather than independently generated demand.
The scale is not trivial. Nvidia has committed approximately $99 billion in equity investments into other companies, with over $40 billion of that committed in 2026 alone (both figures flagged as unverified in the research).
The pattern repeats across the ecosystem:
- Nvidia and OpenAI: Nvidia agreeing to invest up to $100 billion in OpenAI over about 10 years, while OpenAI commits to build data centres filled with Nvidia GPUs.
- Microsoft, Nvidia and Anthropic: Microsoft and Nvidia together investing roughly $15 billion in Anthropic, while Anthropic commits to spend about $30 billion on Microsoft Azure and Nvidia chips.
- Nvidia’s credit guarantees: Nvidia offering guarantees of up to $105 billion to support an OpenAI-linked data centre build-out in Ohio.
Each of these figures is flagged as unverified in the research, but the structural commonality is the point. Money leaves one balance sheet and returns as revenue on the same or a connected one.

There is a second-order problem here too. Because these agreements are reciprocal, they bind the fates of interconnected companies. A shock to one entity does not stay contained; it propagates across the ecosystem.
Oracle’s $638 billion backlog illustrates how circular counterparty dependencies can accumulate at scale: a $300 billion contract with OpenAI anchors nearly half that figure, yet OpenAI’s current annual revenue would need to more than double to cover the implied compute obligation, concentrating contract durability risk on a single counterparty’s growth trajectory.
The case for ecosystem alignment, not just circular inflation
The counterargument deserves a fair hearing. Supporters view these arrangements as genuine long-term economic commitments rather than accounting tricks.
The logic runs like this. A capital-intensive technology transition needs committed demand to justify the build-out, and locking in multi-year chip and cloud consumption aligns incentives across the ecosystem in a way arm’s-length deals cannot. On this reading, the arrangements accelerate a real transition even if they create optics problems on the revenue line.
Both readings can be partly true at once. What you need to take from this is a habit of scrutiny: when you see AI-related revenue growth in an earnings release, ask how much of it is contracted between related parties, because that portion is a weaker signal of real demand than a clean external sale.
The depreciation bill is already written, but it has not arrived yet
Capital expenditure does not hit the income statement all at once. It is recorded as an asset and then depreciated over its useful life, which means today’s AI infrastructure spending creates future charges that will compress reported earnings regardless of how revenue performs.
The timing mismatch is the story. Hyperscalers are set to spend roughly $760 billion on AI infrastructure in 2026 while recognising only about $211 billion in depreciation, leaving approximately $549 billion of cost deferred to future income statements (the deferred figure flagged as unverified).
That deferral is not a risk to watch in the abstract. It is a calculable drag that has already been committed and will arrive whether AI revenues materialise or not.
| Metric | 2022 | 2025 | 2027 (projected) |
|---|---|---|---|
| D&A as % of hyperscaler revenues | ~7% | Rising | ~12% |
| Implied EPS drag from asset-life mismatch | Minimal | Building | 10-15% overstatement risk |
All figures above are flagged as unverified in the research. The trajectory, from depreciation and amortisation at about 7% of revenues in 2022 to roughly 12% by 2027, functions as a structural drag on profitability as these companies shift toward asset-heavy models.
Cumulatively, the research suggests Microsoft, Oracle, Meta and Alphabet could face over $680 billion in depreciation charges over the next four years (flagged as unverified). One company makes the dynamic concrete.
Oracle depreciation trajectory Oracle’s depreciation expense alone is projected to rise from about $4 billion in 2025 to $56 billion by 2029 (figures flagged as unverified in the research).
Why GPU accounting lives and economic lives do not match
Now the compounding problem. GPU clusters are being depreciated over an accounting useful life of about 6 years, but the pace of AI hardware obsolescence puts their real economic useful life closer to 3 years (both flagged as unverified).
Spreading the cost over twice the realistic productive window makes current earnings look better than they are. The research estimates this depreciation shield inflates current EPS by 10-15%, overstating pre-tax income by roughly $15 billion annually for every $100 billion in AI assets (both flagged as unverified).
That means the overstatement is not a future problem. It is embedded in the earnings figures you are reading today, which gives you a sharper tool for stress-testing forward projections than any bullish summary.
The mismatch between accounting useful lives and economic useful lives is not unique to the GPU clusters discussed here; AI infrastructure accounting across the hyperscaler cohort also parks tens of billions in construction-in-progress outside return calculations and shifts major commitments off the balance sheet entirely, compounding the overstatement risk embedded in headline earnings.
What China’s narrowing gap adds to the capex risk equation
This is not a geopolitical story. It is a commoditisation story, and commoditisation changes the return arithmetic for the entire US AI capex cycle.
The US retains genuine, substantial advantages. Set them out honestly before weighing the risk:
- US strengths: approximately 77% of global compute versus China’s roughly 12%; private AI investment of about $285.9 billion in 2025 against China’s $12.4 billion; a model performance lead; and best-in-class chips estimated at around five times more powerful than China’s best domestic alternatives.
- China’s strengths: patent output of 115,000 AI patents in 2025 versus 86,000 for the US; a larger talent base; a lower cost structure; open-source proliferation; and a fast-follower approach tightly integrated with its industrial economy.
Every figure above is flagged as unverified in the research. The vulnerability sits in one number: top US models lead top Chinese models by only about 2.7 percentage points on composite metrics (flagged as unverified).
From capability gap to pricing pressure, what the numbers imply for US revenue models
A 2.7 percentage point gap is narrow. Narrow enough that a procurement officer at a US enterprise could reasonably ask whether the premium for US AI services is worth paying when a cheaper open-source alternative delivers close-to-comparable output.
Open-weight model commoditisation is already moving faster than the 2.7 percentage point gap implies: Kimi K3 from Moonshot AI scores within half a percentage point of OpenAI’s flagship on a major benchmark and is scheduled for free public release, converting a pricing competitor into a zero-cost alternative for enterprises willing to self-host.
That question is what changes the revenue arithmetic. US token-based pricing models assume customers will pay for superior performance, and if that superiority narrows toward parity, the margin assumptions embedded in hyperscaler revenue forecasts get harder to defend.
Consider what is at stake in raw terms. OpenAI’s annualised revenue run rate reportedly reached $40 billion as of mid-August 2026 (flagged as unverified). Where you should sit with this is not a prediction of collapse, but recognition that the revenue growth needed to absorb the depreciation burden becomes materially harder to sustain if pricing power erodes.
What the structural picture actually tells investors right now
Three risks are not operating in isolation. Circular financing inflates reported revenue, deferred depreciation is converting from tailwind to headwind, and commoditisation is narrowing the revenue premium. Together they form a compound pressure on the earnings that a 22x forward multiple, against a 15x long-run average, depends on.
The bull case has a concrete anchor: JP Morgan’s S&P 500 target of 7,500 by end-2026 (flagged as unverified). It also has real evidence, most notably Amazon’s disclosure that a substantial portion of its 2026 AWS capital expenditure is already backed by customer commitments.
Amazon customer commitment disclosure Amazon noted that a substantial portion of its 2026 AWS capex is already backed by customer commitments, the strongest single piece of evidence that genuine contracted demand underlies part of the capex cycle.
So the question is not whether AI is transformative. It is whether current prices have already banked the transformation, leaving little room for the risks now accumulating. Watch these specific conditions:
- Hyperscaler revenue growth, net of related-party transactions, sustaining above 20% year-on-year.
- Depreciation charges being absorbed by revenue growth rather than compressing margins, especially as D&A climbs toward 12% of revenues by 2027.
- US model performance holding a pricing premium despite the 2.7 percentage point gap continuing to narrow.
At a 22x forward multiple with a depreciation surge and pricing pressure building at once, the margin for error is smaller than headline earnings suggest. Approach the next round of projections with those questions, not a binary optimism or pessimism.
Separating durable AI value from financial engineering in a 22x market
You now have a working frame. You know what circular financing looks like on a revenue line, what the depreciation schedule implies for future earnings, and how a narrowing capability gap threatens the pricing assumptions underneath it all.
What would shift the picture upward is clear: genuine enterprise adoption at scale, generating revenue independent of circular arrangements, and depreciation charges comfortably absorbed by that growth. What would shift it downward is equally clear: depreciation arriving faster than revenue expands, or a Chinese open-source model closing the performance gap below 1 percentage point.
The task from here is not to call the top or defend the rally. It is to ask sharper questions of the next earnings cycle, starting with how much of the reported growth is real, external and repeatable.
This article is for informational purposes only and should not be considered financial advice. Investors should conduct their own research and consult with financial professionals before making investment decisions. Past performance does not guarantee future results. Financial projections are subject to market conditions and various risk factors, and several figures cited above are unverified and speculative in nature.