
How to Invest in International Shares From Australia
5 hrs ago

The S&P 500 has delivered returns over the past decade that turned many portfolios, even those built with global ambitions, into effectively single-country positions. That dominance was earned. But the same outperformance that made US equities so compelling has also made them expensive and concentrated in ways that carry underappreciated risk heading into the second half of 2026. US indices now sit at elevated valuations relative to historical norms and relative to other developed markets, meaning the trade-off between concentration and diversification looks meaningfully different today than it did five or ten years ago. What follows is a clear explanation of what the case for European equities is built on, what it is not built on, and how to think about sizing any adjustment to geographic allocation in practical terms.
Concentration bias is straightforward: it is the risk that comes from holding too much of a portfolio in a single market, currency, or group of companies. It applies to any investor globally who has over-allocated to US equities, not only American investors with a home-country tilt.
The mechanism is worth understanding. Years of strong US equity returns attracted capital flows into US markets. Those flows pushed valuations higher. Higher valuations attracted more capital. The result is a self-reinforcing cycle where the concentration itself has grown alongside the valuation risk embedded in that concentration. Buying US equities today is a fundamentally different proposition, at a different price, than buying them a decade ago.
US index concentration has reached levels that give even passive investors a meaningful active bet: five mega-cap technology companies now control roughly a quarter of the broad market by weight, a share that amplifies both drawdowns and recoveries in ways that many index fund holders do not anticipate.
The compounding layers of this risk are worth itemising:
Investors who hold exclusively US assets are not taking a neutral position. They are making an implicit bet that the dollar and US equities will remain dominant indefinitely.
None of this is a case for selling US equities. It is a case for recognising what an undiversified position looks like and what it implies for forward risk. Owning many companies within a single country is sector diversification. It is not geographic diversification, and the distinction matters for long-term portfolio resilience.
The most common objection to European equities is an intuitive one: European GDP growth is slower than US GDP growth, so European stocks must be inferior investments. The objection sounds reasonable. It also misidentifies what an investor actually owns when buying European-listed equities.
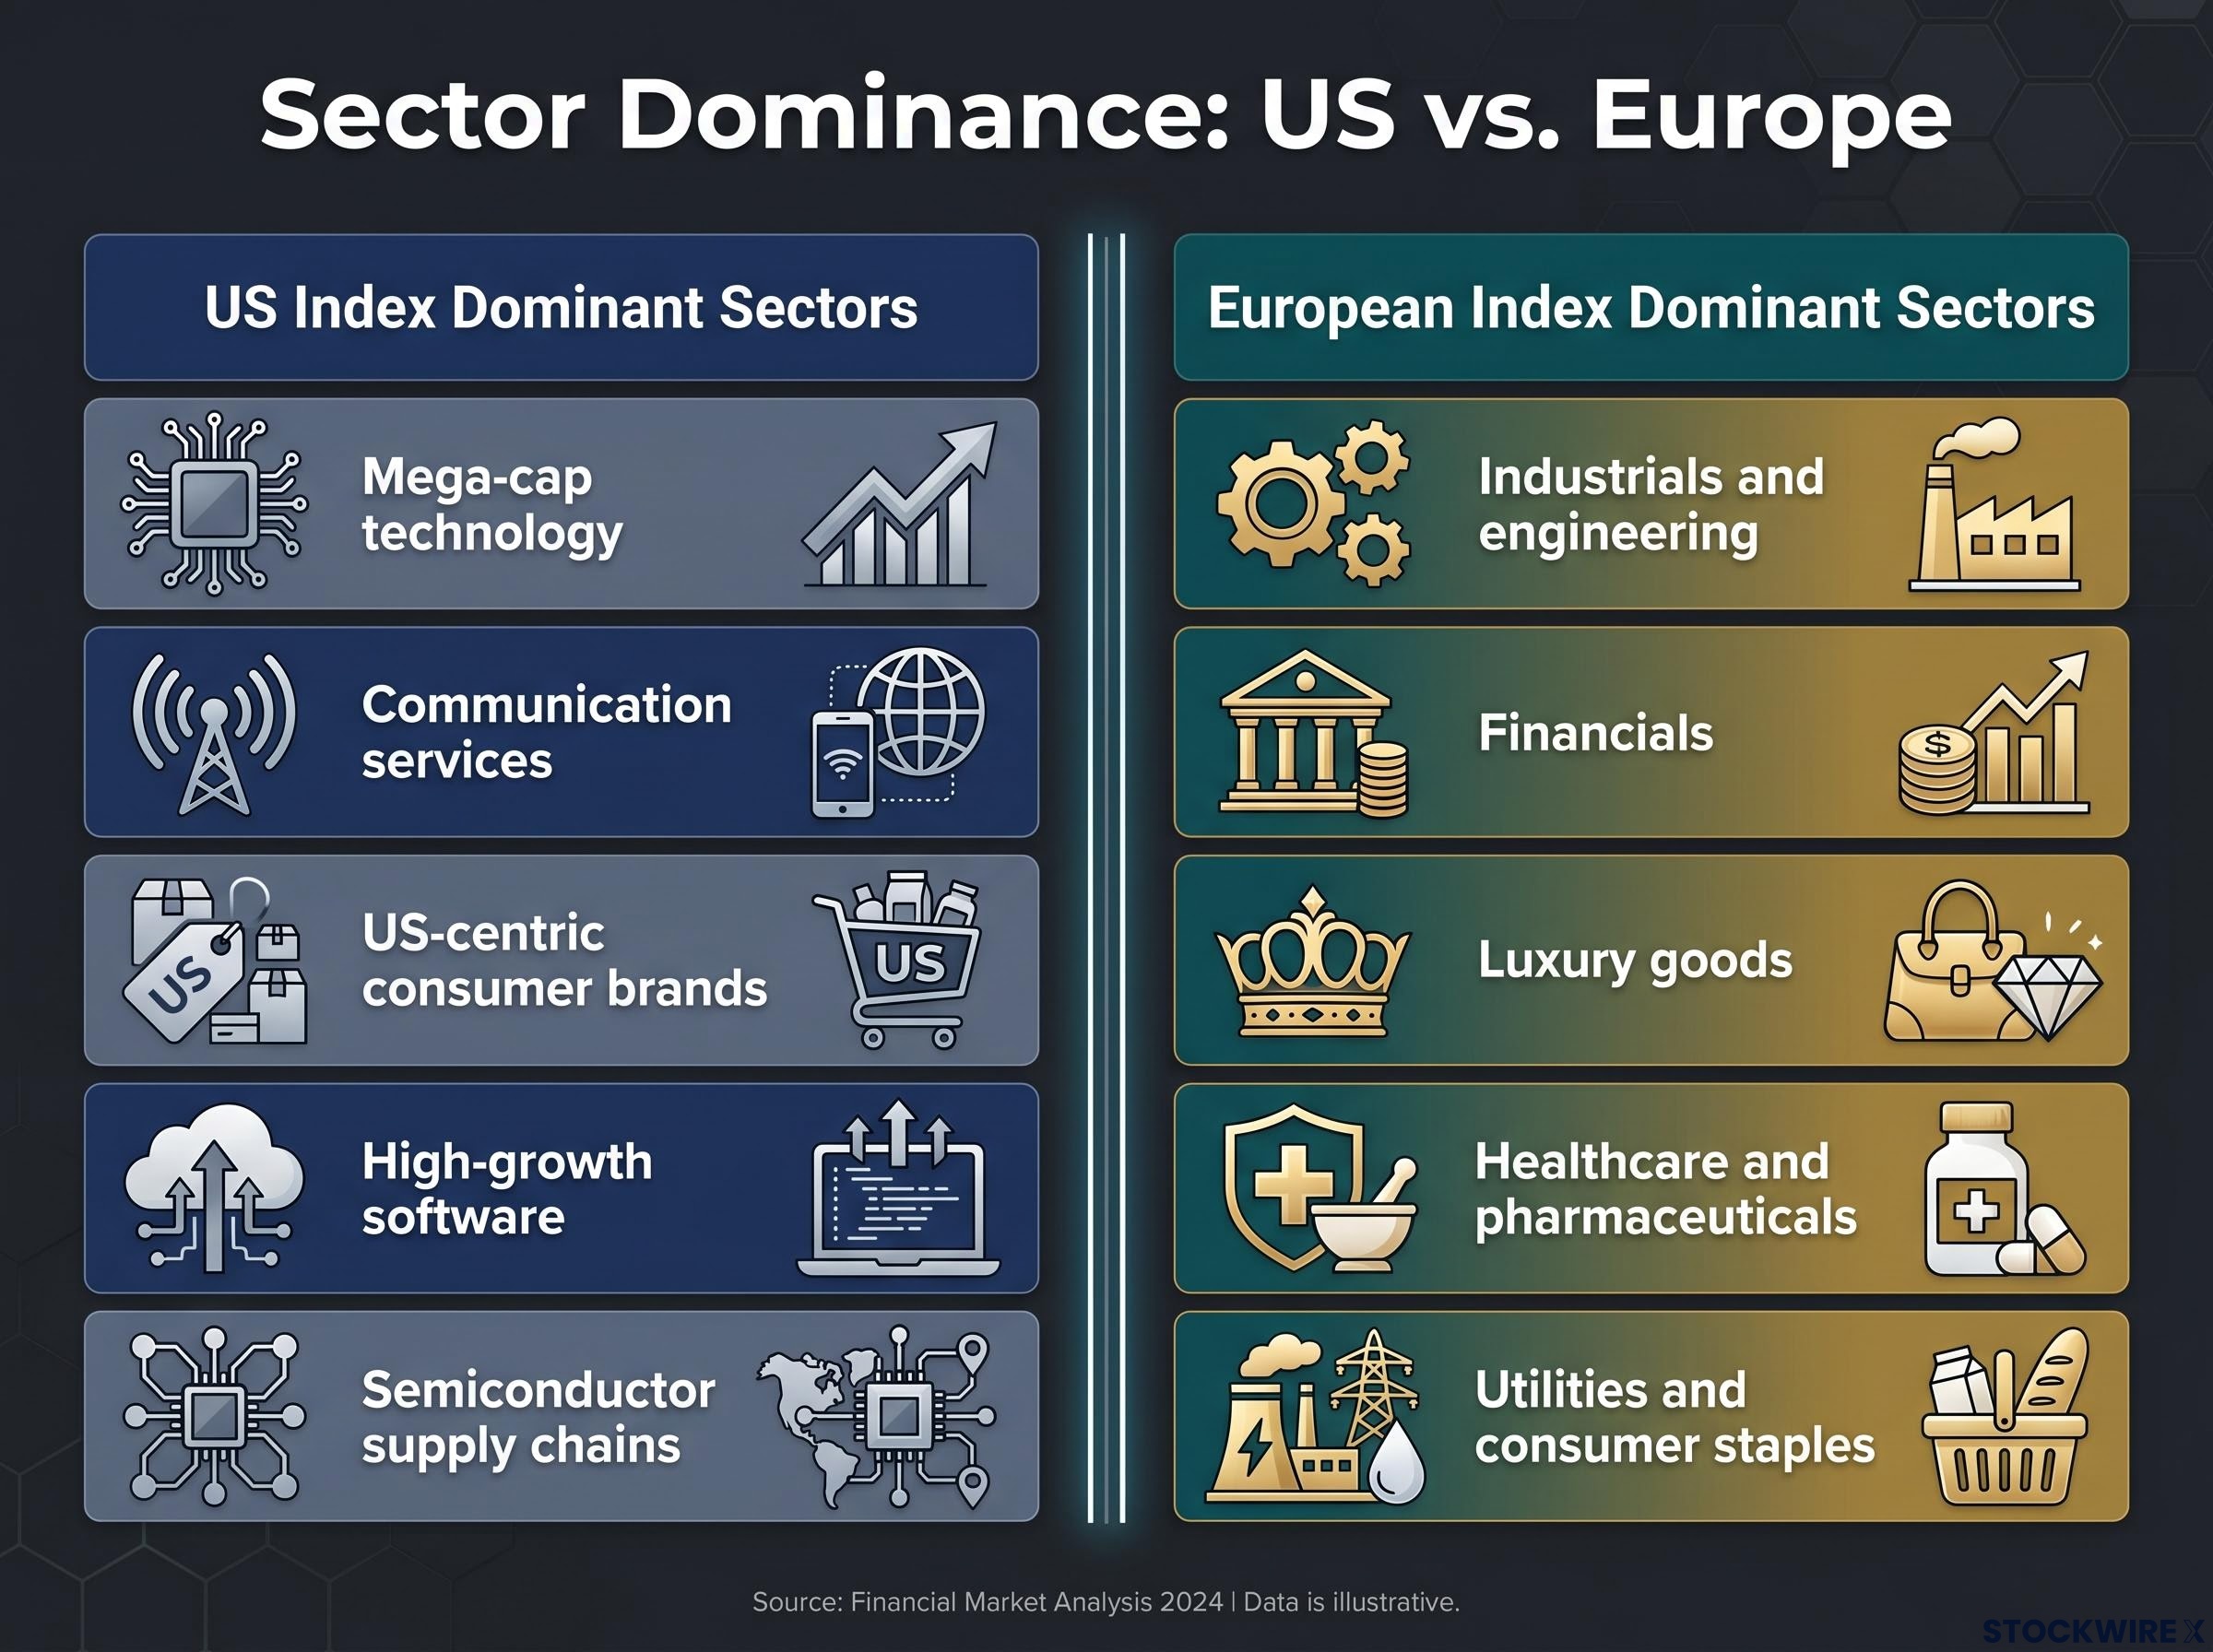
The structural sector composition of US and European indices is meaningfully different. US indices are dominated by high-growth technology and communication services companies. European indices carry larger weightings in industrials, financials, utilities, luxury goods, consumer staples, and healthcare.
| US index dominant sectors | European index dominant sectors |
|---|---|
| Mega-cap technology | Industrials and engineering |
| Communication services | Financials |
| US-centric consumer brands | Luxury goods |
| High-growth software | Healthcare and pharmaceuticals |
| Semiconductor supply chains | Utilities and consumer staples |
This compositional difference is the first reason the two regions are genuinely complementary rather than substitutes.
The second, and arguably more important, reason is revenue geography. Many of the largest European-listed companies generate the majority of their revenues outside Europe. Swiss pharmaceutical firms derive substantial income from the United States and Asia. French luxury conglomerates count Chinese and American consumers among their largest customer bases. German engineering companies sell industrial equipment worldwide.
Europe’s structural economic challenges are real: slower GDP growth, demographic headwinds, and regulatory complexity. These are legitimate concerns and help explain why European equities trade at a discount. But they are less determinative than they appear, because listed company earnings are driven by global revenues, not domestic GDP alone. Investors who dismiss European equities based on eurozone growth headlines may be misattributing the revenue drivers of the companies they are avoiding.
The European equity gap relative to US markets in early 2026 has not been purely a function of fundamentals; Barclays analysts have identified a potential diplomatic de-escalation as a single catalyst capable of triggering a sharp sector rotation in consumer, banking, and luxury names that have accumulated elevated short positioning through the preceding conflict period.
Valuations are not just backward-looking scores. They are a measurable input into what investors can reasonably expect going forward.
Two common valuation metrics help frame the comparison. The price-to-earnings ratio (P/E) measures how much investors are paying for each unit of a company’s annual earnings. The price-to-book ratio (P/B) measures how much they are paying relative to the company’s net asset value. Higher ratios mean investors are paying more; lower ratios mean they are paying less.
On both measures, European equities have traded at a notable discount to US equities. Morningstar analysis has noted that European equities traded near fair value or at a modest discount relative to US equities even after some gap narrowing in early 2026. The discount has persisted.
The European valuation floor has held at approximately 14.4x forward earnings despite an 82% year-over-year surge in Brent crude, a resilience Goldman Sachs analysts have described as the most surprising aspect of current market behaviour and one that complicates any straightforward narrative that commodity shocks will mechanically erode the discount case.
Morningstar analysis of European versus US valuations found the MSCI Europe Index trading at roughly a 31% discount to the S&P 500 on forward earnings multiples, with European equities near fair value even after the partial gap-narrowing seen in early 2026, lending quantitative weight to the argument that the discount has persisted rather than resolved.
“Investors are currently paying less for each euro of European corporate earnings than for each dollar of US earnings, a gap that has persisted even as European markets have rallied in early 2026.”
The connection between valuation starting points and future returns is well established in standard investment theory. Buying cheaper assets, all else being equal, implies more return potential embedded in the price. Buying expensive assets means more of the expected good news is already reflected in the price paid.
The logic follows a three-part sequence:
This does not guarantee European outperformance. It does mean the risk-adjusted case for European equities is grounded in observable data rather than speculation.
European companies have a well-documented culture of returning cash to shareholders through dividends, and the aggregate numbers are substantial. The dividend argument is strongest when framed not as an income-only feature but as a return component: dividends compound over time and contribute materially to total returns, particularly when reinvested.
“Companies in the STOXX Europe 600 are projected to distribute approximately €454 billion in dividends in 2026, a roughly 4% increase from approximately €437 billion the prior year.”
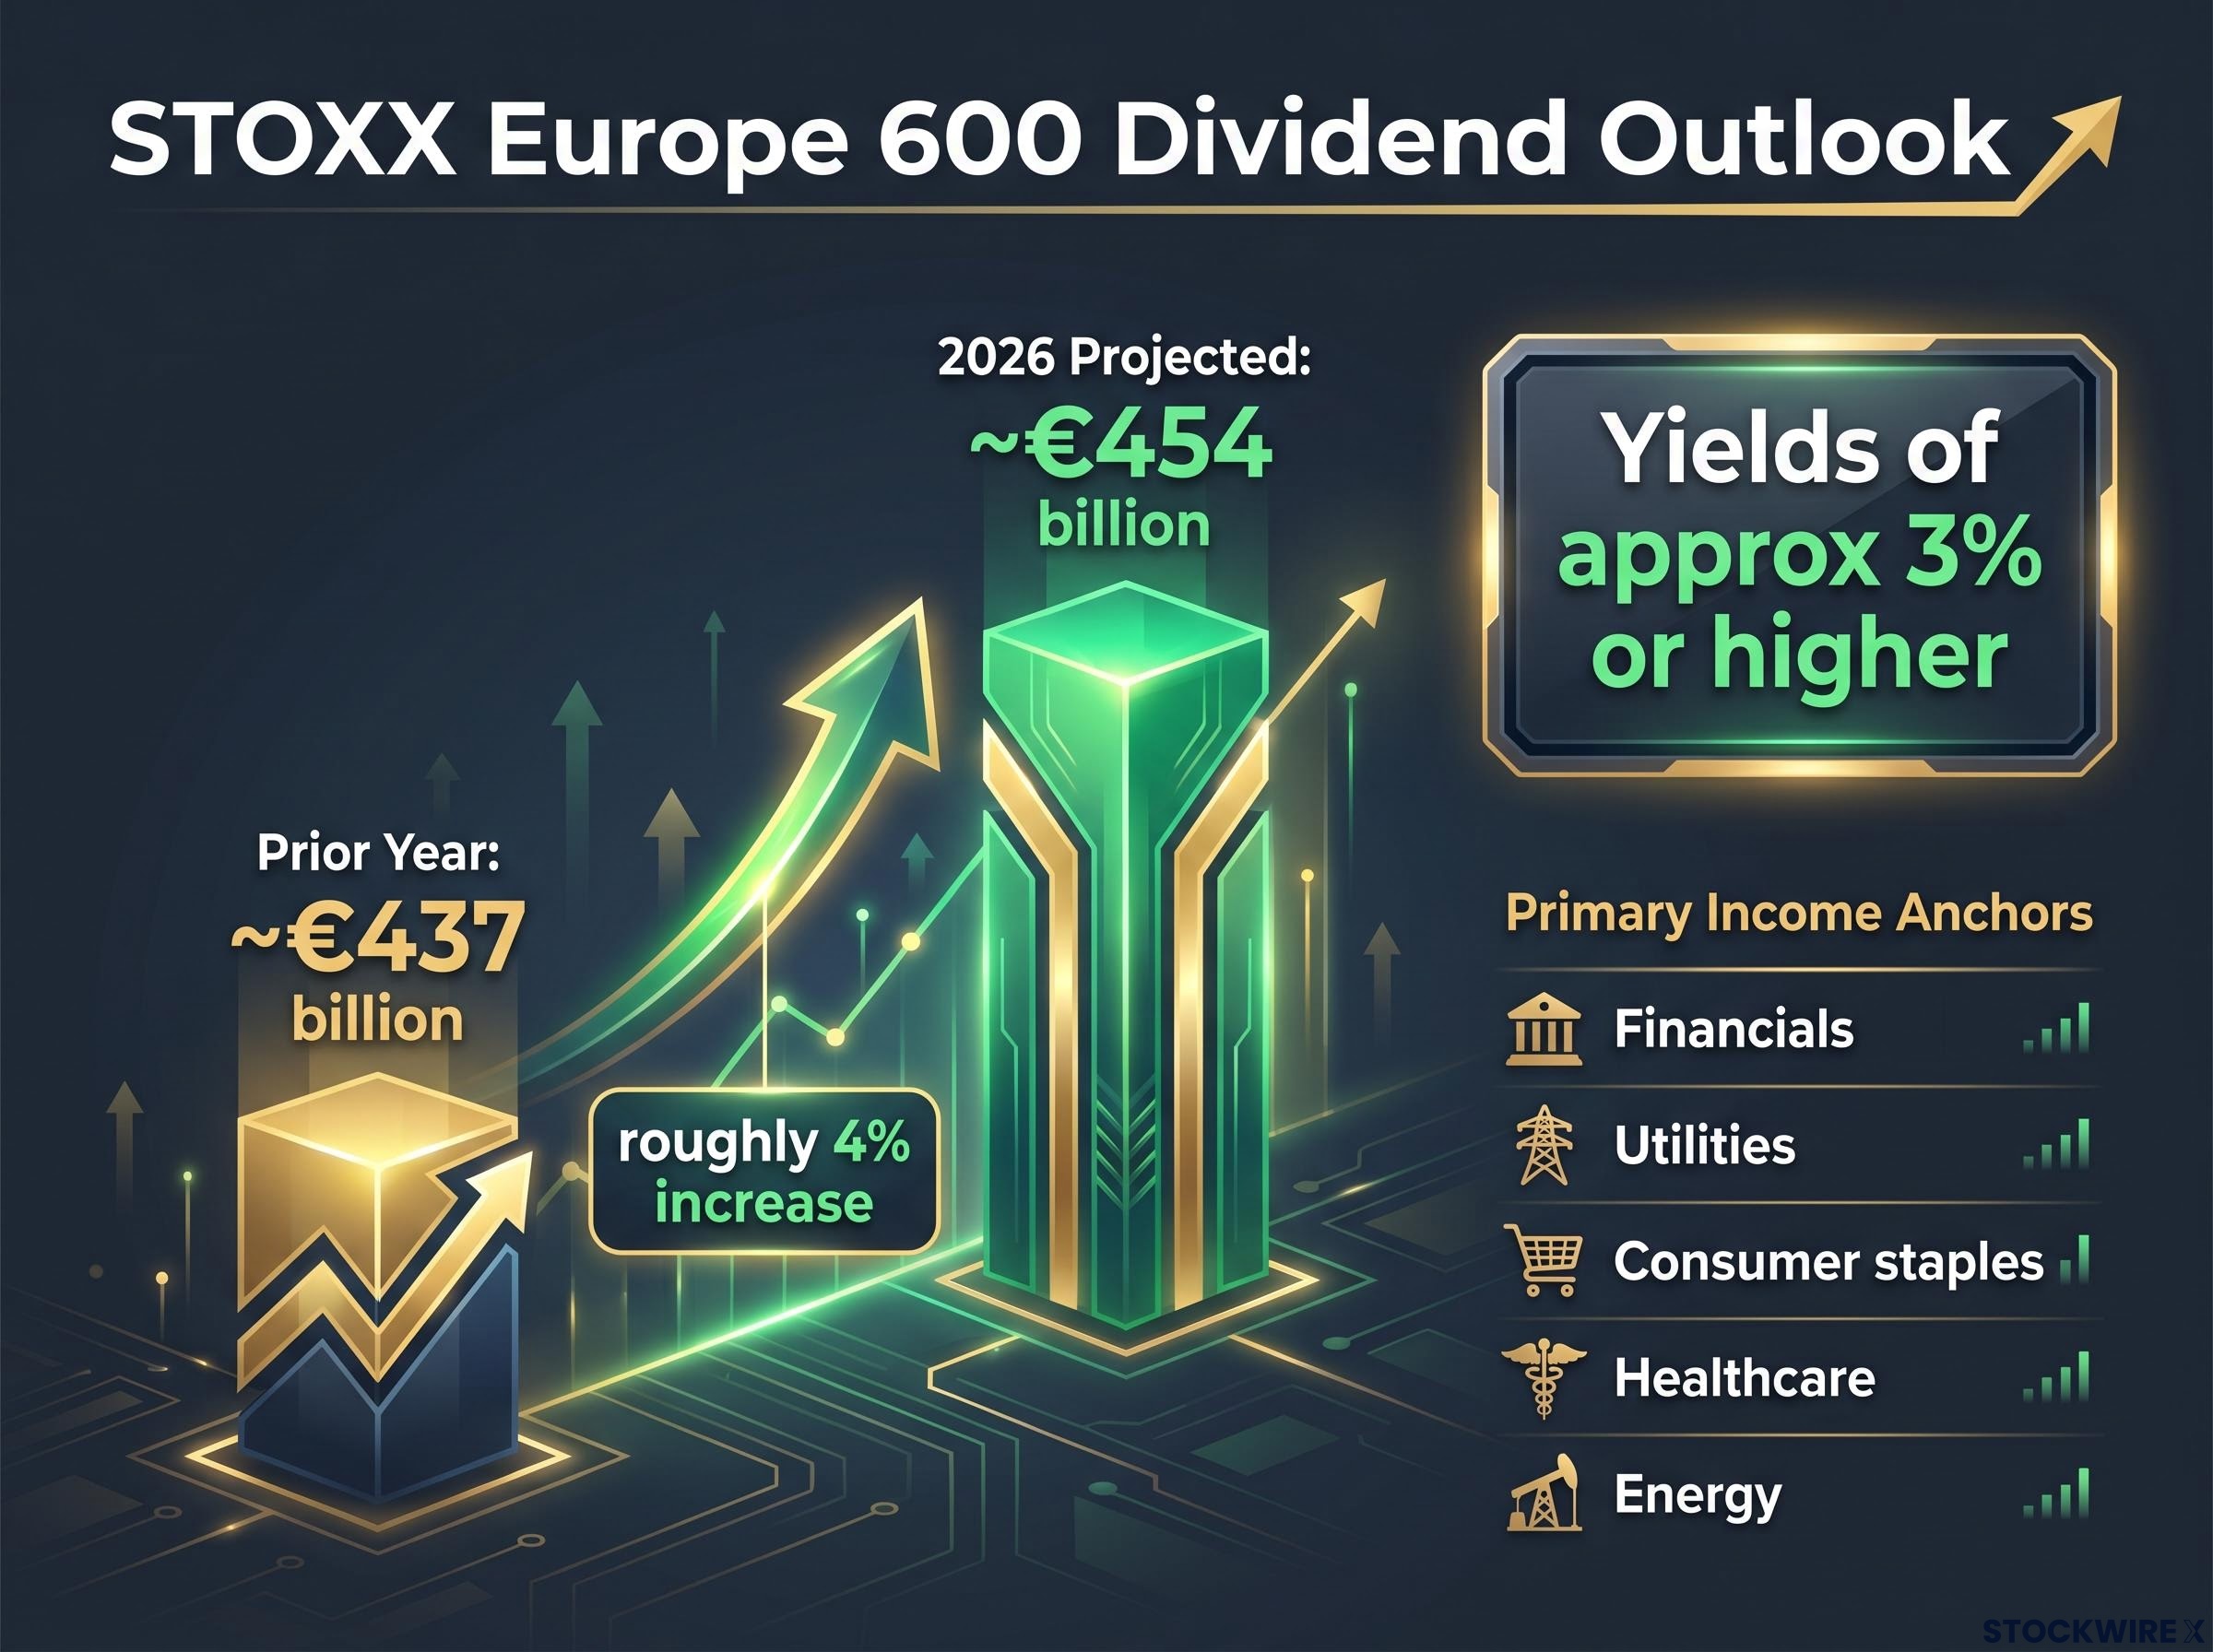
That projected payout reflects a structural commitment across the market, not a one-off cycle. Stalwart European names commonly offer dividend yields of approximately 3% or higher, with concentration in several sectors that serve as the primary income anchors:
The Allianz Global Investors dividend outlook published in January 2026 projects STOXX Europe 600 payouts reaching approximately 454 billion euros for the year, with financials contributing the largest expected increase and consumer discretionary the only segment forecast to decline, a breakdown that reinforces why sector selection matters within the broader European income thesis.
These yields sit meaningfully above the average offered by US large-cap indices, adding a return stream that operates independently of the valuation case.
Concentrating assets in a single market also means concentrating in a single currency. Investors holding only US dollar-denominated assets are not avoiding currency risk. They are concentrating it in the dollar’s trajectory, which is subject to Federal Reserve policy decisions, US inflation dynamics, and geopolitical developments that affect the dollar specifically.
Holding European equities spreads exposure across euros, Swiss francs, and other non-USD currencies. These currencies do not move in perfect correlation with one another or with the dollar. The result is that geographic diversification across multiple currency zones can reduce total portfolio volatility rather than increase it, distributing risk across economies with distinct monetary policy cycles and inflationary environments.
The analytical case is only useful if it connects to a practical decision. Three steps offer a straightforward framework for auditing current positioning:
A general framework consistent with geographic diversification principles suggests allocating 15-30% of the equity component to non-domestic markets including Europe. This is a general range, not a prescription; the appropriate allocation depends on individual circumstances, goals, and existing exposures.
Two practical implementation routes are available:
The case outlined here circles back to where it began. Investors with US-heavy portfolios are not holding a diversified position simply because they own many companies. They are holding a concentrated bet on one country, one currency, and a narrow set of sectors at elevated valuations. Recognising that implicit choice is the starting point, not the conclusion.
The European case rests on five distinct and complementary pillars: a persistent valuation discount, a structural dividend income stream, sector composition that fills gaps left by US indices, currency distribution that reduces single-economy vulnerability, and access to globally significant multinationals whose revenues extend well beyond European borders. None of these arguments require abandoning conviction in US markets, which retain structural advantages in innovation and growth. They require acknowledging that concentration and diversification are not the same thing.
Market leadership rotation away from US technology carries a valuation arithmetic that extends the current argument: MSCI EAFE is trading at roughly a 50-55% forward P/E discount to the S&P 500 information technology sector, a spread near multi-decade extremes that BlackRock Investment Institute research links to subsequent annualised underperformance by the dominant cohort across prior concentration episodes including the Nifty Fifty, Japan Inc., and the TMT bubble.
Geographic diversification works best as an ongoing portfolio discipline rather than a one-time trade. Comparing current allocation against a global benchmark such as the MSCI World or MSCI ACWI remains the most accessible first step for investors evaluating whether their positioning reflects their intentions.
This article is for informational purposes only and should not be considered financial advice. Investors should conduct their own research and consult with financial professionals before making investment decisions. Past performance does not guarantee future results, and valuations are subject to market conditions and various risk factors.
European equity diversification means allocating a portion of an investment portfolio to European-listed stocks, spreading risk across different countries, currencies, and sectors. It matters because US-only portfolios carry concentrated exposure to a single economy, currency, and a narrow set of sectors at elevated valuations.
A general framework consistent with geographic diversification principles suggests allocating 15-30% of the equity component to non-domestic markets including Europe, though the appropriate level depends on individual circumstances, goals, and existing exposures.
Morningstar analysis found the MSCI Europe Index trading at roughly a 31% discount to the S&P 500 on forward earnings multiples, with the European valuation floor holding at approximately 14.4x forward earnings even after partial gap-narrowing in early 2026.
Companies in the STOXX Europe 600 are projected to distribute approximately 454 billion euros in dividends in 2026, a roughly 4% increase from approximately 437 billion euros the prior year, with financials contributing the largest expected increase.
Investors can use broad index ETFs or index funds tracking the STOXX Europe 600 or MSCI Europe for diversified geographic exposure, or pursue dividend-focused and quality-value strategies targeting high-quality European payers in financials, utilities, and healthcare.