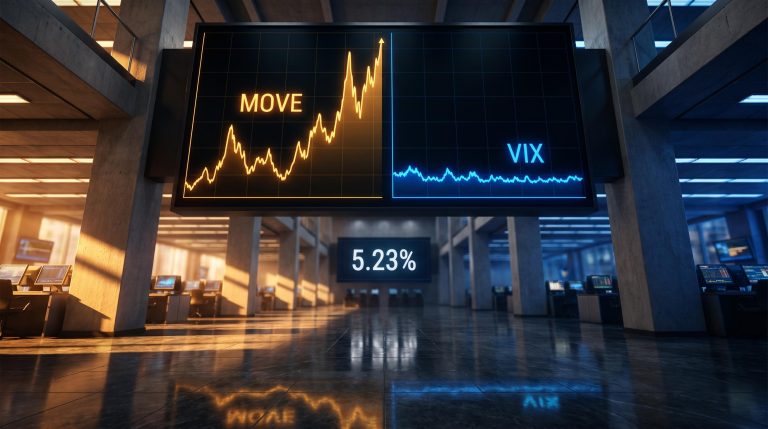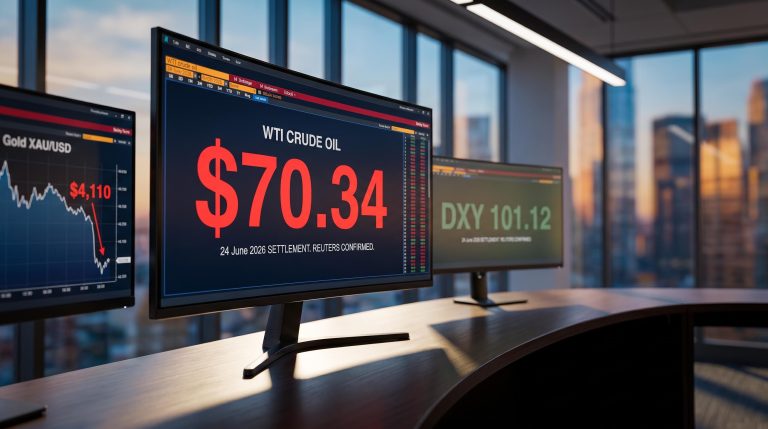
The 10-year Treasury yield has pushed past 5.20%, its highest in over two decades, while consumer confidence sinks and the S&P 500 hovers near 7,700. It sets up a question that sounds simple but is genuinely hard to answer: is this the start of something much worse, or a correction that just feels like a crash? RBC Capital Markets has spent months studying every S&P 500 decline of roughly 11% or greater since 1956 to answer it with precision rather than instinct.
The surface conditions are unsettling. The Iran conflict is rattling oil markets, Fed Chair Kevin Warsh is signalling persistent inflation risk, and yields sit at a level that has coincided with turbulence before. Yet Lori Calvasina, RBC’s Head of U.S. Equity Strategy, argues the two signals that matter most, corporate earnings growth and analyst revisions, are still pointing the other way.
This piece lays out the framework RBC uses to separate a crash setup from a correction, shows what it says about conditions right now, and identifies the specific indicators that would have to break for that read to flip. Treat it as a diagnostic tool, not a forecast.
What history actually looks like before a major S&P 500 crash
Before you can judge whether today is dangerous, you need to know what dangerous has actually looked like. RBC’s review covers every S&P 500 retreat of approximately 11% or greater since 1956, which gives the framework real historical weight rather than the anecdotal feel of a single cycle.
The recurring triggers are familiar: approaching recessions, elevated interest rates, stretched valuations, geopolitical disruptions, volatile energy prices, and major armed conflicts. Those are the headlines. They are not, on their own, what distinguishes a crash from a scare.
The precision comes from what the worst episodes shared internally. According to RBC’s analysis, the most severe declines featured a consistent cluster of fundamental signals, not just alarming macro conditions.
NBER research on stock market crashes and depressions, drawing on cross-country historical data extending well before 1956, identifies consistent macro preconditions, including sharp output contractions and credit breakdowns, that align closely with the internal cluster RBC uses to define a genuine crash setup.
Those shared characteristics form a diagnostic checklist:
- Deteriorating corporate profit growth
- Downward analyst earnings revisions
- Valuation compression
- Sharply declining investor sentiment
- Rising unemployment
- Weakening economic output
- Declining manufacturing activity
Read that list carefully and one thing stands out. Crashes are not primarily caused by frightening headlines; they are caused by a specific combination of falling earnings and rising discount rates. That distinction is what lets you read current conditions accurately instead of treating every sharp drop as a potential collapse.
The cause of the decline, not just its depth, is the most important variable for setting recovery expectations; bear market recovery time has ranged from under six months to roughly 25 years across U.S. history, with valuation-driven busts requiring years of earnings growth to absorb excess while policy-addressable financial shocks have resolved far faster.
Three historical episodes that defined the pattern
The clearest cases are the ones where the full cluster showed up at once. The 1973-74 stagflation bear market combined energy-driven margin compression with aggressive monetary tightening, a situation where profits and policy moved against equities simultaneously.
The early-2000s dot-com bust ran on a different engine but the same mechanics: technology earnings collapsed, and valuations that had assumed permanent growth reset violently.
The 2008 global financial crisis completed the pattern through the financial sector, where profitability broke down and credit deteriorated in a self-reinforcing spiral.
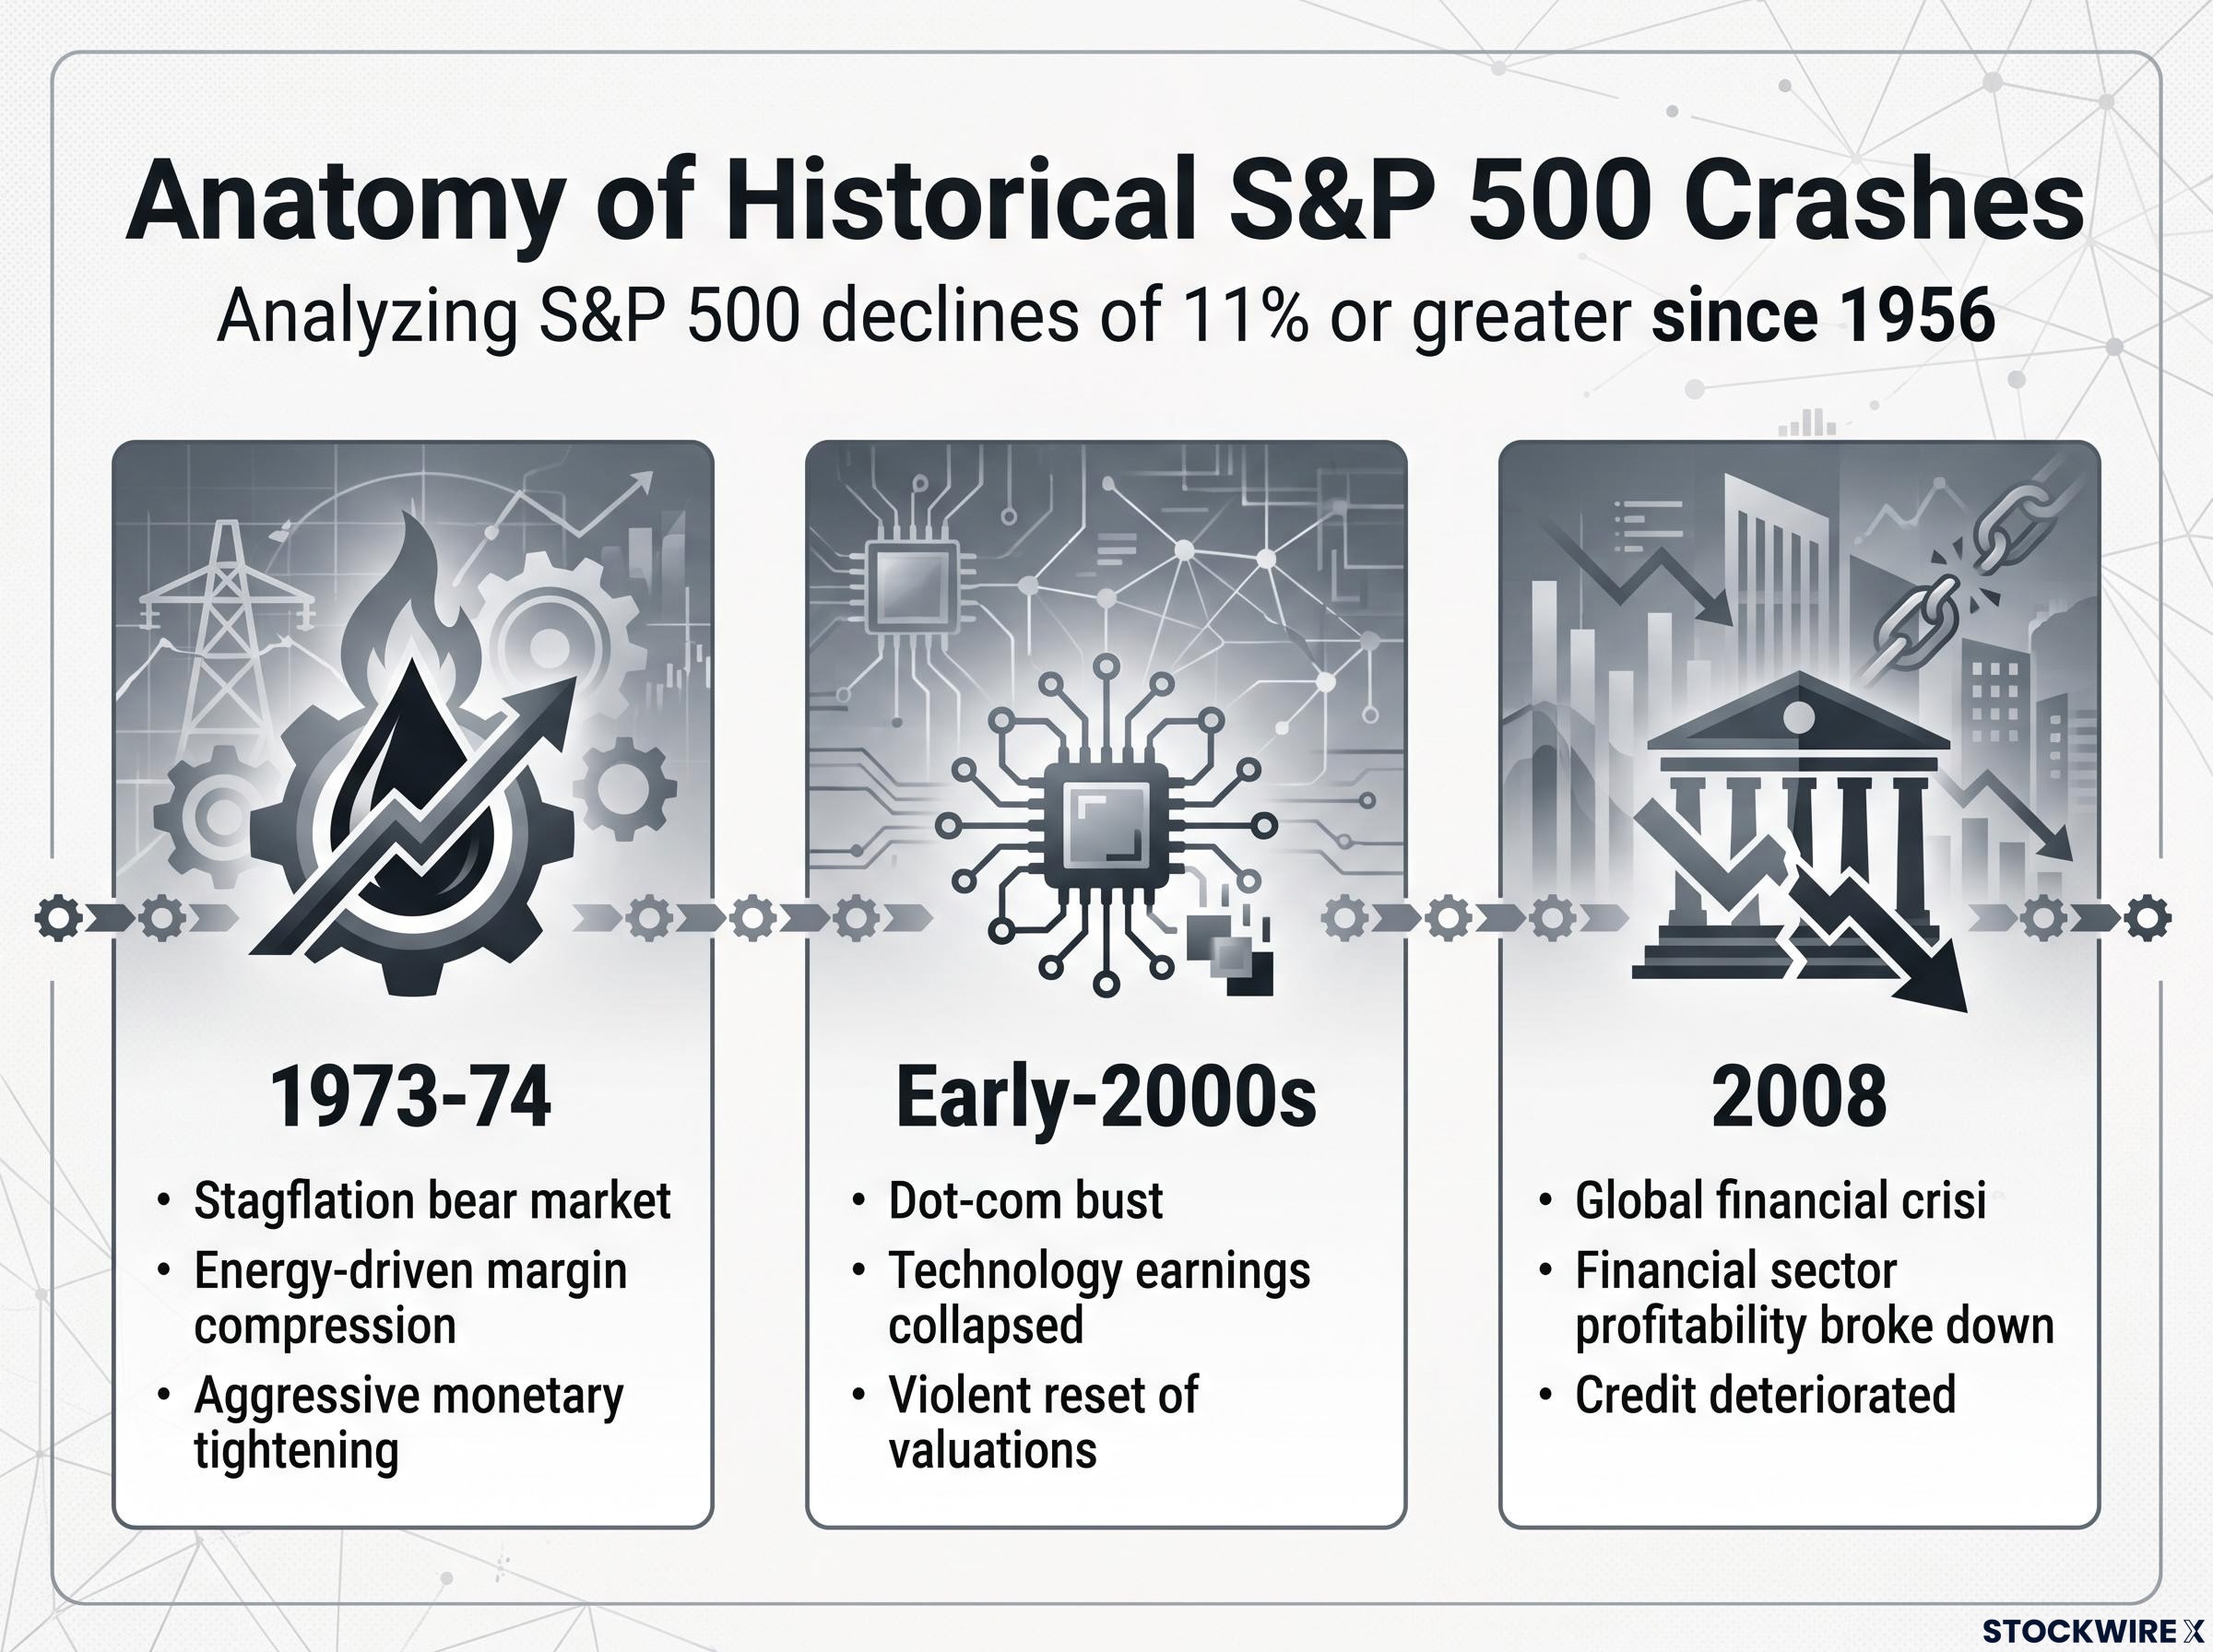
In each case, the equity-internal signals, deteriorating earnings and downward revisions, preceded or coincided with the macro breakdown rather than following it. The fundamentals turned first. That sequencing is the point, and it is the baseline against which everything that follows should be measured.
When big ASX news breaks, our subscribers know first
Where today’s conditions diverge from every prior crash setup
Hold current conditions up against that checklist and the two most important lights are not flashing. RBC’s assessment is that corporate profitability is trending upward, the direct opposite of the earnings deterioration that preceded past severe declines.
The second differentiator is analyst behaviour. As of September 2026, earnings estimate revisions remain positive, whereas historical stress periods were marked by clusters of downward revisions as companies cut guidance and issued profit warnings.
Manufacturing tells a similar story. RBC describes industrial output as being in early-stage recovery rather than contraction, another break from the prior pattern where activity was rolling over as markets peaked.
None of this means the environment is benign, and the analysis is stronger for admitting it. Several warning signs do mirror historical stress. Consumer confidence has already declined substantially, investor sentiment has retreated well below prior peaks, and the 10-year Treasury yield sits in a 5.18-5.24% range as of late September 2026, a level that has historically coincided with market turbulence. The S&P 500 near 7,700-7,743 is being asked to hold those valuations against a rising discount rate.
The table below sets the historical crash pattern against current readings.
| Indicator | Historical crash pattern | Current status | RBC assessment |
|---|---|---|---|
| Earnings growth | Deteriorating profitability | Trending upward | Diverges from crash setup |
| Analyst revisions | Broad downward revisions | Positive as of Sept 2026 | Diverges from crash setup |
| Manufacturing activity | Contraction | Early-stage recovery | Diverges from crash setup |
| Consumer confidence | Sharp decline | Already declined substantially | Mirrors historical stress |
| 10-year Treasury yield | Elevated, tightening conditions | 5.18-5.24% | Mirrors historical stress |
The single most important line in that table is the first one, read alongside the last. Earnings are growing while yields are rising.
The four forces driving yields to current levels, including a hotter core CPI print, structural fiscal deficit anxiety, AI infrastructure spending uncertainty, and curve-wide selling across maturities, help explain why the 10-year has been so resistant to the Treasury’s buyback interventions throughout September 2026.
That combination matters because of how equity valuations are built. When the numerator (expected earnings) is expanding at the same time the denominator (the discount rate implied by yields) is climbing, the two forces tend to offset rather than compound. Historically, that produces corrections. Crashes come when both move against you at once: earnings fall while discount rates rise, driving the non-linear repricing that defines a genuine collapse.
RBC frames the market’s current posture bluntly.
The equity market is presuming stability unless evidence of deterioration emerges.
That is the read to carry forward. The dangerous configuration requires earnings to roll over. Right now, they are not.
What the five-factor model and stress-test scenarios actually say
Historical comparison tells you the shape of the risk. To size it, RBC runs a five-model framework that generates the firm’s targets rather than resting on a single view.
Each model captures a different lever:
- Investor sentiment: how positioned and how optimistic the market already is
- Valuation and EPS: what earnings support at current multiples
- Earnings-yield gap: the relative appeal of equities against bond yields
- GDP: the macro-growth backdrop feeding corporate revenue
- Fed policy: the direction and stance of monetary policy
The output of that engine is a 12-month S&P 500 target of 8,150, raised on 29 June 2026 and representing roughly 10.8% upside from late-June levels. Around that baseline, RBC still expects a pullback in the 5%-10% range from prevailing levels, so the target is better read as the centre of a range than a fixed point. The earnings anchor beneath it is RBC’s full-year 2026 EPS estimate of $297.
For context on how far the framework has travelled, the firm’s early-2026 model-derived range sat at 6,400-7,600. The upward migration of that range through the year is itself evidence that the earnings and valuation inputs have not deteriorated into a pre-crash profile.
The stress-test scenario and what it would take to reach it
The more useful number for risk assessment is the downside case. RBC’s stress test asks what happens under a genuinely adverse but not catastrophic set of assumptions.
Those assumptions are specific: 3% inflation, four additional Federal Reserve rate hikes, and a 10-year yield of 5.25%, all holding simultaneously. The output is an S&P 500 fair value of just above 7,900.
The baseline and stress cases sit side by side below.
| Assumption | Baseline scenario | Stress-test scenario |
|---|---|---|
| Inflation | Contained | 3% |
| Fed rate action | No further tightening assumed | Four additional hikes |
| 10-year yield | Around current levels | 5.25% |
| Implied S&P 500 fair value | 8,150 (12-month target) | Just above 7,900 |
Here is what that stress output tells you. Even under RBC’s adverse scenario, fair value just above 7,900 is only modestly below current levels of 7,700-7,743, and above them at the point of measurement. The downside is contained, not open-ended. That is a fundamentally different read than the bottomless tail risk that defines a real pre-crash setup.
One caveat sharpens the picture. As of late September 2026, the 10-year is already near the 5.25% stress-test assumption, meaning the yield leg of the scenario is close to satisfied. That leaves inflation running to 3% and four further Fed hikes as the variables that would actually have to materialise, and the two you should watch most closely.
The risks that could change this read, and what to watch for
None of this makes the no-crash view a certainty. It is a conditional diagnosis, and the conditions deserve as much attention as the conclusion.
The thesis rests on four things holding:
- Positive corporate earnings growth
- Stable or improving analyst revisions
- Orderly credit conditions
- Contained energy-price pass-through into inflation
The primary policy risk is a higher-for-longer Fed. Chair Kevin Warsh emphasised persistent inflation risks and the need for restrictive policy in CNBC coverage on 16 September 2026. If that stance keeps yields elevated well into 2027, the combination of 5-6% long rates and tight policy could eventually choke off the growth that currently keeps earnings intact.
Energy is the second channel, and it carries the clearest historical echo. RBC’s September 2026 analysis notes the 10-year yield has been tracking oil prices since the Iran conflict began, and Reuters framed the bond sell-off on 24 September 2026 around high energy costs, resilient growth, and increased government spending keeping inflation elevated. The 1973-74 parallel is the warning: an oil shock that combines with tightening policy is precisely the mix that turned a downturn into a bear market.
Energy price pass-through into equity returns has a documented historical pattern: the S&P 500 has declined an average of 11% in the six months following each prior instance of $4 gasoline since 1993, a statistic that sharpens the significance of RBC’s oil-price monitoring given the Iran conflict driving current energy costs.
The third risk runs through households. Higher mortgage rates, auto-loan rates, and credit-card APRs mechanically follow Treasury yields. With consumer confidence already down substantially, sustained rate pressure could weaken consumption and eventually undermine the earnings resilience that separates this environment from past crash setups.
There is a more constructive way to read the same data, and markets appear to be leaning toward it.
The latest breach of 5% has investors asking whether 6% is now the true pain point for 10-year yields.
That Reuters framing from 23 September 2026 captures the current dynamic: markets are adapting to higher rates rather than breaking under them. It is reassuring only up to a point. Adaptation buys time; it does not remove the risk if earnings or credit start to turn.
The takeaway is not comfort. The no-crash read holds as long as earnings stay positive and credit stays orderly. The two signals that would falsify it are analyst revisions turning broadly negative and credit conditions tightening materially.
What the evidence says now, and what would have to change
The weight of evidence points one way. Current conditions diverge from historical crash setups on the two dimensions that matter most, positive earnings growth and positive analyst revisions, even as surface-level indicators like the 5%-plus 10-year yield and falling consumer confidence look alarming.
The quantitative bookends frame the range from today’s 7,700-7,743. RBC’s baseline target of 8,150 describes the upside case; the stress-test fair value just above 7,900 describes the adverse but contained downside. Neither implies the open-ended collapse of a genuine crash.
That leaves three variables worth tracking over the next 60-90 days:
- Analyst revision direction: if broad-based downward revisions emerge, the single strongest differentiator from crash conditions weakens
- The 10-year yield trajectory relative to the 5.25% stress-test assumption: sustained moves above it push conditions toward the adverse scenario
- Oil prices and Iran conflict escalation: the most likely amplifier that could force inflation and yields higher together
The appropriate response is neither comfort nor alarm. If revisions stay positive and the 10-year holds below the 5.25% stress-test threshold, the correction thesis holds. If either breaks, the stress-test scenario becomes the frame to work from.
For investors wanting to translate the 10-year yield trajectory into specific portfolio implications, our dedicated guide to rate-sensitive assets at 5% yields covers what simultaneous declines in TLT, IEF, LQD, and XLU mean for positioning when no rate-sensitive hiding place exists.
This article is for informational purposes only and should not be considered financial advice. Investors should conduct their own research and consult with financial professionals before making investment decisions. Past performance does not guarantee future results, and these scenarios are speculative and subject to change based on market developments.