On 22 June 2026, the US Treasury issued a 60-day sanctions waiver allowing Iran to sell oil freely, and within hours three major markets moved in directions that, at first glance, looked like they were reading different stories. Oil fell sharply, as expected. Gold fell sharply too, which was not expected. And the dollar barely budged, despite both of those moves happening at once.
Diplomacy events rarely produce clean, uniform market reactions. The US-Iran sanctions-relief dynamic is a useful case study precisely because it exposes market mechanisms that operate independently of one another: oil responds to supply arithmetic, gold responds to a risk-premium calculation that is not the same as the dollar calculation, and the dollar answers to its own logic around safe-haven demand and rate expectations.
What follows is a breakdown of how sanctions-relief diplomacy actually travels through markets, asset by asset. By the end, you will understand not just what moved on that Monday session and why, but the specific mechanical logic behind each asset’s reaction, and what historical precedent suggests about how long those moves are likely to hold.
What the US actually offered Iran, and why markets took it seriously
Markets ignore diplomatic noise most of the time, and for good reason. A statement of intent from an official is not a policy, and traders have learned to wait for something legally operative before repricing risk. The 22 June 2026 waiver cleared that bar.
The Treasury issued what Deutsche Welle described as a “general license” authorising the production, delivery, and sale of Iranian oil, running until roughly 21 August 2026. This was not a promise to ease sanctions. It was a live instrument permitting Iran to sell crude and receive payment for a 60-day window.
The waiver did not arrive out of nowhere. It was the culmination of a negotiating arc that markets had been tracking for months, each step raising the credibility of the next.
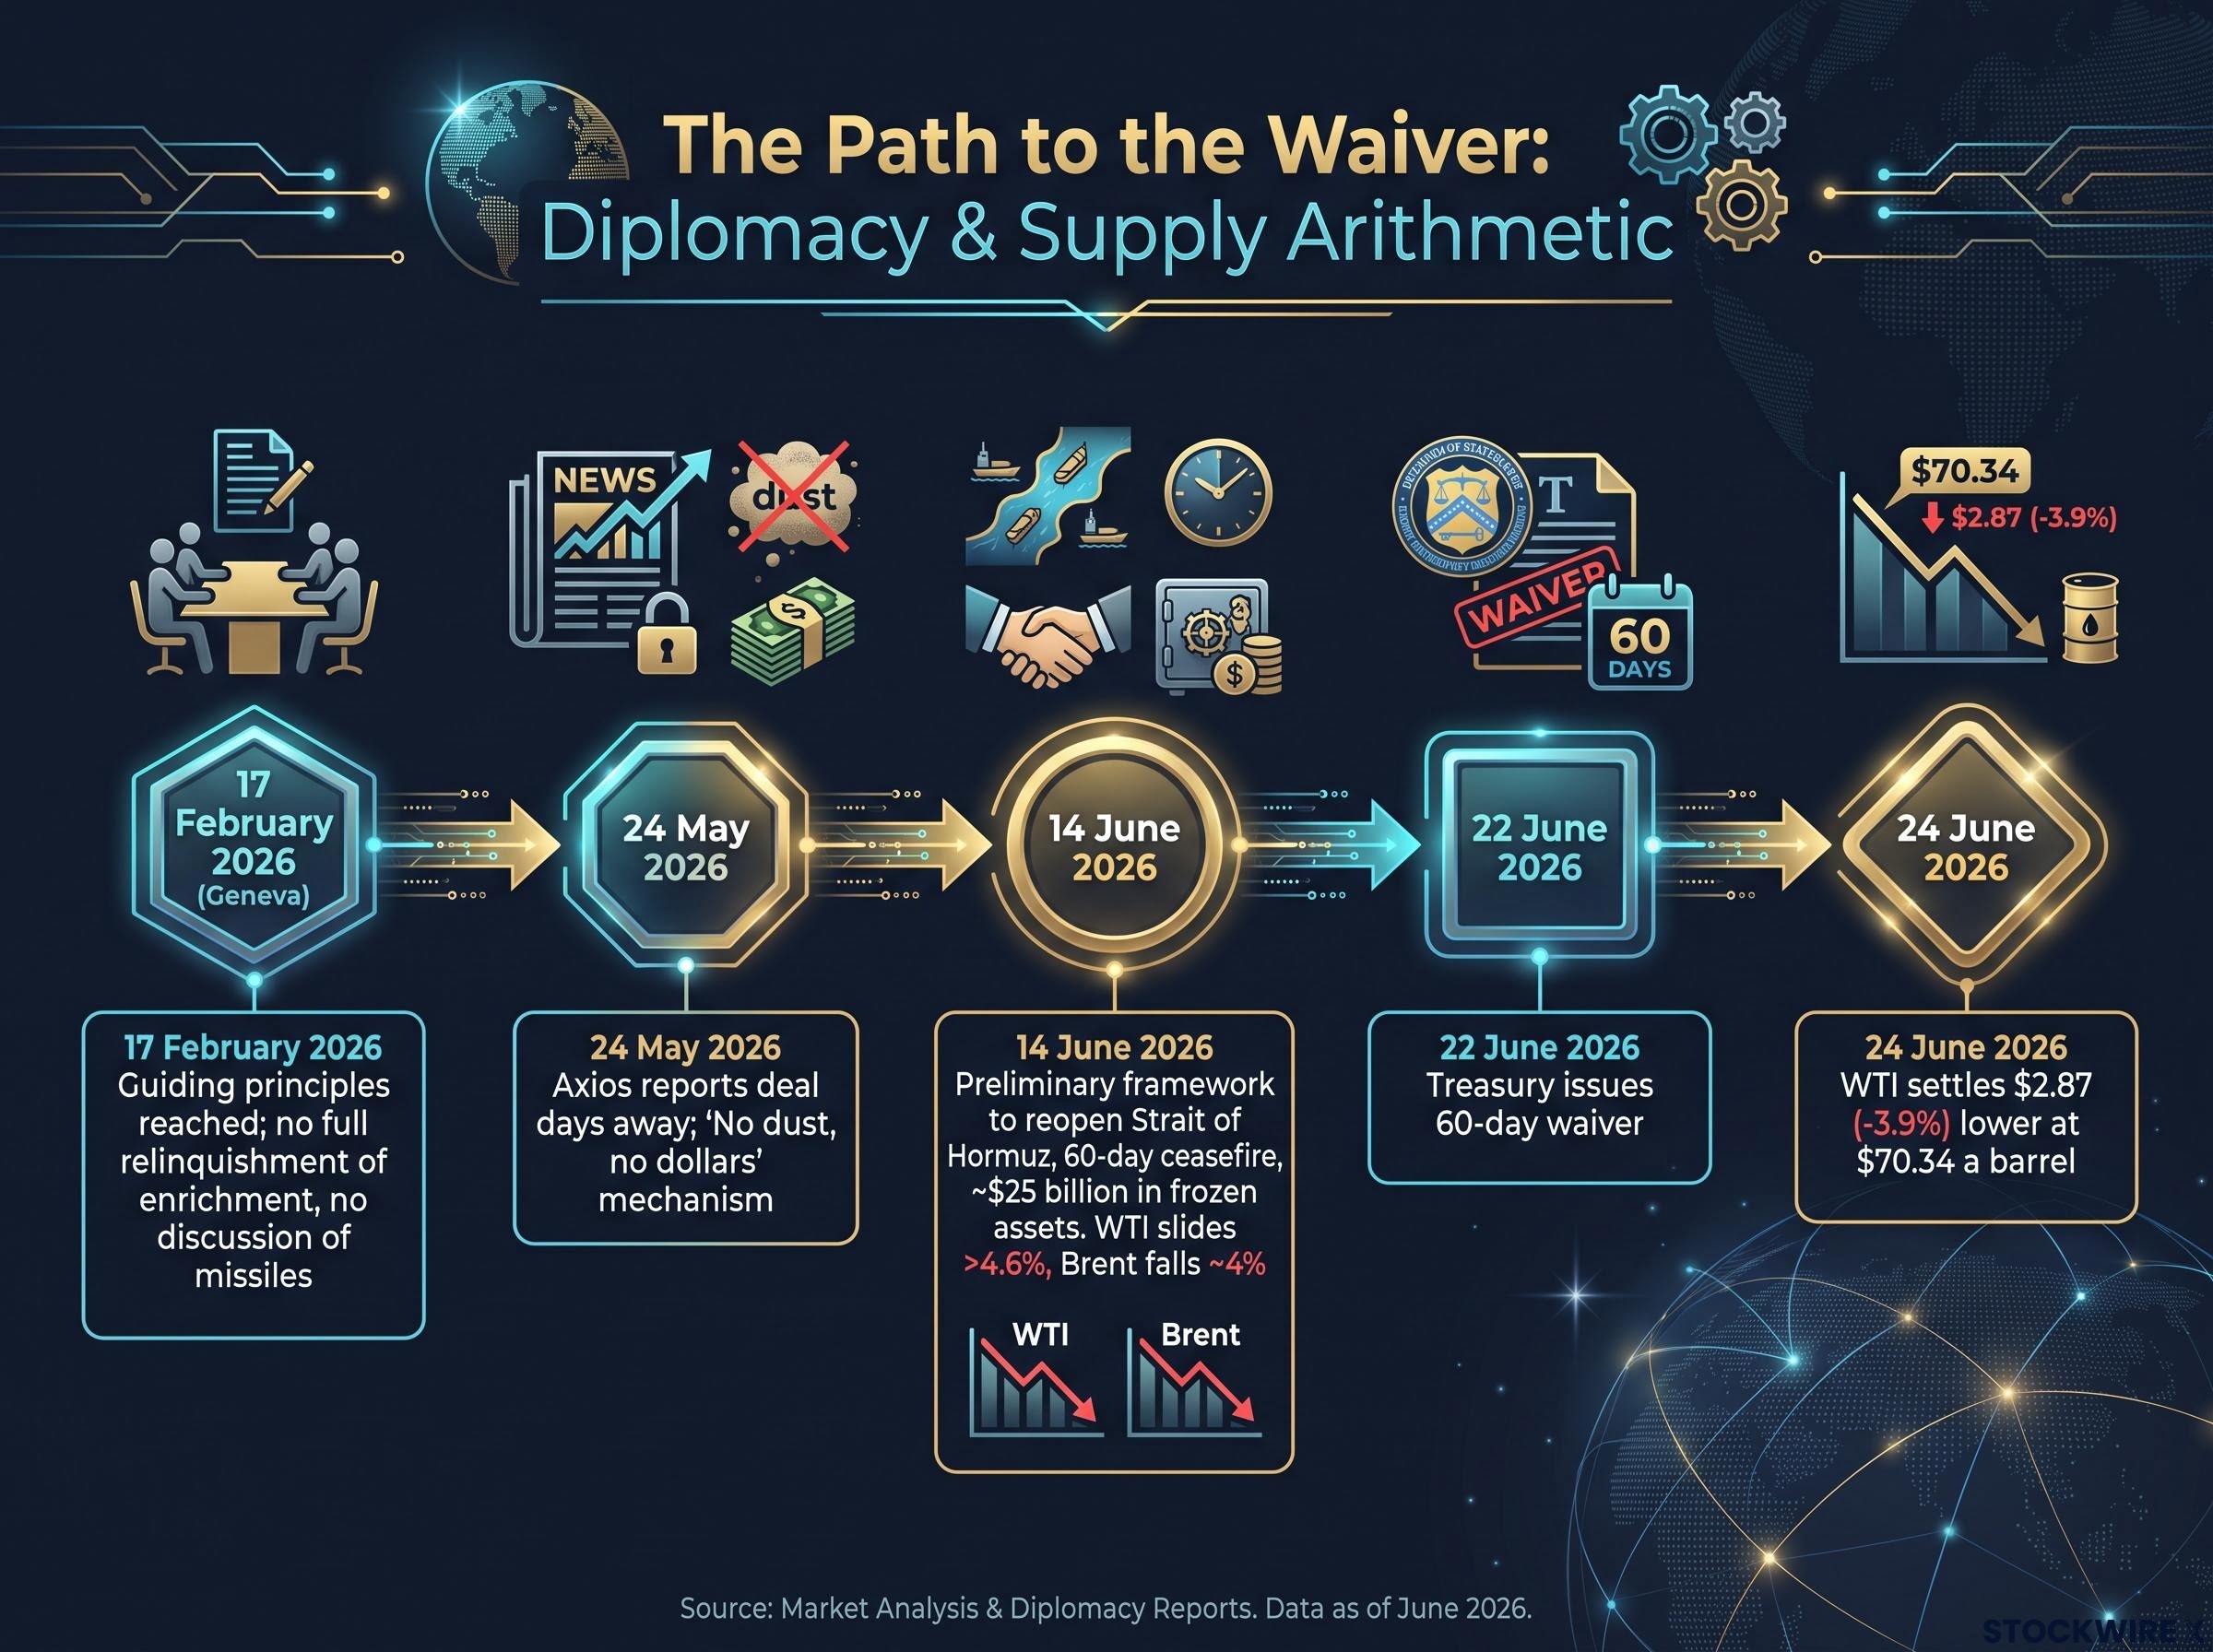
- 17 February 2026 (Geneva): Iran and the US reached an understanding on “guiding principles.” Foreign Minister Abbas Araqchi said Tehran would discuss curbs on its nuclear programme only in exchange for sanctions relief, while drawing red lines: no full relinquishment of enrichment, no discussion of missiles.
- 24 May 2026: Axios reported the White House believed a deal could be days away, with a US official articulating the deal’s structural logic as a sliding scale.
- 14 June 2026: A preliminary framework was agreed to halt the US blockade and reopen the Strait of Hormuz, with a 60-day ceasefire and broader talks to follow. Draft terms referenced roughly $25 billion in frozen Iranian assets.
- 22 June 2026: The Treasury waiver went live.
The structural logic that made traders take the supply relief seriously was captured in a single phrase.
“No dust, no dollars” A US official’s summary of the deal’s graduated mechanism, reported by Axios on 24 May 2026: the more Iran concedes on enrichment and nuclear material, the more sanctions relief it receives.
That mechanism is why the relief read as real but conditional. Barrels could flow, but only as long as concessions continued. And the conditionality was not hypothetical. Reuters confirmed on 23 June 2026 that Washington and Tehran remained at odds over nuclear inspections and the treatment of frozen assets, even after the waiver was in force.
For an investor, the takeaway is about calibration. The gap between a diplomatic statement and a Treasury instrument is the gap between noise and signal. Markets repriced supply risk sharply because the instrument was operative, but they stopped short of treating the move as permanent because the underlying disputes were not resolved.
The pre-waiver supply context helps calibrate the scale of the June repricing: Saudi crude output had collapsed to 6.316 million barrels per day in April 2026, its lowest since 1990, while global inventories were drawing at 8.5 million barrels per day, a rate that made any credible reopening signal disproportionately market-moving.
When big ASX news breaks, our subscribers know first
The oil reaction: supply arithmetic at work
The oil move did not happen in one session. It unfolded across several, and the sequence is what reveals the mechanism.
The first leg came on 14 June 2026. On news of the preliminary framework, Brent fell roughly 4% in early trade and WTI slid more than 4.6%, according to Reuters. Traders were pricing the prospect of Hormuz reopening before a single extra barrel had moved.
The waiver itself, on 22 June 2026, produced a more complicated picture. Prices had risen more than 3% earlier in the session before reversing, giving those gains back as the sanctions-relief news landed. By the New York close, WTI had fallen around 2% to near $74 a barrel, per the New York Times. In Asian trade the same day, Deutsche Welle reported Brent slipping more than 1% to about $79.70.
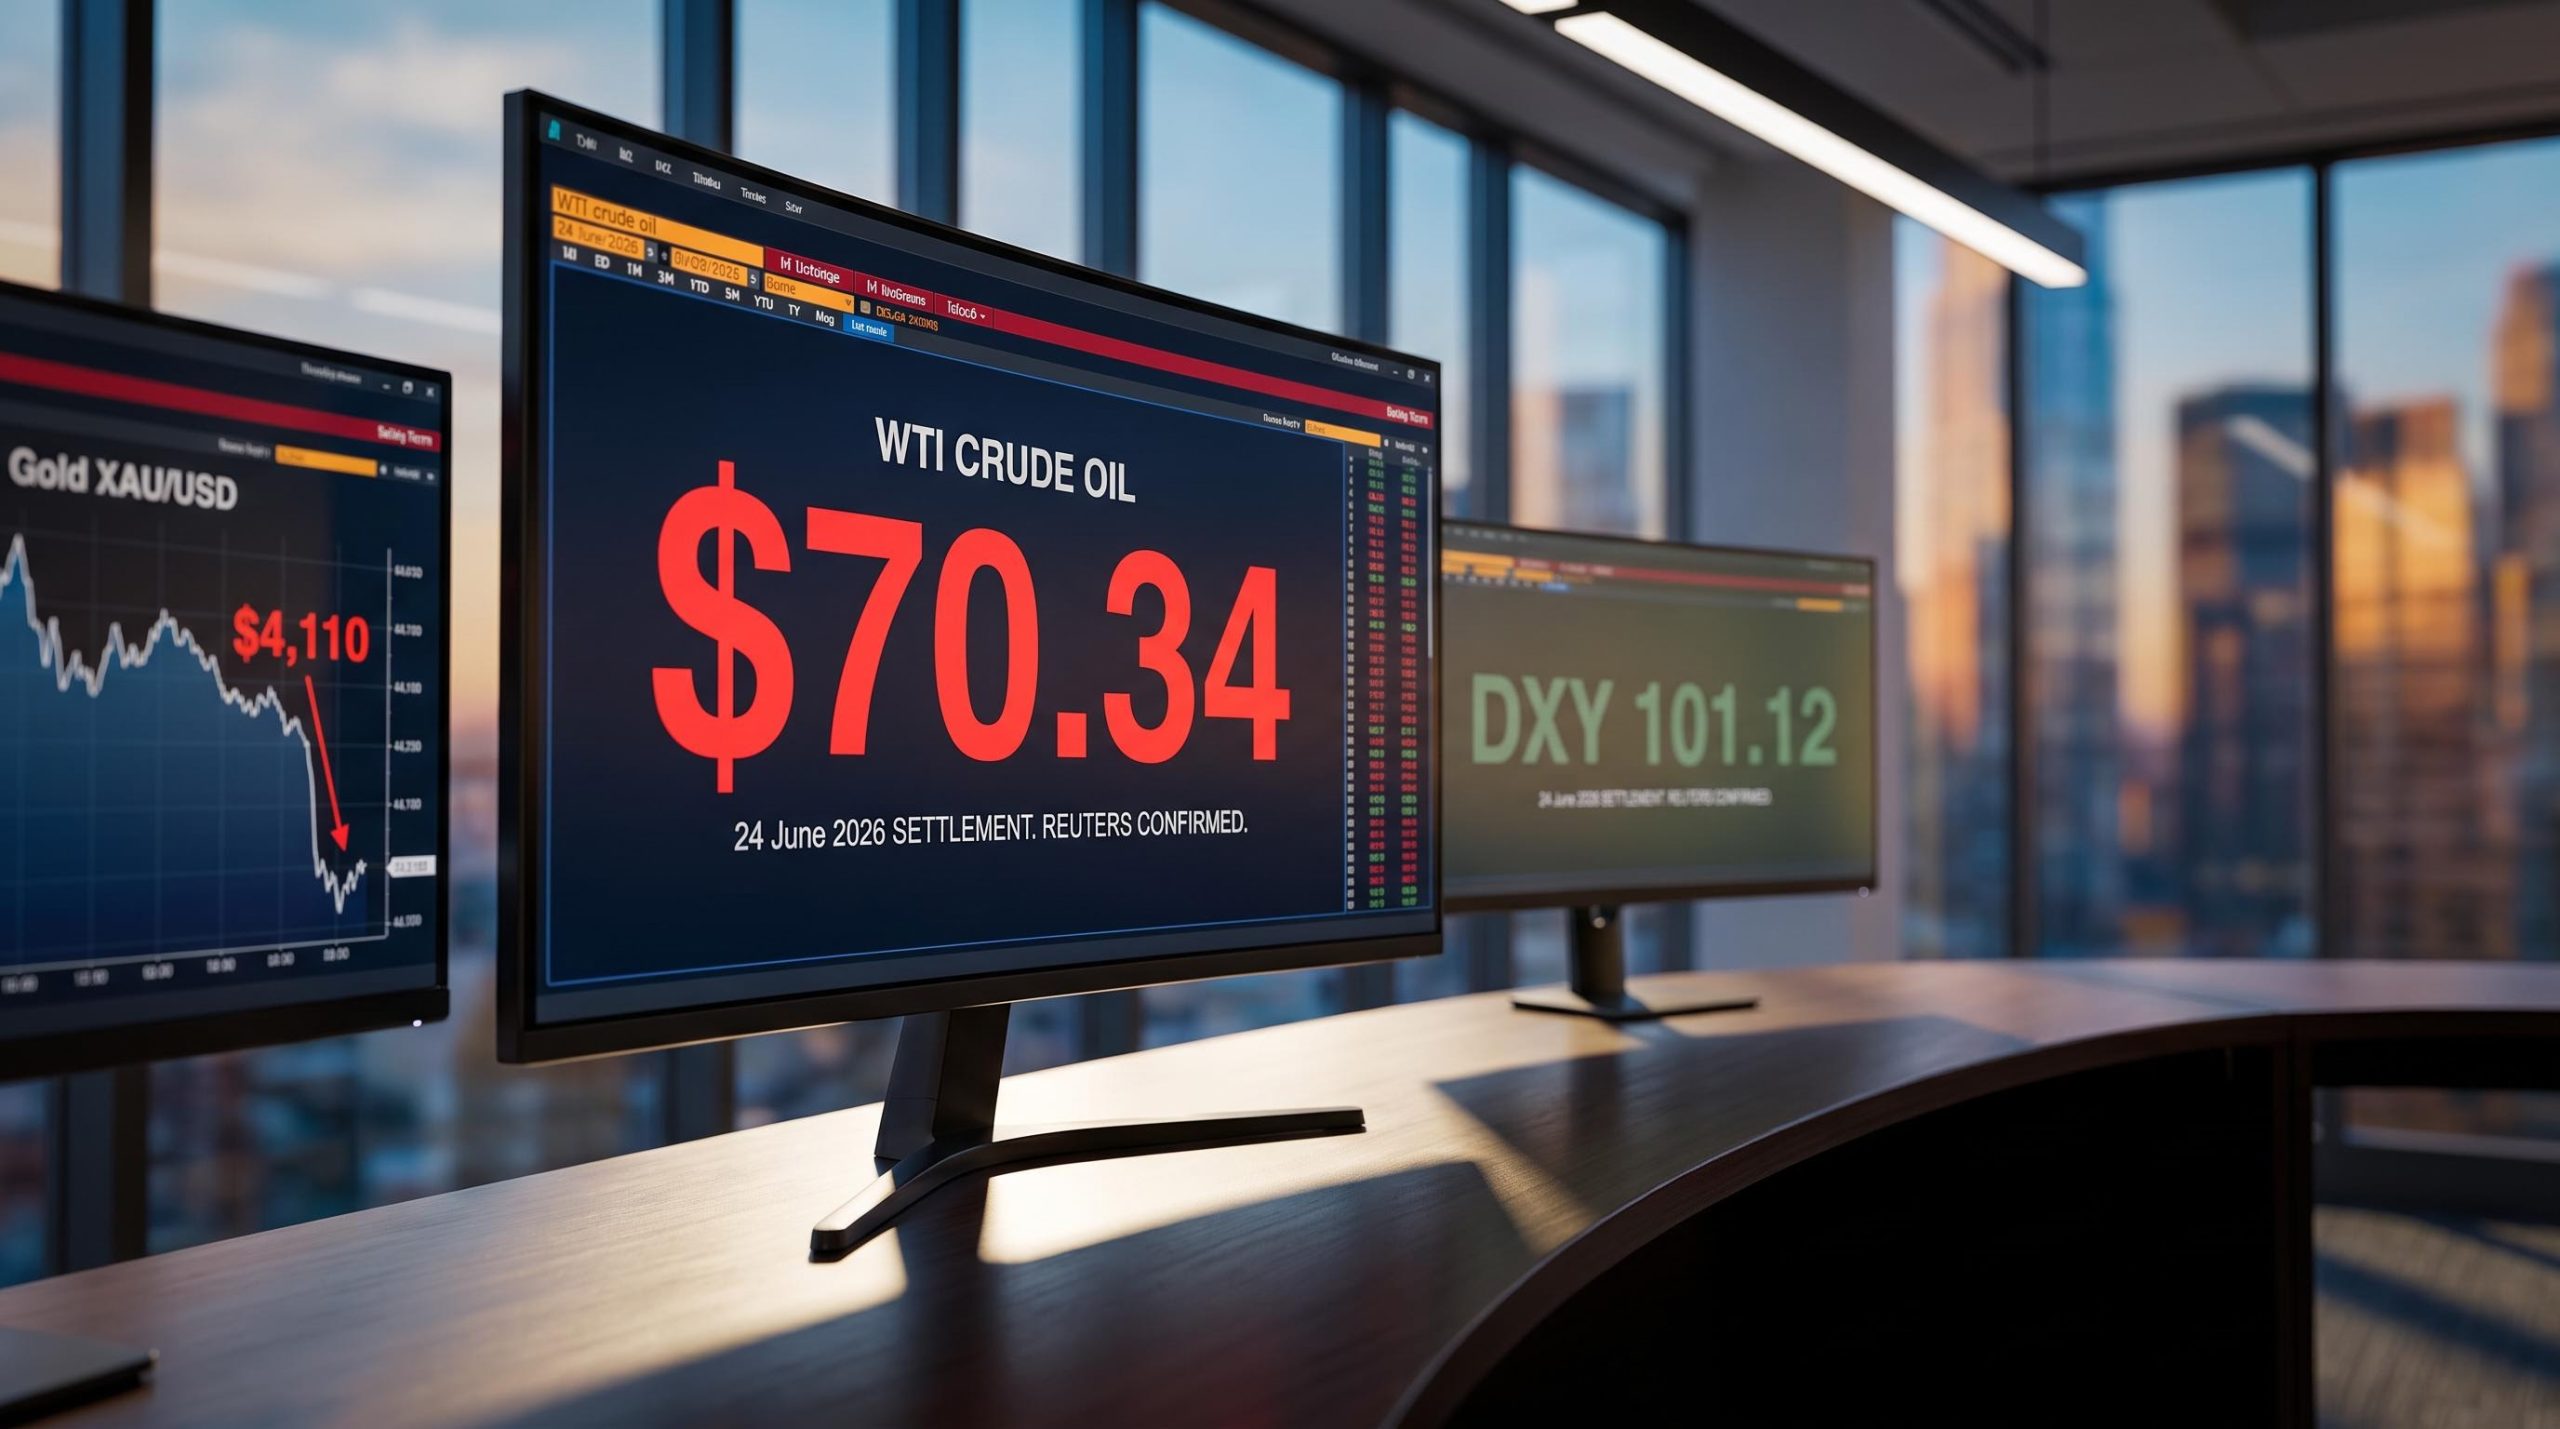
Then came the settlement that confirmed the direction. On 24 June 2026, Reuters reported WTI settled $2.87, or 3.9%, lower at $70.34 a barrel, its lowest level since before the Iran war began.
Two supply channels were reopening at once, which is why the repricing stretched across days rather than exhausting itself in a single spike. Iranian barrels, previously constrained by sanctions, could re-enter the global market under the waiver. And with the Strait of Hormuz reopening, stranded tankers could finally exit, easing the near-term bottleneck.
| Asset | Date | Move | Price Level | Source |
|---|---|---|---|---|
| WTI Crude | 14 June 2026 (early trade) | >-4.6% | N/A | Reuters |
| Brent Crude | 22 June 2026 (Asian trade) | >-1% | ~$79.70 | Deutsche Welle |
| WTI Crude | 22 June 2026 (intraday) | ~-2% | ~$74 | New York Times |
| WTI Crude | 22 June 2026 (reversal) | Gave back >3% prior gains | N/A | FXStreet |
| WTI Crude | 24 June 2026 (settlement) | -3.9% | $70.34 | Reuters |
The multi-session pattern tells you something a single-day chart would hide. Traders were not reacting to one headline; they were updating a supply model across multiple data points. That is genuine conviction about near-term Iranian supply, not algorithmic noise. If you hold oil-sensitive equities, energy funds, or commodity positions, the practical lesson is that a sanctions-relief supply shock does not finish repricing in a single session.
Why the move may not be permanent
Not everyone read the waiver as a structural shift, and there were two solid reasons for caution.
The first is OPEC+. Some strategists argued that the group, or other producers, could trim output to blunt the effect of returning Iranian barrels, limiting how far and how long prices fall. Part of the “Iran repricing” was arguably already sitting in the futures curve before the waiver.
The second is the precedent of reversibility. The 60-day waiver was time-limited and conditional by design, a point both the New York Times and Reuters made explicit. Traders therefore had structural reasons to treat the relief as a tactical, potentially reversible supply increase rather than a permanent one.
Diplomatic reversibility was already priced into the waiver session: when JD Vance cancelled Geneva talks on 19 June, just days before the waiver was issued, Brent fell below $80 per barrel, demonstrating that traders had assigned meaningful probability to an implementation breakdown even as the formal instrument was being finalised.
Gold and the dollar: when safe-haven math runs in opposite directions
Here is where intuition tends to break. Most investors assume gold and the dollar either move together as safe havens, or that a softer dollar should lift gold. On 22 June 2026, neither happened.
Gold fell more than 3.45% on the day, while the dollar barely moved. According to FXStreet market data reported by analyst Christian Borjon Valencia, gold (XAU/USD) dropped to a session trough near $4,110 before recovering to about $4,136. Over the same session, the dollar index pared prior gains of more than 0.20% to settle near 101.12, a gain of just 0.09%.
That is not a contradiction. It is a signal that gold and the dollar were hedging different risks entirely.
Four mechanisms drove gold lower despite the barely-changed dollar, and they matter in priority order.
The divergence is not a 2026 anomaly: in April 2026, the World Bank recorded a 12.1% surge in energy prices alongside a 2.7% decline in precious metals during the same Middle East conflict, illustrating how the geopolitical risk premium behaves differently across the two asset classes depending on which transmission channel dominates.
- Safe-haven unwinding (primary driver): Gold had been carrying a geopolitical risk premium tied to war and Hormuz disruption. When diplomacy reduced that tail risk, investors unwound defensive positions, pushing gold down regardless of the dollar.
- Real-yield implications: If de-escalation reads as growth-positive, markets may price higher real yields or a less dovish Federal Reserve, both of which weigh on gold.
- Inflation-premium compression: Gold embeds an energy-linked inflation hedge. As oil fell on expected Iranian supply, future inflation risk was marked down, softening that demand.
- Technical profit-taking: After a run-up on war headlines, “good news” can trigger profit-taking and systematic selling that amplifies intraday losses.
The divergence in one line Gold: down more than 3.45%, trough near $4,110. Dollar index: settled ~101.12, up just 0.09%.
The dollar did soften on de-escalation, but not nearly enough to counteract gold’s geopolitical unwind. (Note that these specific intraday figures come solely from FXStreet and were not independently corroborated in wire coverage, though the directional pattern fits the broader context.)
The read you should take from this is precise. Gold was functioning as a geopolitical hedge, not a currency hedge, in the period beforehand. If you hold gold in your portfolio, knowing which risk it is actually pricing, geopolitical tail risk, dollar weakness, or inflation, is what lets you anticipate its next move when one of those drivers resolves.
How durable are diplomacy-driven price moves? What history says
You now have the mechanics. The question that naturally follows is whether any of this sticks, and history offers a reasonably clear answer.
- JCPOA 2015 (announcement): Oil initially fell on expectations of higher Iranian exports, but the move proved modest and short-lived relative to macro drivers like the broader supply glut and OPEC policy. Market implication: relief-driven declines fade fast when other forces dominate.
- JCPOA 2018 (US withdrawal): Sanctions were rapidly re-imposed after a change in policy. Market implication: relief is only as durable as the political continuity behind it.
- 2026 60-day waiver: A live but conditional instrument with unresolved disputes attached. Market implication: sharp repricing, but with reversibility priced in from the start.
The 2018 withdrawal is the reference point that keeps 2026 traders cautious. A deal undone by a policy shift is not a tail scenario in this context; it is documented precedent. Any pricing of Iran-relief durability has to account for political reversibility.
Applied to the current situation, the specific variables that will decide durability are already visible: the dispute over nuclear inspections (Reuters, 23 June), Iran’s red lines on enrichment and missiles (Reuters, 17 February), the roughly $25 billion frozen-asset question, and the waiver expiry around 21 August 2026. As of late September, none had been settled. Reuters and Axios reporting from 25-28 September 2026 indicated negotiations remained live, with Trump signalling more talks expected.
The most reliable prediction here is not direction but timing. Diplomacy-driven moves tend to be front-loaded and partially revert unless physical supply changes and political settlement both materialise. If you mistake a supply repricing for a permanent structural shift, you risk being caught on the wrong side of a partial reversion.
What the unresolved variables mean for positioning now
The framework is only useful if it points to something to watch. Three specific catalysts, not general geopolitical risk, will determine whether June’s moves extend, stall, or reverse.
- Nuclear inspections resolution or breakdown (highest stakes): A breakdown on inspections is the most likely trigger for sanctions reimposition and a rapid reversal of oil’s supply-relief pricing. This is the variable to watch first.
- The 21 August 2026 waiver decision: Renewal extends the supply relief; expiry without renewal removes it. Either outcome moves oil directly.
- OPEC+ production response: If the group trims output to offset returning Iranian barrels, the long-term price effect is blunted, complicating any straight-line bearish oil view.
The state of play as of late September confirms the market is still in contingent pricing rather than settled repricing. Reuters reported on 25 September 2026 that negotiators in New York were exploring a phased path out of the war, and Axios noted three days later that Trump expected further talks.
On the ongoing talks On 28 September 2026, Trump said in a phone interview that he expected US negotiators to hold more talks with Iran in the coming week (Axios).
For anyone holding energy, commodity, or macro-sensitive positions, this narrows the monitoring task. Watching the inspections headline and the August waiver decision gives you a sharper early-warning signal on oil and gold direction than tracking broad geopolitical news ever will.
A playbook, not a prediction: what this episode adds to your toolkit
Strip the June session down to its lessons and you are left with a reusable model rather than a one-off event.
- Diplomacy-driven supply relief produces front-loaded, partially reversible moves in oil (WTI settled at $70.34 on 24 June), so treat the first move as an overshoot until physical barrels confirm it.
- Gold responds to geopolitical risk-premium changes, not dollar direction (down more than 3.45% on 22 June while the dollar rose 0.09%), so identify which risk it is hedging before predicting its next move.
- The dollar is a lagging indicator in de-escalation episodes, not a leading one, so do not read a muted DXY (~101.12) as the market’s verdict on the news.
The “No dust, no dollars” logic is the transferable part: the more verifiable the concession, the more durable the repricing. As of 28 September 2026, the US-Iran situation remained unresolved, with the waiver window passed and talks continuing, which means these price moves may still have chapters to write.
For investors wanting a standing framework to apply before the next diplomacy headline breaks, our dedicated guide to geopolitical investing strategy covers gold allocation sizing, rebalancing discipline across geopolitical drawdowns, and defence sector exposure, with worked guidance for the full 2025-2026 crisis cycle.
This article is for informational purposes only and should not be considered financial advice. Investors should conduct their own research and consult with financial professionals before making investment decisions. Past performance does not guarantee future results, and these forward-looking scenarios are speculative and subject to change based on market developments.