Why the Magnificent Seven Are Lagging Despite AI Fever
30 mins ago
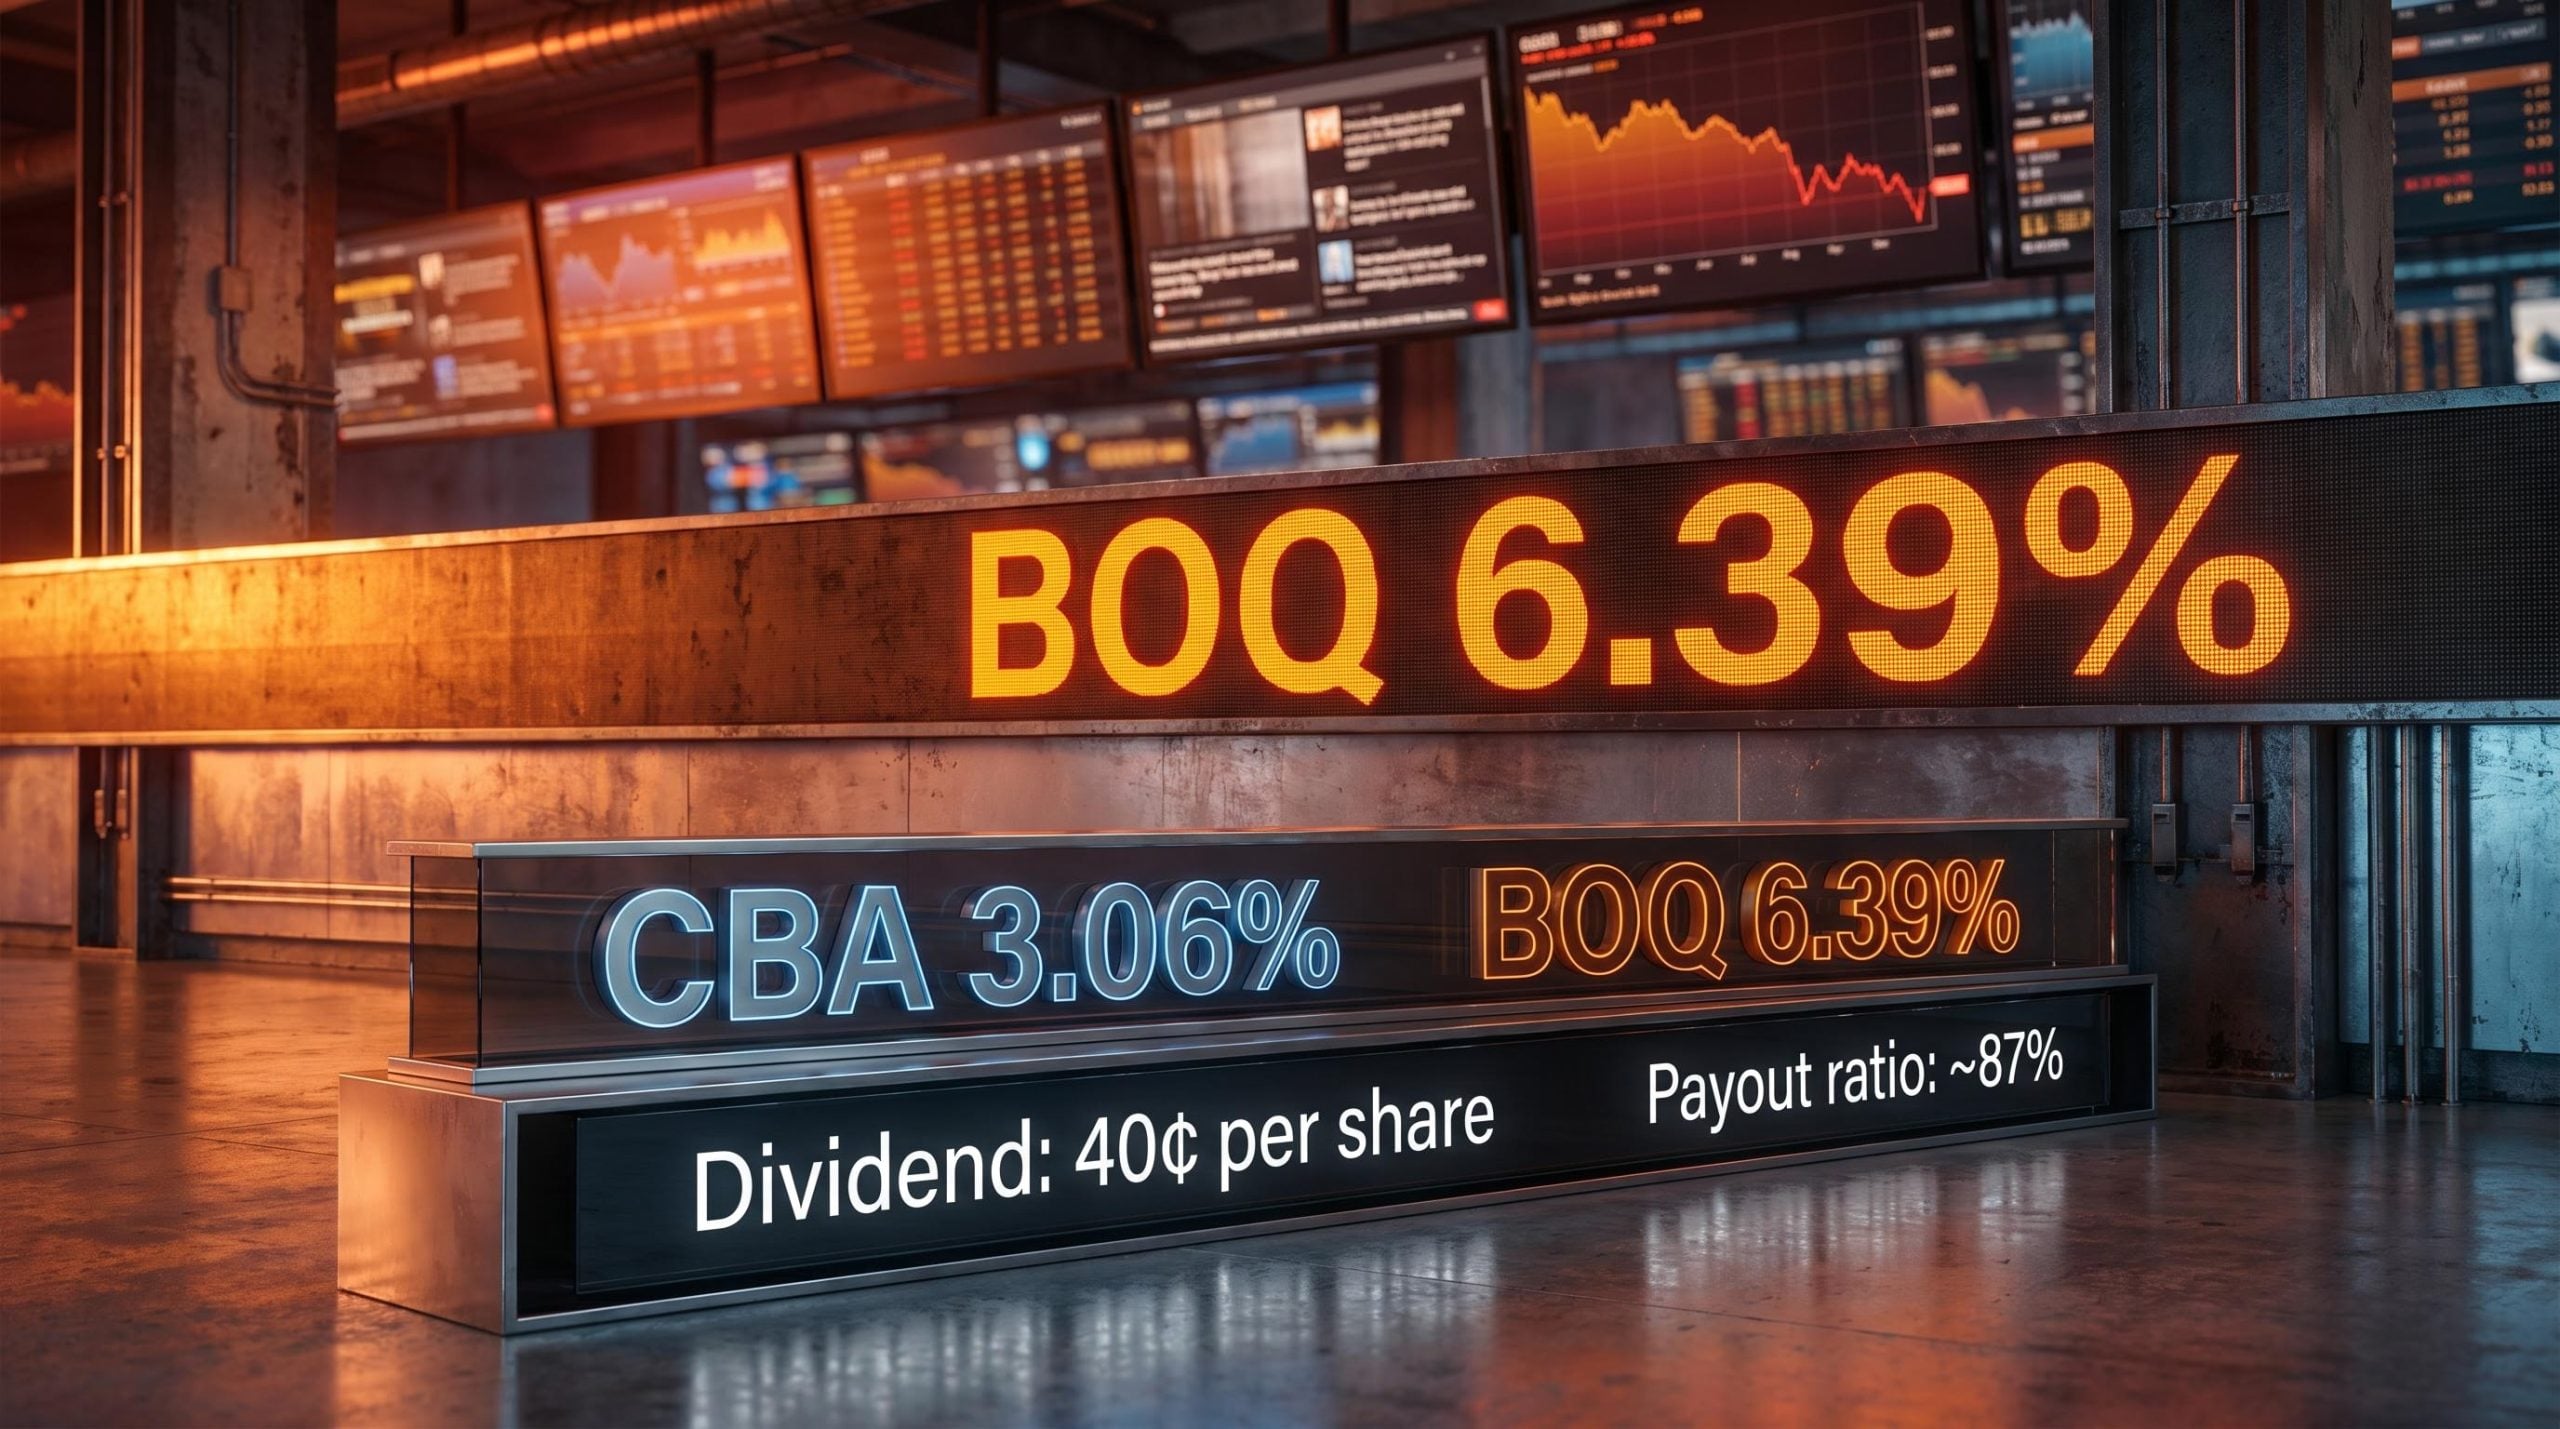
Bank of Queensland pays a 6.39% fully franked dividend yield. That is more than double Commonwealth Bank of Australia’s yield and materially above every big four peer. For an income investor scanning the ASX bank sector, it looks like the obvious pick.
The first question worth asking is why the market is offering you that premium. Elevated yields in bank stocks do not typically signal exceptional generosity from the board. They signal that the market has priced in elevated risk, and the share price has fallen to the point where the yield arithmetic flatters a story the fundamentals may not support.
Here is the evidence you need to make that call: yield mechanics, dividend history, structural position, long-term capital performance, and a practical positioning framework for deciding whether BOQ belongs in your portfolio, and if so, how much.
The numbers are straightforward, and the gap they reveal is not.
| Bank | ASX Code | Approx. Dividend Yield (%) | Fully Franked |
|---|---|---|---|
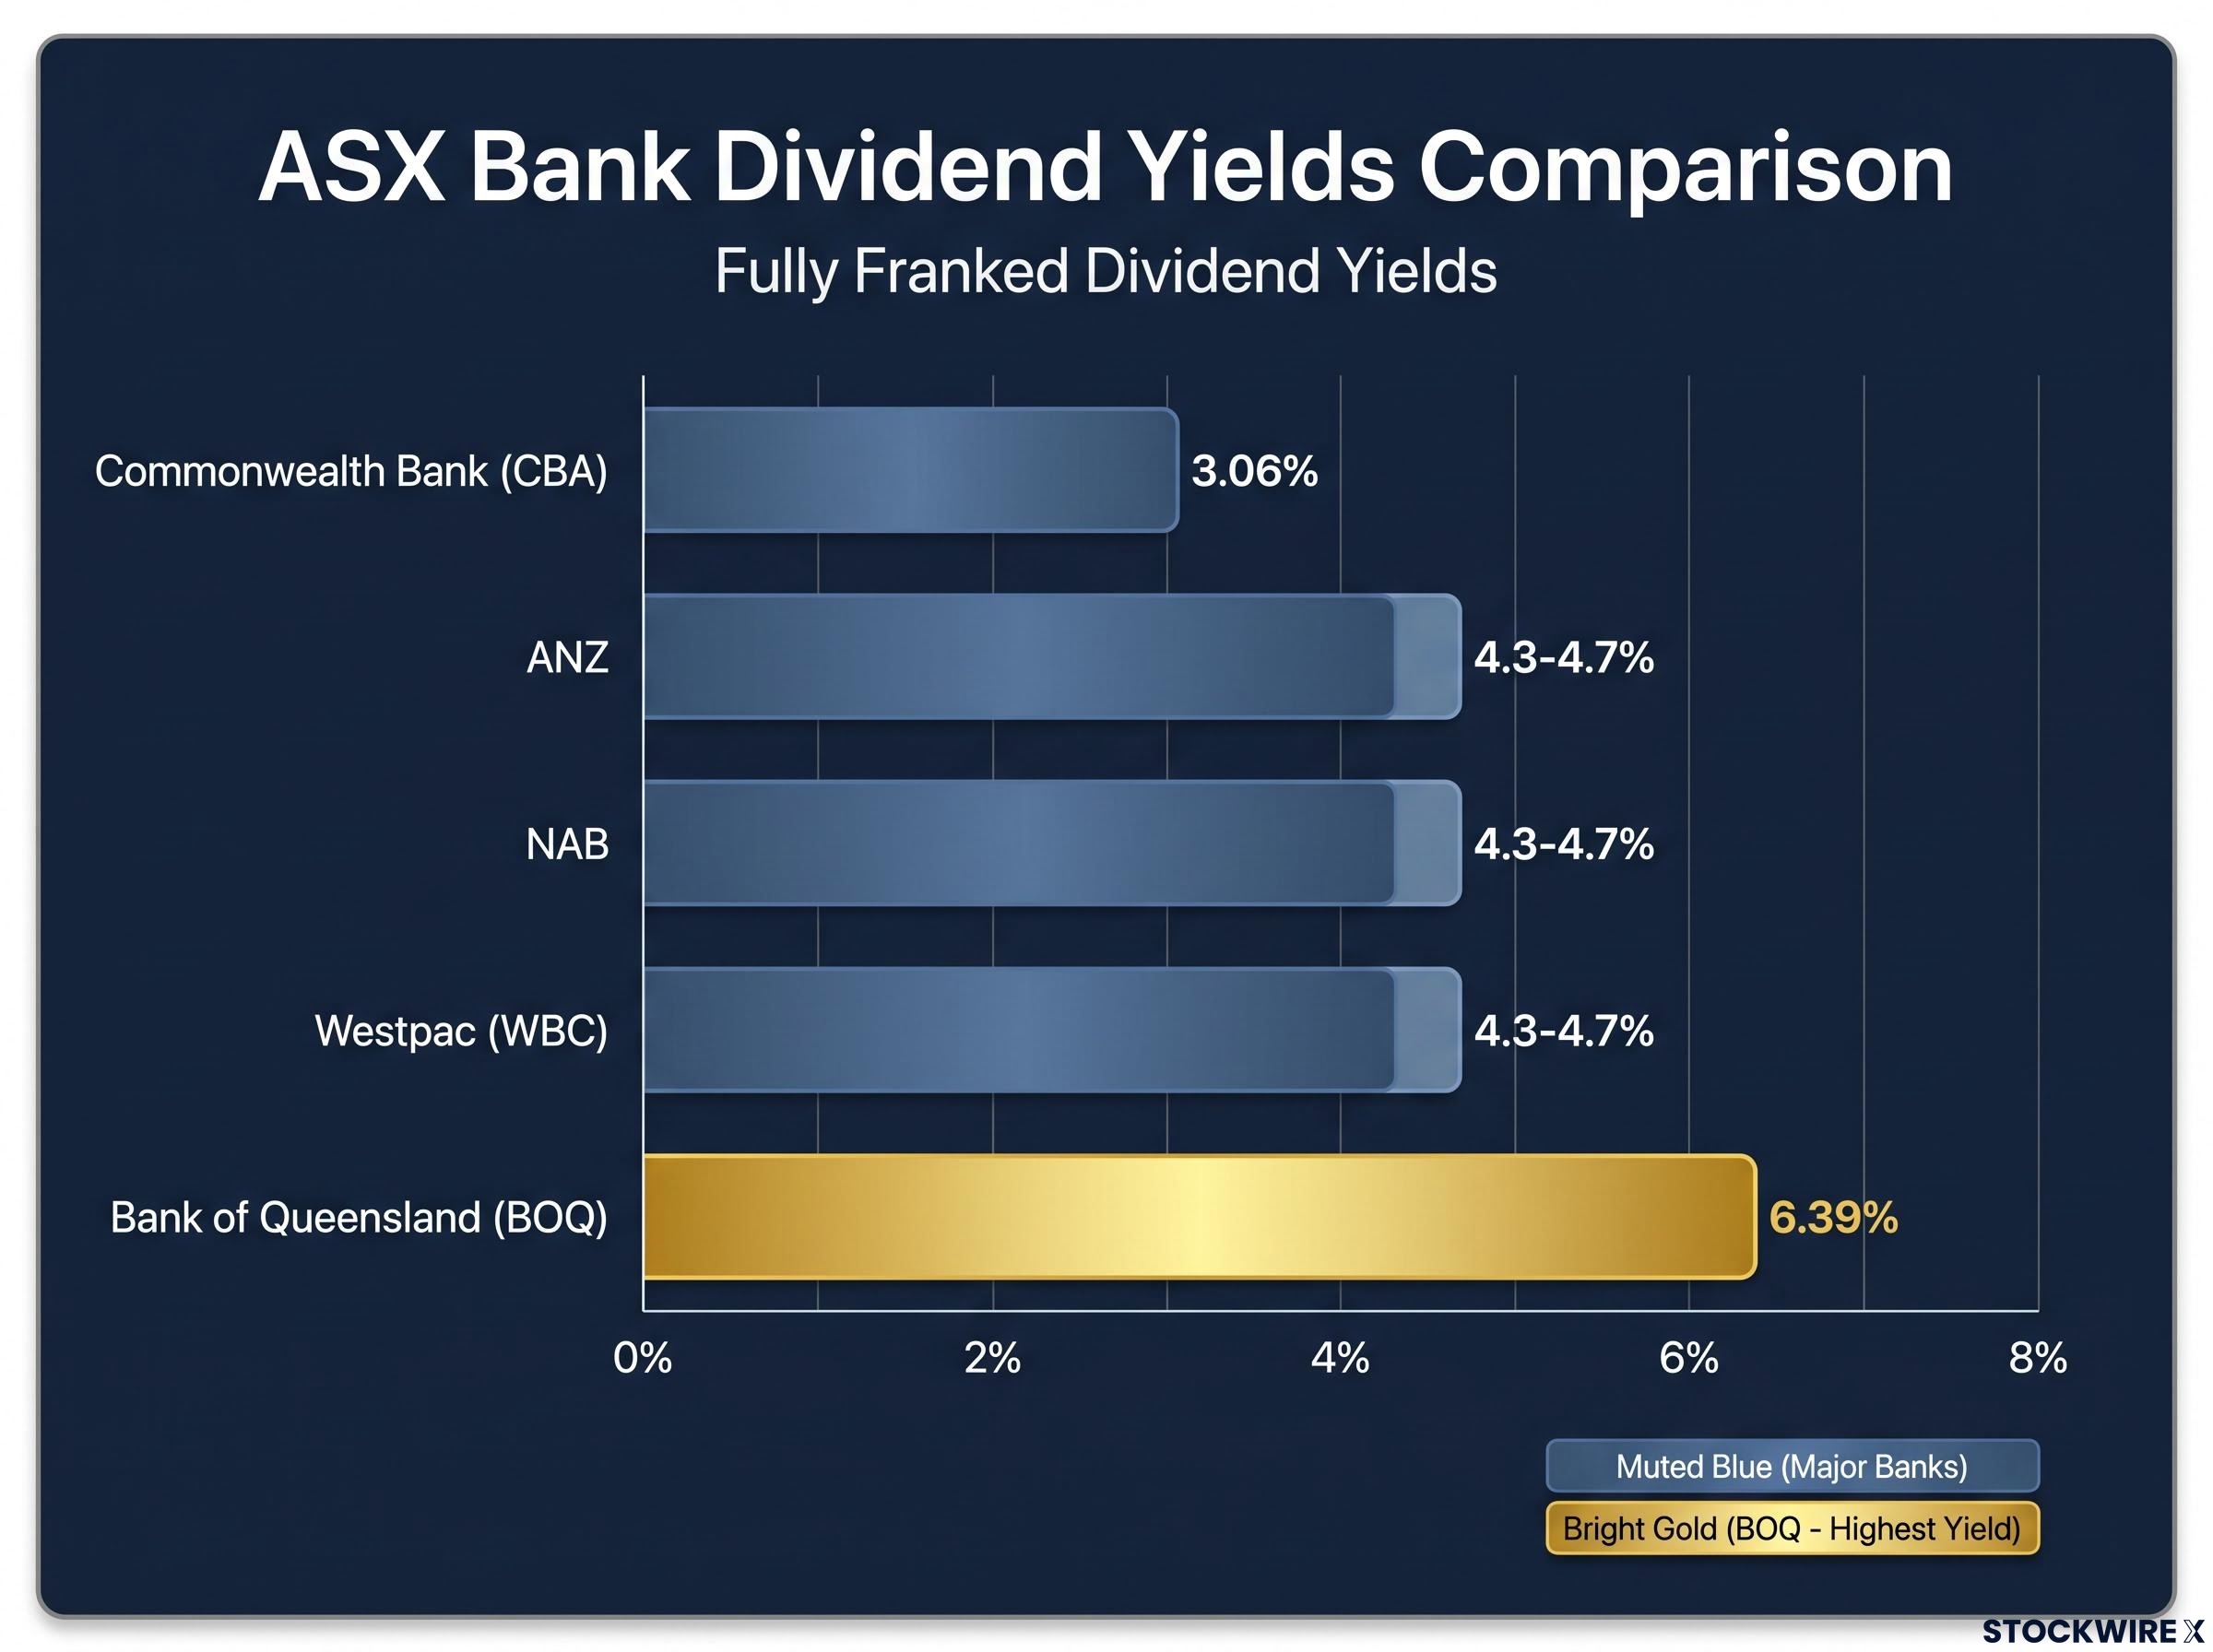
| Commonwealth Bank | CBA | 3.06% | Yes |
| ANZ | ANZ | 4.3-4.7% | Yes |
| NAB | NAB | 4.3-4.7% | Yes |
| Westpac | WBC | 4.3-4.7% | Yes |
| Bank of Queensland | BOQ | 6.39% | Yes |
BOQ’s 6.39% yield sits roughly double CBA’s 3.06%. That spread tells you less about BOQ’s generosity and more about the market’s relative confidence in each franchise.
The yield equation is simple: dividends divided by price. A high yield can mean the dividend is unusually strong, the price is unusually low, or both. BOQ pays a trailing 40 cents per share on a share price of approximately $6.24-$6.26. Those numbers produce the headline figure, but they also frame the question every subsequent section of this analysis answers: what is driving the yield, and is it something you want exposure to?
A grossed-up yield calculation shifts the comparison substantially: BOQ’s 6.39% cash yield becomes a higher pre-tax equivalent for eligible investors once the 30% corporate tax credit is added back, and applying the same adjustment to big four peers narrows the apparent yield premium that initially makes BOQ look attractive.
Yield is a ratio, and ratios move in two directions. When a company’s share price falls while its dividend stays flat, the yield rises mechanically. No improvement in the business occurred. No additional income was generated for existing shareholders. The share price just dropped, and the arithmetic did the rest.
That distinction matters because there are two very different reasons a bank stock might yield 6% or more:
BOQ’s trailing dividend of 40 cents per share on a share price of approximately $6.25 sits squarely in the second category. If the share price fell further while the dividend held flat, the yield would rise again, without any improvement in the bank’s capacity to keep paying.
The ASX presents these dynamics with particular force because the average payout ratio of 70-75% already leaves a narrower earnings buffer than developed-market norms, and the dividend trap warning signs on local exchanges often arrive later than the underlying fundamentals would suggest.
Fully franked dividends mean the company has already paid 30% corporate tax on the profit distributed. Eligible Australian investors receive a tax credit for that amount, which reduces their personal tax liability or generates a refund. The benefit varies by individual tax rate, and investors who cannot fully utilise franking credits, including some self-managed super funds in pension phase and foreign investors, should not overweight this feature in their return calculations.
The risk of a dividend cut is not hypothetical for BOQ shareholders. It has already happened.
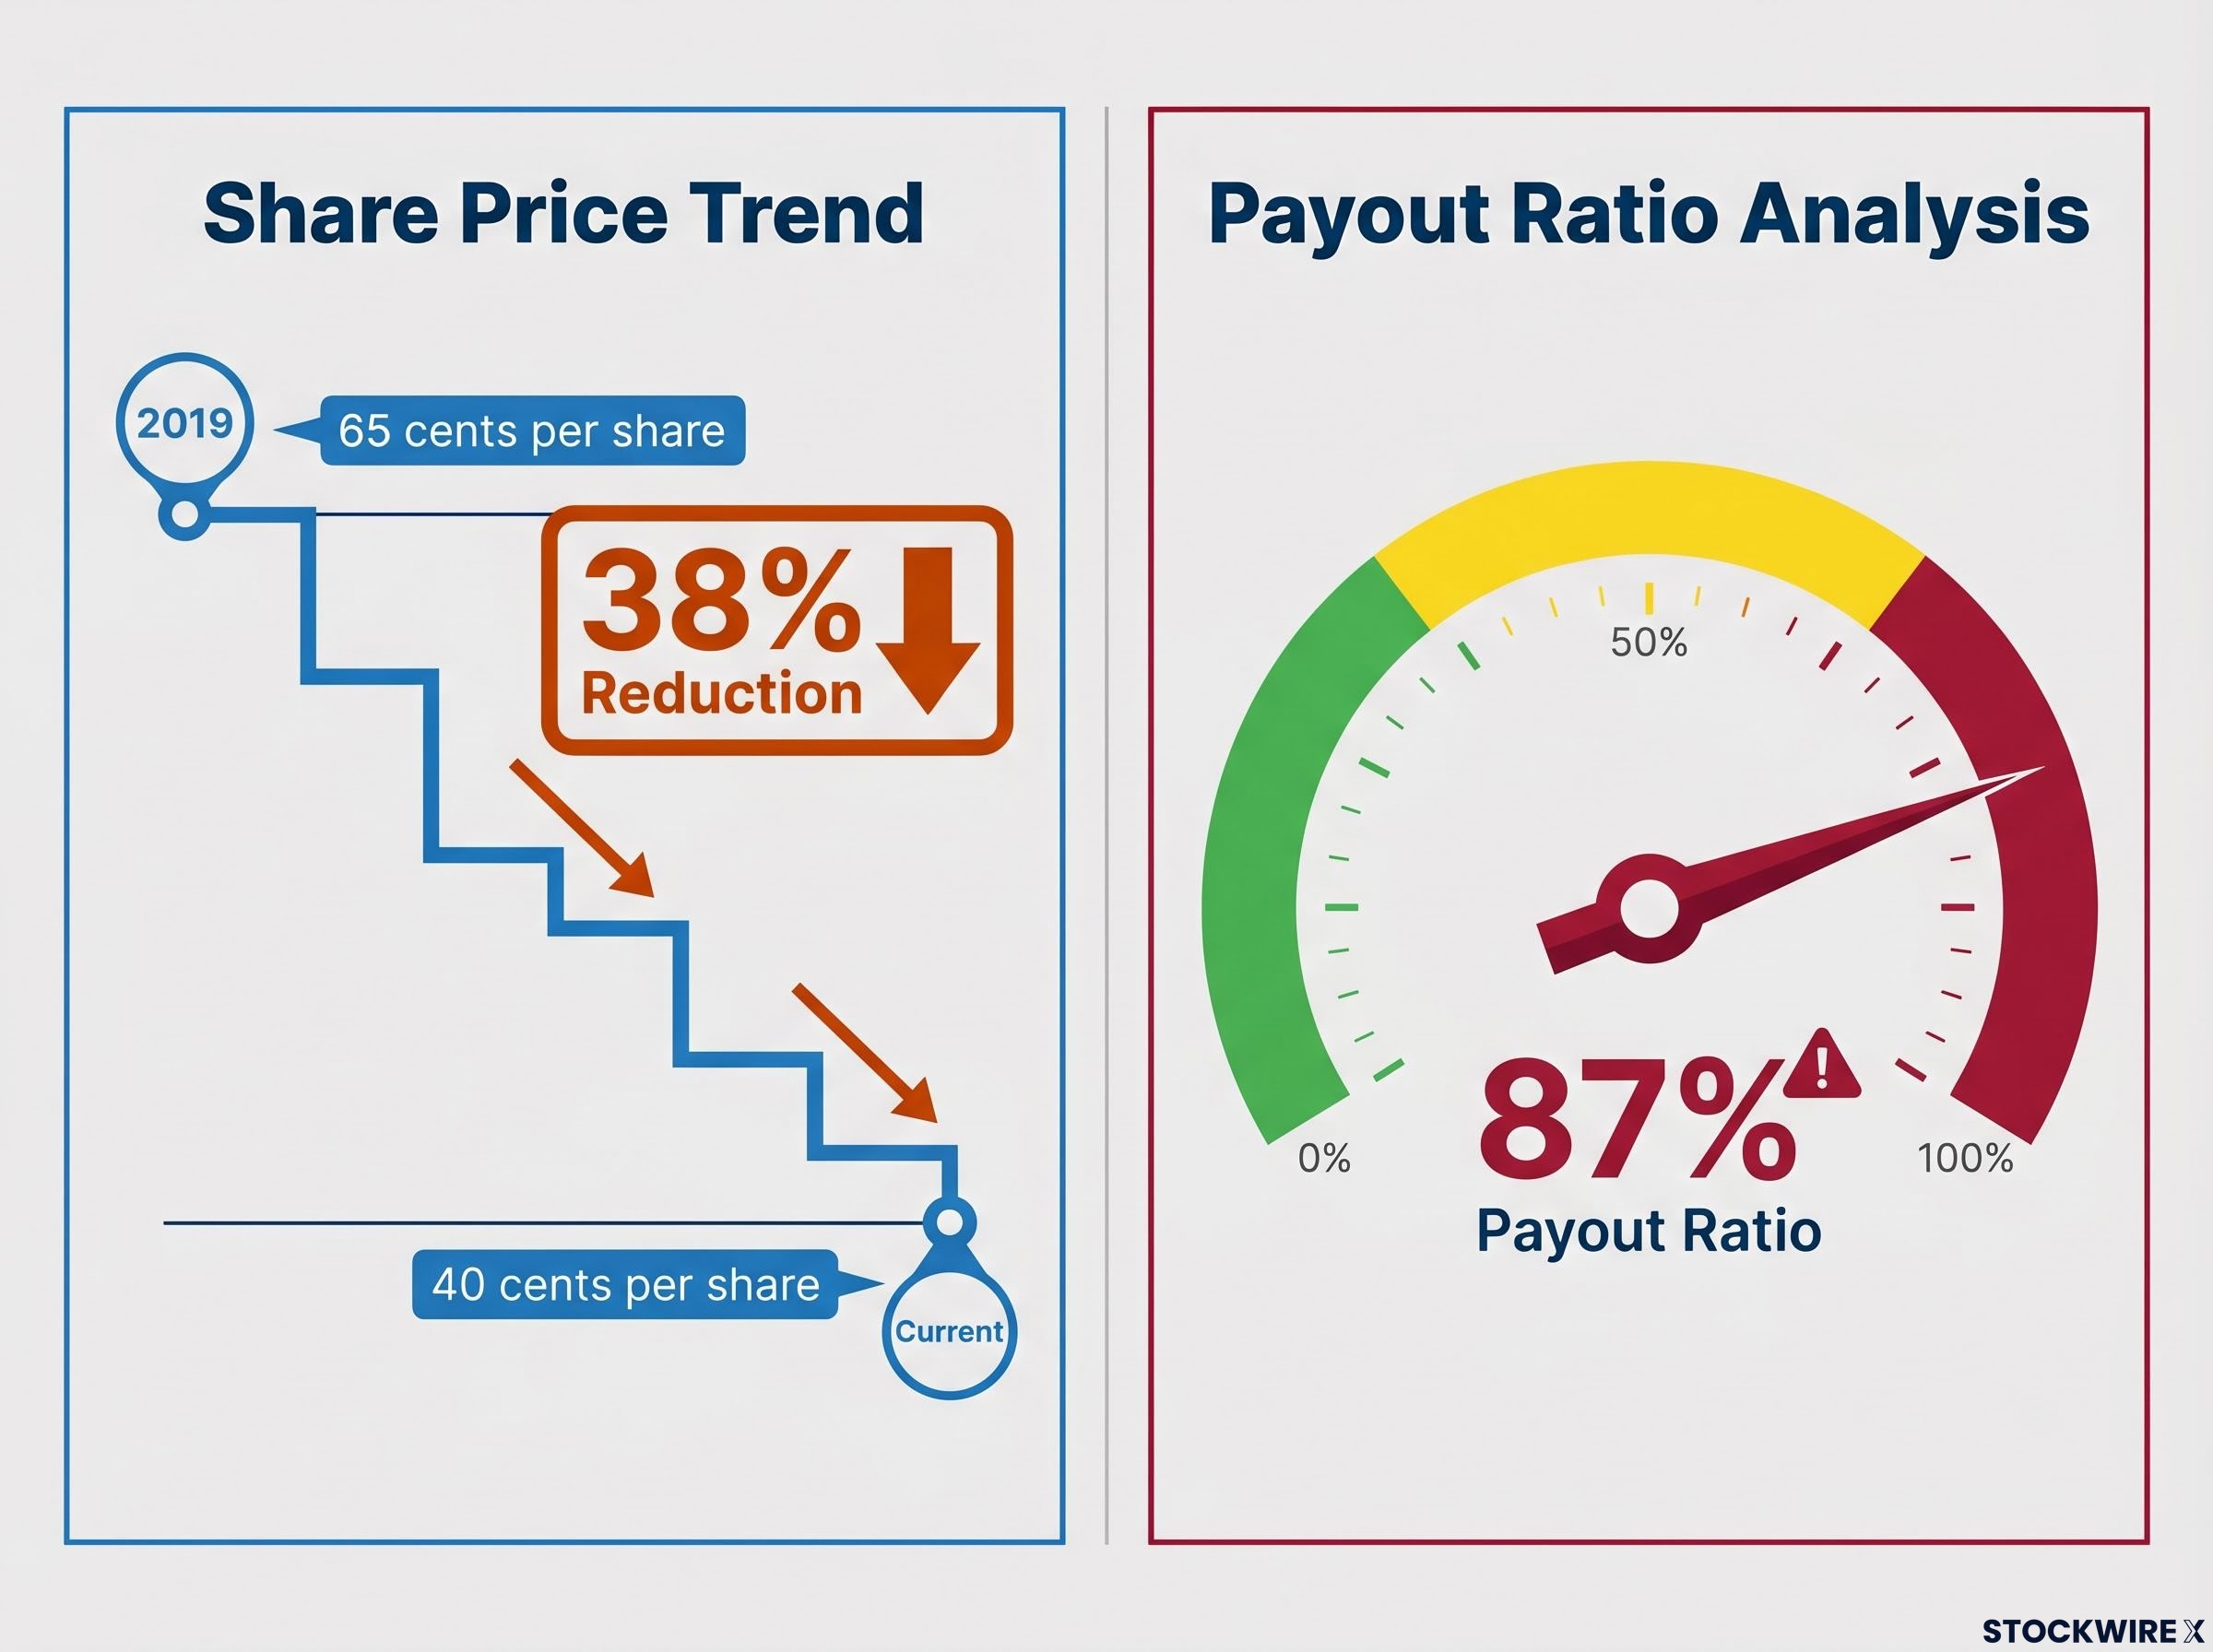
BOQ shareholders have already experienced a dividend reduction of approximately 38% since 2019, from 65 cents to 40 cents per share. The question is whether the current 40 cents is a floor or a mid-point.
In 2019, BOQ paid a full-year dividend of 65 cents per share. The trailing 12-month figure is now 40 cents per share, a reduction of approximately 38% over that period. That is not a minor adjustment. It is a material recalibration of the income stream the market had previously priced in.
Whether the current 40 cents holds depends on two factors:
An 87% payout ratio on a structurally constrained earnings base is not a sign of confidence in future growth. It is a sign that the current dividend is consuming nearly everything the bank earns. For income investors, that means the gap between today’s yield and the next potential cut is uncomfortably narrow.
APRA’s APS 110 capital adequacy standard requires authorised deposit-taking institutions to maintain prescribed capital levels at all times, and any dividend payment that would reduce capital below those thresholds requires prior APRA approval, a constraint that sits above a board’s discretion when earnings deteriorate.
BOQ’s share price discount to the big four is not a temporary mispricing waiting for a catalyst to correct it. It is the market’s rational response to a competitive position that is unlikely to change.
The core constraint is scale. BOQ cannot match the cost efficiency, funding costs, technology investment capacity, or revenue diversification of CBA, ANZ, NAB, or Westpac. Those advantages compound over time. Larger banks attract cheaper deposits, invest more in digital infrastructure, absorb compliance costs more efficiently, and generate revenue from a broader range of financial products. BOQ competes in the same markets with a fraction of those resources.
| Structural Disadvantages (Persistent) | Cyclical Headwinds (May Improve) |
|---|---|
| Scale disadvantage vs. big four | Interest rate shifts affecting margins |
| Higher relative funding costs | Credit cycle dynamics |
| Technology investment constraints | Housing market conditions |
| Profitability ceiling on competitive position | Certain regulatory movements |
BOQ’s price-to-earnings ratio (P/E), which measures what investors are willing to pay per dollar of earnings, sits at approximately 11.5x. That is below the multiples commanded by the majors, and it reflects rational investor expectations about where BOQ’s profitability ceiling sits. The market is not mispricing the stock. It is pricing the structural reality.
NIM, ROE, and CET1 tell a consistent story for BOQ: a net interest margin of 1.56%, a return on equity of 4.7%, and a CET1 of 10.7% in FY24 all trail the major bank benchmarks simultaneously, and a bank earning below the estimated 9-11% cost of equity threshold is, in analytical terms, destroying value even while paying dividends.
Three additional risk dimensions bear directly on dividend sustainability. Non-performing loan exposure affects the reliability of the earnings that fund dividends. Wholesale funding reliance, as opposed to cheaper deposit funding, creates cost volatility that can compress margins unexpectedly. And legacy technology systems require ongoing capital investment that pressures costs and limits the bank’s ability to compete digitally. Each of these risks feeds back into the earnings base that supports the 40-cent dividend.
A 6.39% yield in isolation sounds like a compelling income proposition. Placed alongside BOQ’s long-term share price trajectory, the picture shifts substantially.
The share price of BOQ today sits at around half the level it occupied some two decades ago. Income received over that period has not compensated for that scale of capital destruction.
BOQ’s current share price of approximately $6.24-$6.26 sits at roughly half the level from around 2006. That is not a temporary drawdown. It is two decades of sustained capital erosion, and it connects directly to the structural disadvantages outlined above. A business that cannot match its larger competitors on scale, cost efficiency, or competitive position will, over time, see that reality reflected in its valuation.
Total return has three components, and ignoring any one of them distorts the picture:
When the third component is a sustained decline, the first two need to work significantly harder to deliver a satisfactory total return. For BOQ, dividends have themselves declined 38% over recent years while the capital base has eroded over two decades. That combination is the total return story, and it is materially less attractive than the headline yield suggests.
The analysis assembled across this piece points to a clear, differentiated answer depending on which type of investor you are.
The right question is not whether BOQ looks cheap. It is whether 6.39% fully franked is adequate compensation for the structural, dividend, and capital risks the data reveals.
| BOQ may suit investors who… | BOQ may not suit investors who… |
|---|---|
| Understand the yield is risk compensation, not hidden value | Rely on BOQ as a core income source |
| Size the position as a modest satellite holding | Seek capital growth from their bank holdings |
| Hold higher-quality big four exposures as core positions | Would concentrate heavily in BOQ based on yield alone |
| Can effectively utilise fully franked dividends | Cannot utilise franking credits or need stable income |
| Accept the real possibility of further dividend reductions | Assume the current 40 cents per share is a guaranteed floor |
The positioning principle is straightforward: if BOQ belongs in your portfolio at all, it belongs as a small, diversifying exposure alongside stronger major bank positions. It is not a core income backbone. An 87% payout ratio, a 38% dividend cut already realised, a structural earnings ceiling, and 20 years of capital erosion are not characteristics of a stock that should carry a large allocation, regardless of how attractive the headline yield appears.
BOQ’s 6.39% fully franked yield is the market’s price tag on a structurally constrained franchise with a demonstrated history of dividend cuts and sustained capital erosion. The yield is real, the franking credits are real, but so is every risk factor that pushed the share price low enough to produce that number.
For a specific type of investor, a small, deliberately sized BOQ position alongside core big four holdings can serve a diversifying role. That is a defensible use case, provided the risks are understood and accepted rather than ignored in pursuit of the headline figure.
The variable to watch from here is whether earnings trajectory stabilises the 40-cent dividend or puts it under further pressure. With a payout ratio of approximately 87%, there is very little room between current earnings and the point where the board faces another reduction decision. That margin, or lack of it, is what should drive your positioning.
For readers who want to put BOQ’s role into a broader framework, our comprehensive walkthrough of ASX income portfolio construction covers how to size satellite holdings across at least three sector buckets, prioritise earnings coverage over headline yield, and build a resilient dividend structure that holds up across cycles.
This article is for informational purposes only and should not be considered financial advice. Investors should conduct their own research and consult with financial professionals before making investment decisions. Past performance does not guarantee future results.
Bank of Queensland pays a trailing dividend of 40 cents per share, producing a fully franked yield of approximately 6.39% at a share price of around $6.24-$6.26, which is more than double Commonwealth Bank's yield of 3.06%.
BOQ's elevated yield is primarily driven by a depressed share price, not exceptional dividend capacity. The market has discounted the stock to reflect structural disadvantages including scale constraints, higher funding costs, and a weaker profitability profile relative to CBA, ANZ, NAB, and Westpac.
Yes. BOQ reduced its full-year dividend from 65 cents per share in 2019 to 40 cents per share currently, a cut of approximately 38%. With a payout ratio of around 87%, there is limited earnings buffer protecting against a further reduction.
An 87% payout ratio means BOQ is distributing nearly all of its earnings as dividends, leaving very little buffer to absorb any decline in profits. A modest deterioration in earnings could push the payout ratio to unsustainable levels and force another dividend cut.
The article argues that if BOQ belongs in a portfolio at all, it should be a small satellite holding alongside core big four positions, not a primary income source. Its structural earnings ceiling, demonstrated dividend cut history, and two decades of capital erosion make a large allocation difficult to justify on the yield alone.