
Rising bond yields are supposed to be bad news for stocks. Yet JPMorgan strategists argue the surge that knocked about 3 points off forward valuation multiples for the S&P 500 and MSCI ACWI is running out of steam, and that bonds now look oversold.
That is a bold call to make while the US 10-year Treasury yield sits above 5%, at roughly 5.09-5.14% on 19 October 2026. Brent crude is trading above $100 a barrel at the same time.
The question for the rest of 2026 is whether equities can push higher into year-end. If the yield move is cyclical, the pressure on valuations may be close to done. If it is structural, the squeeze on stocks could have further to run.
Here is a clear read on what has to go right for stocks in this bond yield environment, and which risks could break the thesis before December.
Why JPMorgan thinks the yield surge has run its course
The case, led by strategist Mislav Matejka, starts with the futures market. This year’s climb in the 10-year yield tracks closely with the repricing of fed funds futures, which are contracts that show where traders expect the US Federal Reserve’s policy rate to land.
On the source of the yield rise JPMorgan’s team says the shift in fed funds futures “pretty much fully explains” this year’s increase in 10-year yields.
If expected short-term rates account for the move, the next question is whether those expectations can climb further. Matejka’s team sees no reason for markets to push their Fed rate assumptions any higher than where they stand today.
Fed rate futures remain the hinge of the thesis, yet they have a record of overshooting, and professional forecasters at several banks expect the Fed to hold rather than hike, which leaves room for the repricing to reverse.
Inflation evidence comes next. Consumer surveys and market pricing both point to subdued expectations. European core inflation sits near pre-Iran-war levels, US core is only about 0.3% above them, and wage growth looks soft.
Put those pieces together and the conclusion follows: the yield rise is losing momentum. The team flagged about two weeks ago that the move looked overextended, and JPMorgan’s fixed-income group targets year-end long yields at or below current levels.
| Institution | S&P 500 year-end target | 10-year Treasury target | Stance |
|---|---|---|---|
| JPMorgan | 7,800 | 4.70% | Yield surge nearing exhaustion (July, updated 2 October) |
| Morgan Stanley | About 7,887 (implied) | 4.05% | Lower yields by year-end (4 August) |
| Goldman Sachs | Expects another Fed hike, though further tightening may prove unnecessary |
The small gap in the yield readings reflects different sessions and sources: 5.085% in Reuters data versus 5.14% from Fed-sourced figures. Both sit well above JPMorgan’s 4.70% target, so that target fits the “flat or below” view. Much of the spread between forecasts comes down to horizon, not conviction.
What this tells you is that the bullish view is a tactical call, and it depends on short-rate expectations already being priced in. The thing to watch is whether inflation data and the Fed’s path keep that assumption intact.
When big ASX news breaks, our subscribers know first
How yields move stock valuations, and why a pause matters
The headline on screens was simple. At the height of the yield spike, forward P/E ratios dropped roughly 3 points for both MSCI ACWI and the S&P 500, while Europe lost 2 points.
Forward P/E is a share price divided by analysts’ expected earnings for the next twelve months. If a stock trades at $200 and is expected to earn $10 a share, its forward P/E is 20. If the multiple drops to 17 while earnings stay the same, the price falls to $170.
Higher yields push multiples down through three channels:
- The discount rate: future profits are worth less today when the rate used to value them rises.
- Competition from bonds: a 5% Treasury yield gives investors a real alternative to shares.
- Financing costs: companies pay more to borrow, which squeezes profits.
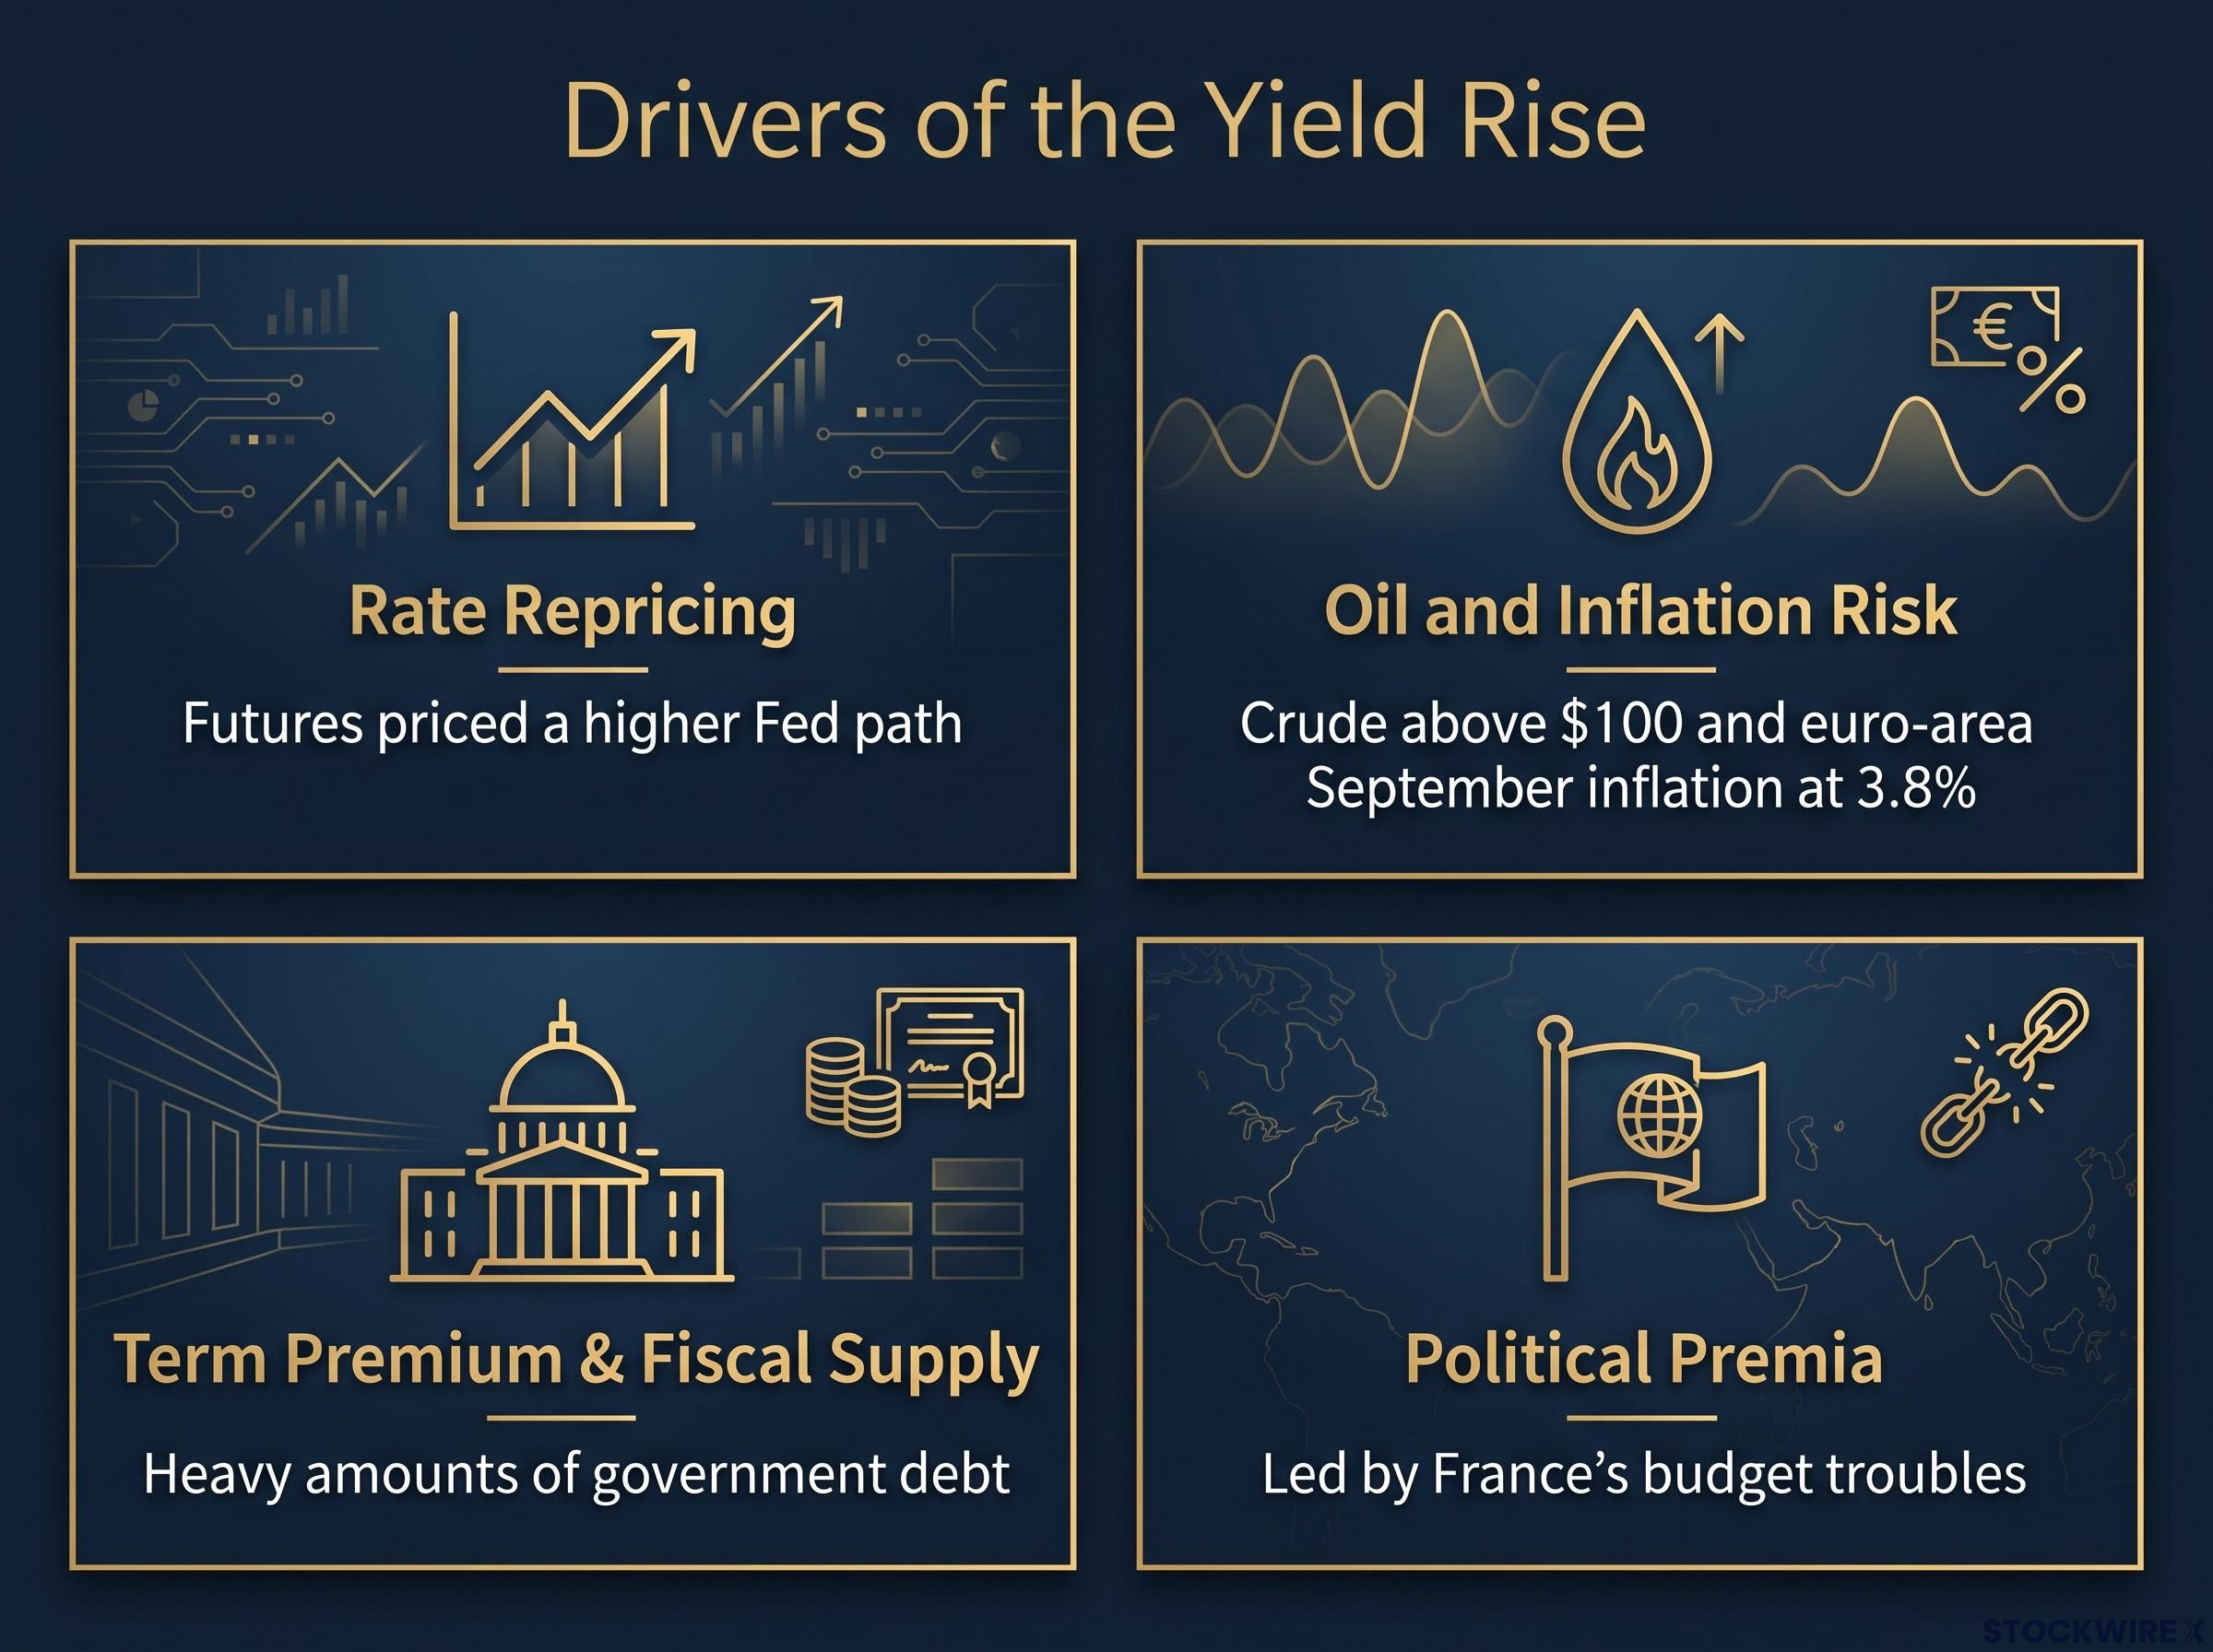
This year’s yield rise has four drivers:
- Rate repricing, as futures priced a higher Fed path.
- Oil and inflation risk, with crude above $100 and euro-area September inflation reported at 3.8%.
- Term premium and fiscal supply. Term premium is the extra return investors demand for holding long-dated bonds beyond expected short-term rates, and it rises when governments issue heavy amounts of debt.
- Political premia, led by France’s budget troubles.
Speed matters as much as direction. Gradual rises driven by growth are easier for equities to absorb than abrupt moves driven by inflation, fiscal stress or forced selling.
That is why a pause matters. You do not need yields to fall for stocks to hold up; a plateau can be enough to stop multiples compressing further.
Cyclical repricing or structural reset?
This is the central disagreement. Matejka sees a nearly complete cyclical repricing. The BlackRock Investment Institute and S&P Global point to persistent deficits, heavy supply and AI financing as signs that a longer-lasting reset in risk premiums may be under way.
The structural camp argues that a rebuilt term premium, fed by heavy sovereign issuance and quantitative tightening, is lifting yields in the US, Japan and the UK at once, which is hard to square with a purely cyclical rate story.
AI funding and France: are the two big risks overstated?
JPMorgan addresses both head-on. On AI, the bank argues debt issuance is unlikely to displace demand for government bonds, and that hyperscaler free cash flow may beat forecasts. Hyperscalers are the largest cloud and AI infrastructure providers.
AI debt and crowding out
The scale behind that reassurance is large. S&P Global, via Reuters on 19 October, puts projected AI and data-centre capex by six major US hyperscalers at more than $7 trillion over 2025-30.
S&P Global also warns that hyperscalers may run negative free cash flow at least through next year. Guarantees and interconnected financing could hide the true size of liabilities. BlackRock adds that government borrowing and AI investment are lifting financing costs at the same time.
S&P’s warning about hidden liabilities has substance: hyperscalers carry off-balance sheet obligations that run several times their reported debt, and they will migrate onto balance sheets as data centres open.
France and the contagion question
France’s 10-year OAT traded at 4.758% against a German Bund at 3.445% on 6 October, a spread of 131 basis points. That widened to about 137 bp on 7 October.
JPMorgan cautions against bracing for contagion, pointing to the ECB’s toolkit, banks in better shape than during the 2010-12 crisis, and far fewer defaults. Jim Caron of Morgan Stanley calls the stress serious but localised.
The counterpoint is the feedback loop. Higher yields raise debt-service costs, which widen deficits, which can push yields higher again.
| Risk | JPMorgan view | Counter-view | What to watch |
|---|---|---|---|
| AI debt | Won’t crowd out sovereign demand; cash flow may surprise positively | S&P Global: hidden liabilities, possible negative free cash flow | Hyperscaler free cash flow in results |
| France | Localised, with ECB backstops | Self-reinforcing fiscal dynamics | French-German spread vs 131-137 bp |
Both risks are measurable. AI funding stress will surface in hyperscaler cash flow reports and French stress in the spread, so you can track them rather than simply worry about them. On the evidence, France looks better contained; the AI funding question carries more uncertainty.
Q3 earnings and oil: the test of the yield-peak thesis
If yields are the headwind, earnings are the tailwind. FactSet puts S&P 500 Q3 blended growth at 29.0% year on year as of 16 October. Blended growth combines reported results with estimates for companies yet to report.
Early reporting has been strong. Of the 19 S&P 500 companies that reported through 9 October, 84% beat earnings estimates. JPMorgan’s sample of 29 US and 14 European companies showed mostly beat-and-raise results, meaning they topped estimates and lifted guidance.
| Region | Q3 growth by source | Beat rate | Sample notes |
|---|---|---|---|
| US (S&P 500) | 29.0% (FactSet); about 24% (JPMorgan) | 84% of 19 companies | JPMorgan sample: 29 companies, mostly beat-and-raise |
| Europe (STOXX 600) | 20.7% (LSEG); about 19% (JPMorgan) | JPMorgan sample: 14 companies, mostly beat-and-raise |
The gap between sources partly reflects treatment of a one-off Meta tax charge. Either way, profits are growing fast enough to cushion a steady yield.
Oil is where the confidence starts to wobble. Brent traded around $108-109.48 and WTI around $98.45-100.88 on 19 October, and Reuters noted an oil jump was already offsetting a pullback in yields.
A sustained oil shock would hit the thesis through several channels:
- Higher inflation expectations
- A delayed easing timeline from the Fed and ECB
- A rising term premium
- Weaker household income and spending power
That runs directly against JPMorgan’s contained-inflation assumption. Treat earnings as the support and oil as the swing factor: strong profits can offset a flat yield, but not a renewed inflation shock.
What has to hold for equities to advance into year-end
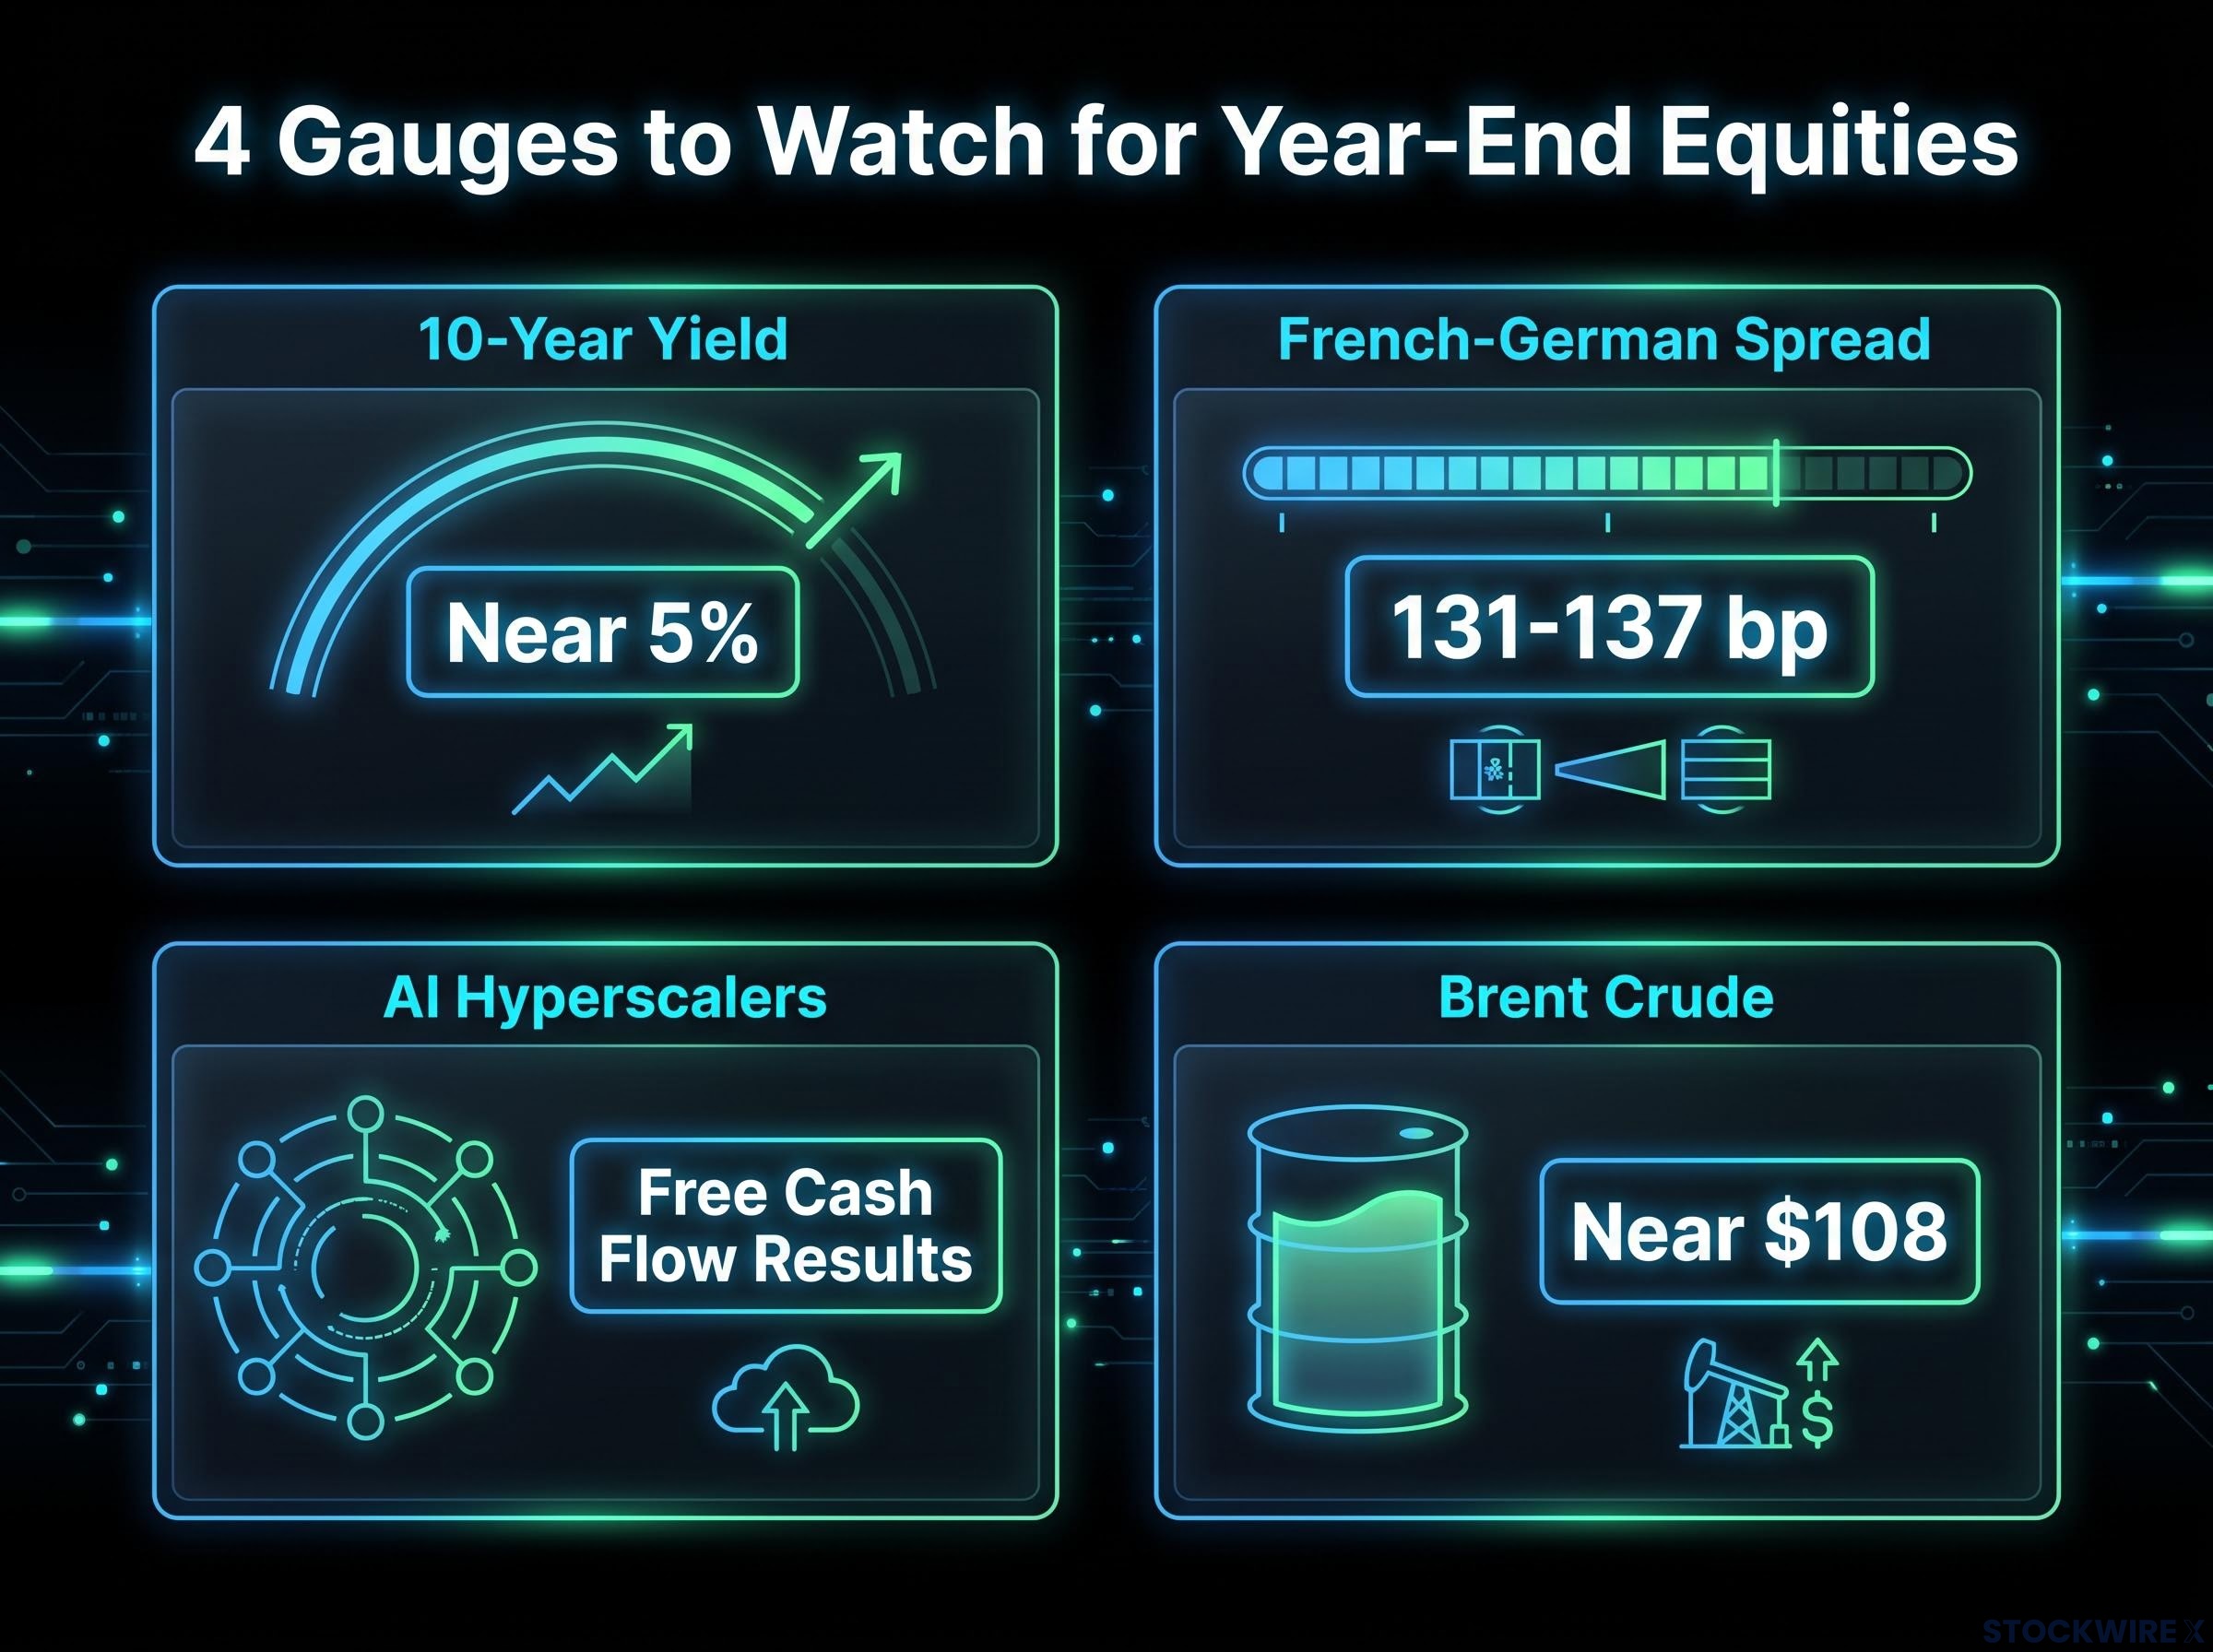
The bullish case rests on four conditions holding together: yields stay flat or lower, inflation expectations stay contained, earnings revisions hold up, and oil does not escalate.
Each has a gauge you can watch. Track the 10-year yield against the 5% area, the French-German spread against 131-137 bp, hyperscaler free cash flow as results arrive, and Brent near $108.
The debate between cyclical repricing and structural reset remains unresolved. JPMorgan’s view is best treated as a conditional base case rather than a certainty. If the gauges hold, stocks have room to climb; if oil or spreads break higher, the case weakens fast.
Past performance does not guarantee future results. Financial projections are subject to market conditions and various risk factors. These statements are speculative and subject to change based on market developments and company performance.
This article is for informational purposes only and should not be considered financial advice. Investors should conduct their own research and consult with financial professionals before making investment decisions.
—