Dan Loeb’s Third Point recently described Nvidia, trading at approximately $4-5 trillion in market capitalisation, as undervalued. For most investors, the instinct runs the other way: a stock at that price must be due for a correction. That instinct, and the repeated history of investors who acted on it too early, sits at the centre of one of investing’s most consequential and consistently mishandled decisions. The hold-versus-sell question for outsized winners affects hedge fund allocators, venture capitalists, and long-term retail investors sitting on concentrated positions alike. What follows uses the current Nvidia debate as a live case study to build a durable analytical framework around when to hold, when to sell, and how to tell the difference, drawing on named investor frameworks, real venture-capital exit postmortems, and the behavioural research that explains why investors default to the wrong answer.
Why investors keep assuming large-cap stocks have peaked
The pattern is older than most portfolios. At various points over the past two decades, serious investors treated specific market-cap thresholds as practical ceilings, levels beyond which a single company simply could not sustain its valuation. Each threshold proved wrong.
- $100 billion was once treated as a natural limit for technology companies, a level that Google and Amazon both exceeded while widely held as short positions by hedge funds convinced they had peaked
- $400 billion became the next perceived boundary, which Meta reached within a decade of an IPO that valued it at $50 billion in 2012, following a trough near $18 billion
- $1 trillion was expected to be an even harder ceiling, yet multiple companies crossed it with earnings momentum intact
- $4-5 trillion is the current frontier, where Nvidia sits today, and where the same ceiling-assumption error is being tested in real time
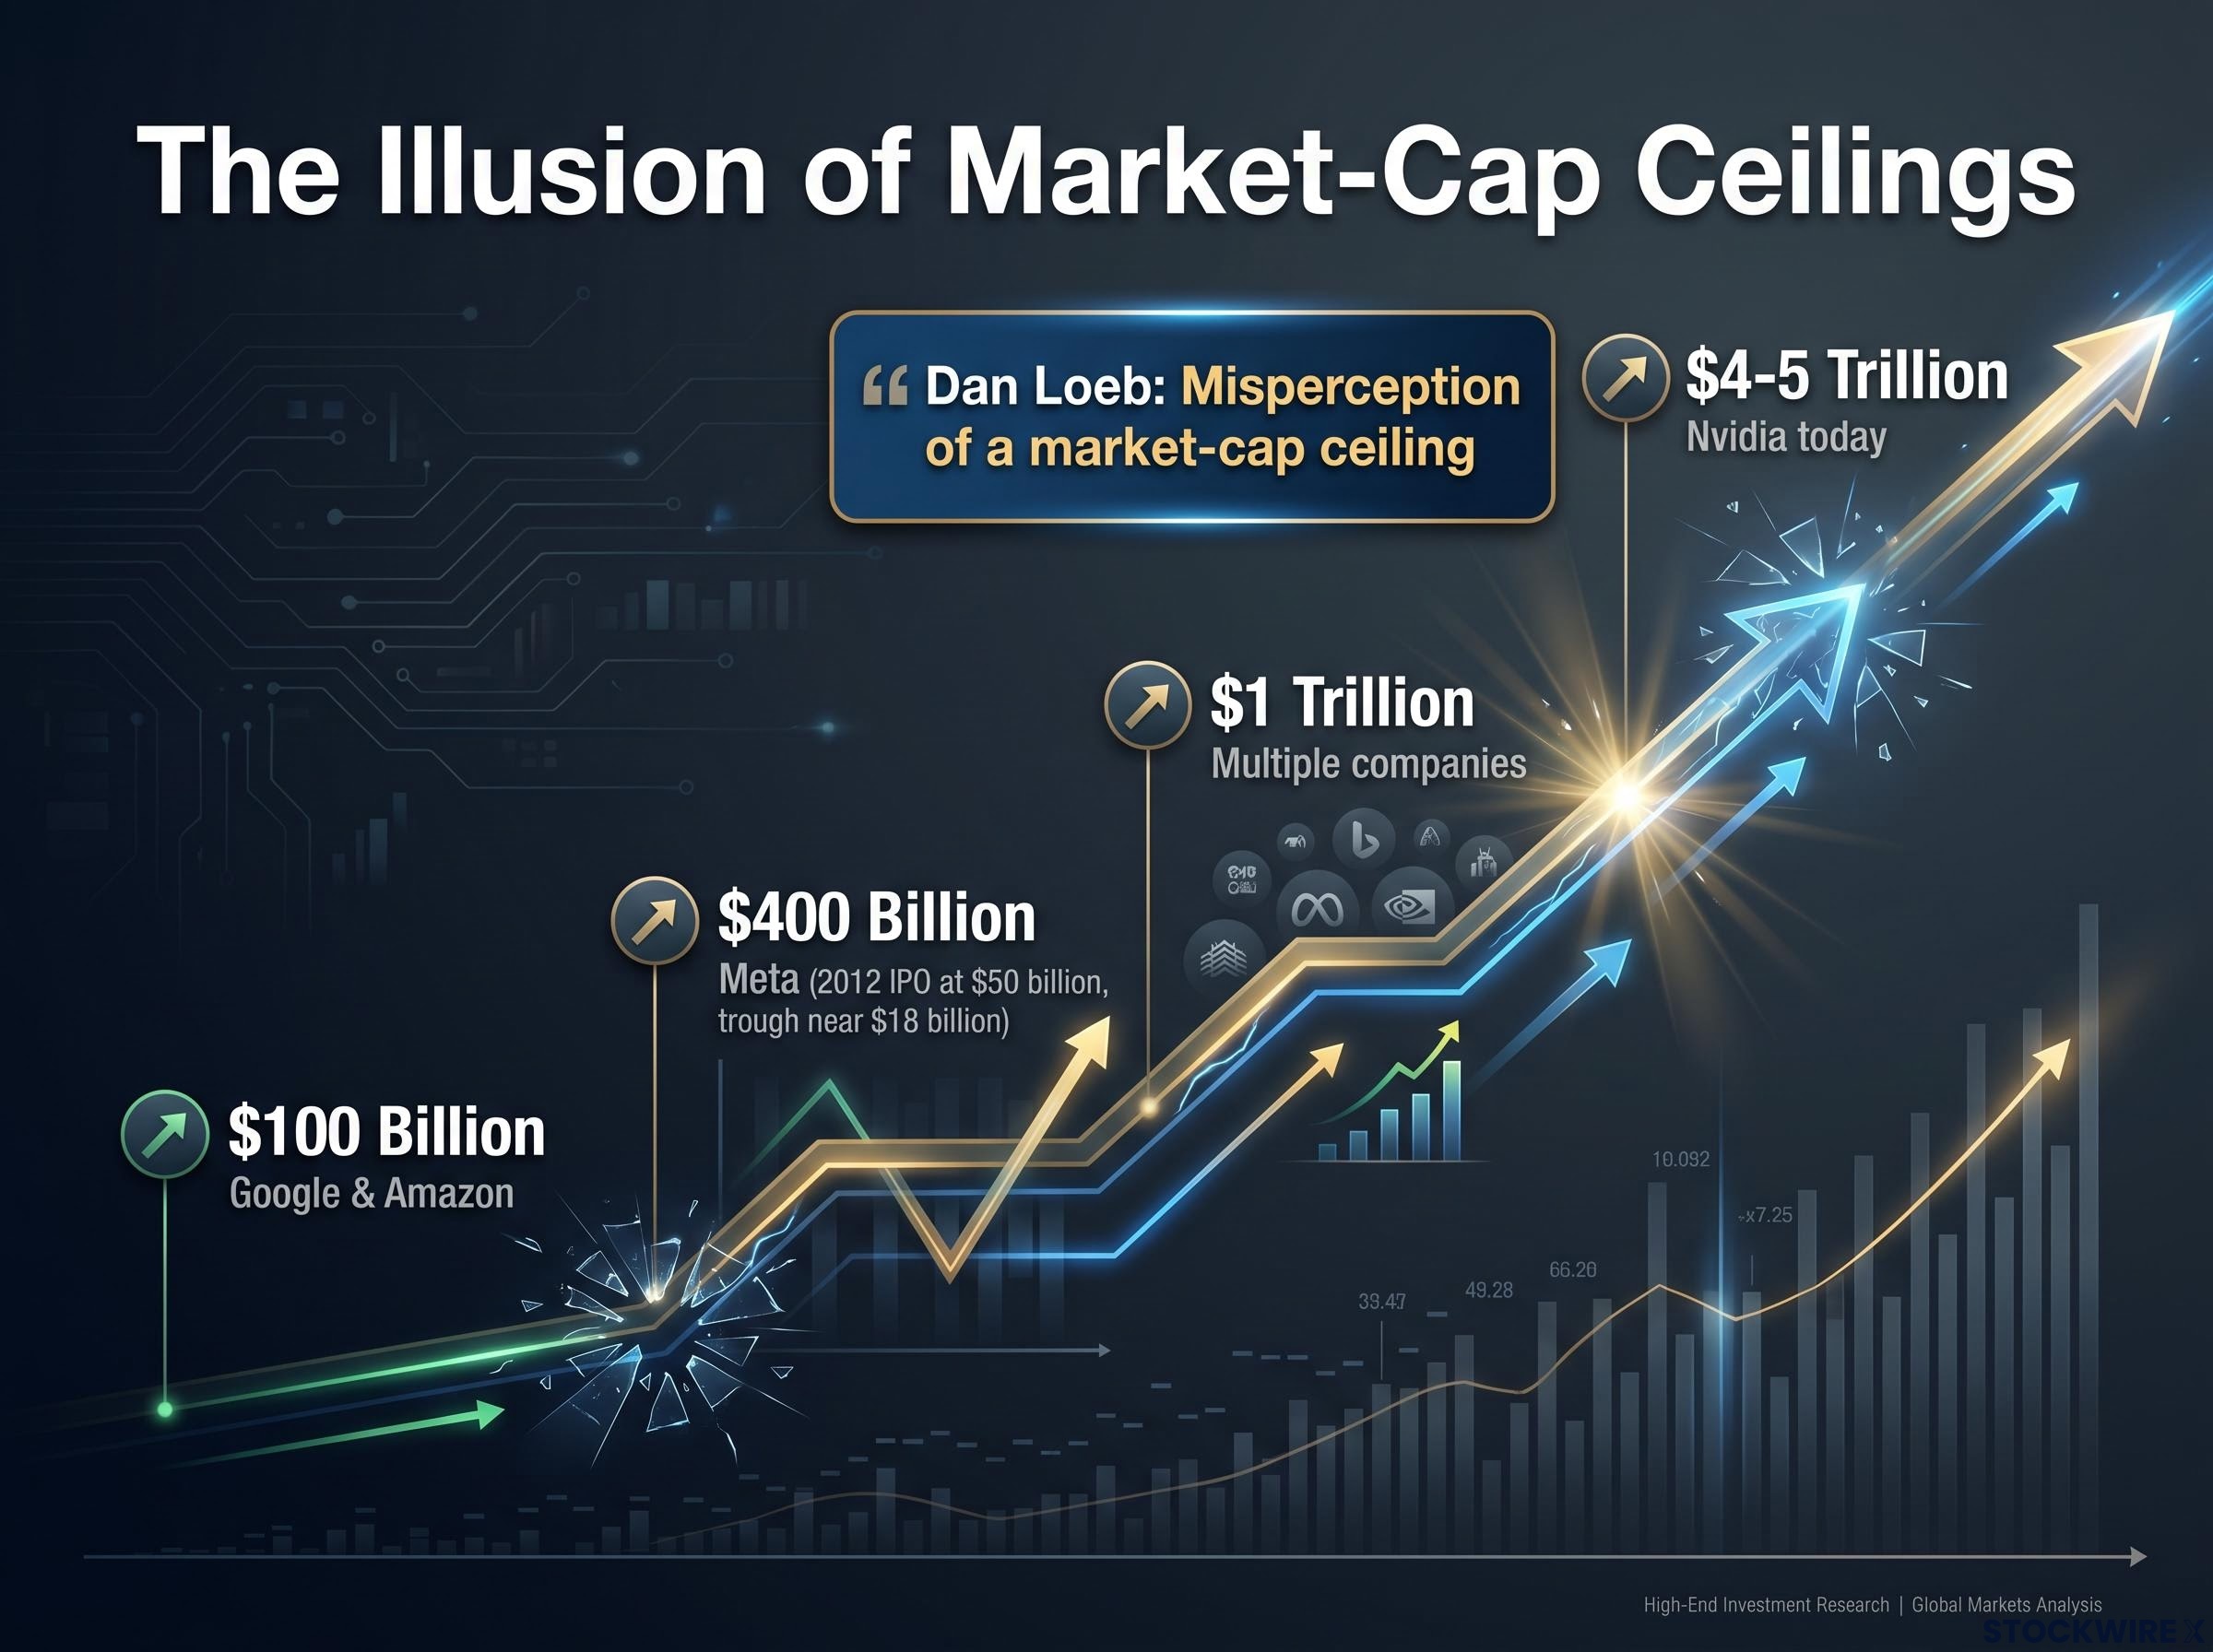
Meta’s arc is the clearest single illustration. An IPO at $50 billion, a collapse to roughly $18 billion, and a climb toward approximately $400 billion within its first decade as a public company. Investors who sold at any of the intermediate “ceilings” left compounding on the table.
Third Point’s Dan Loeb has framed this as the “misperception of a market-cap ceiling” in mega-cap technology, arguing that investors repeatedly underestimate how high the absolute dollar value of dominant platforms can rise when supported by sustained earnings growth and strategic moats.
Hedge fund mechanics compound the error. Nvidia is commonly used as a short position by long/short funds that need to be short something of comparable scale. That means a portion of the short interest reflects operational necessity rather than genuine bearish conviction, a distinction the headline short-interest figures do not make on their own.
When big ASX news breaks, our subscribers know first
What the Nvidia bull case actually rests on
The bull case for Nvidia at $4-5 trillion is not a bet on the share price climbing higher. It is an earnings-power argument, and the distinction matters.
Over the prior 12-18 months, Nvidia’s forward price-to-earnings ratio (the share price divided by expected future earnings per share) has compressed even as the stock price rose. Earnings estimates moved up faster than the price. Some sell-side analysts project data-centre revenue to more than double over the next two to three years, supporting compound earnings-per-share growth in the 30-40% annual range. On those estimates, the forward P/E sits at roughly 30-40x on a 12-24 month basis, broadly in line with other mega-cap AI leaders.
Nvidia’s Q1 FY2027 results confirmed the earnings trajectory that underpins the bull case: $81.61 billion in revenue, data centre revenue of $75.2 billion growing 92% year on year, and a $91 billion Q2 guide that assumes zero contribution from Chinese data centre sales, converting the headline beat into an asymmetric optionality position if export restrictions ease.
Loeb’s framing is that Nvidia remains undervalued relative to its projected earnings over the next two to three years, with its dominant market position expected to be more fully recognised by the market over time. The stock appears expensive only if the investor anchors to the absolute dollar value of the market cap rather than the trajectory of the earnings underneath it.
| Factor | Bull case view | Bear case view |
|---|---|---|
| Forward P/E | Compressed to 30-40x as earnings rose faster than price | Still rich versus broad market; vulnerable to multiple compression |
| Data-centre revenue | Projected to more than double over 2-3 years | Front-loaded AI capex may slow once build-out peaks |
| Competitive moat | CUDA ecosystem and software lock-in sustain pricing power | AMD MI-series, Google TPU, Amazon Trainium erode share over time |
| Historical analog | More akin to early Amazon or Google than late-cycle excess | Cisco 1999-2000: dominant company, decade of flat returns |
The bear case and why it demands tracking, not reflexive selling
The Cisco comparison is the most intellectually serious bear argument. In 1999-2000, Cisco was a dominant networking company priced for perpetual high growth. It remained a solid business for years afterwards, yet investors who bought at the peak waited more than a decade for positive returns. The parallel is not trivial.
Nor are the competitive threats. AMD’s MI-series accelerators have gained traction in certain cloud accounts. Hyperscalers including Google, Amazon, Microsoft, and Meta are investing heavily in custom silicon to reduce dependence on Nvidia. U.S. export controls limit access to the Chinese AI market. Each of these is a legitimate thesis-check input, a condition to monitor as part of a disciplined hold process, not an automatic sell trigger.
The psychology that makes selling winners feel right when it is wrong
Four documented psychological and structural biases explain why the sell impulse fires most strongly at precisely the moments when holding would generate the highest returns.
- Disposition effect: Research by Terrance Odean and Brad Barber confirmed the empirical tendency for investors to sell winning positions and hold losing ones. The impulse to “lock in” gains is measurable across both retail and some institutional portfolios.
- Anchoring and reference-point bias: A stock trading at 40x forward earnings feels expensive relative to its own history, even when the underlying earnings power has structurally changed. The anchor is the old multiple, not the new earnings trajectory.
- Career risk and tracking-error pressure: Institutional managers face quarterly performance comparisons. A large winning position that corrects sharply can damage a career. The rational career response is to trim before the correction, regardless of whether the long-term thesis supports holding.
- Window-dressing: Selling volatile technology winners near quarter-end to avoid appearing reckless in portfolio reports produces selling pressure that is entirely disconnected from investment merit.
Morningstar’s ‘Mind the Gap’ research quantifies what loss aversion bias costs in practice: a consistent behavioural return shortfall of roughly 1-2 percentage points per year, driven almost entirely by investors selling near market lows and re-entering after prices have already recovered.
Charlie Munger’s observation that “the big money is in the waiting” captures the asymmetry. The compounding gains from holding a high-quality winner through volatility typically dwarf the risk-reduction benefit of trimming early.
Terry Smith of Fundsmith has articulated three specific selling errors that recur across portfolios: anchoring to the purchase price, discomfort with large position sizes, and institutional pressure to demonstrate activity. Nick Sleep of the Nomad Partnership acknowledged explicitly that frequent trimming of Amazon and Costco would have destroyed the fund’s compounding. The pattern is consistent across decades, strategies, and market environments.
A practical framework for the hold-versus-sell decision
Diagnosis without prescription leaves the investor no better off. The frameworks below translate the behavioural and structural insights into pre-committable rules.
Three sell triggers, derived from the Buffett and Munger framework, form the foundation:
- Moat erosion: The competitive advantage that justified the original investment has clearly deteriorated, not merely been challenged, but structurally weakened.
- Management failure: Behaviour by leadership has become unacceptable, whether through capital misallocation, governance failures, or strategic misdirection.
- Superior opportunity: A clearly better risk-adjusted opportunity exists, with meaningful expected incremental return, not merely a marginally cheaper alternative.
Market-cap size is explicitly excluded as a sell trigger. The historical record of ceiling-assumption errors supports this exclusion directly.
How retail and individual investors can apply institutional-grade discipline
The pre-committed tranche approach offers the most practical retail-accessible mechanism. A core position is designated as untouchable unless the thesis breaks. A smaller tactical sleeve allows for adjustments based on valuation or risk-management needs. Separating the two in advance prevents the emotional impulse from overriding the analytical framework in real time.
Pre-committed exit rules, with documented conditions for thesis-break, upside thresholds, and catalyst-completion triggers set at the time of purchase, are the mechanism that top fund managers use to prevent emotional override at precisely the moments when the urge to sell is strongest.
Institutional and fund-level adaptations that reduce structural selling pressure include:
- Evergreen or open-ended vehicles that avoid hard fund-life deadlines, removing the forced distribution clock
- Continuation funds and side-pockets that buy out ageing positions from older funds, giving managers more time in public winners
- Crossover structures such as Altimeter Capital’s model, where Brad Gerstner has explicitly structured the firm to own companies from late private through long public lifetimes, critiquing conventional “distribute at IPO” approaches
- Longer-duration vehicles adopted by firms including a16z and liquid hedge-fund-style structures used by Tiger Global and Coatue alongside their private funds
An explicit written investment thesis with defined thesis-break conditions serves the same governance function for an individual investor as a formal CIO-level committee review serves for an institution. Cliff Asness and AQR researchers have argued for capping position sizes by risk contribution rather than simple portfolio weight, and rebalancing only on large deviations, to avoid the constant trimming of winners that erodes compounding.
This article is for informational purposes only and should not be considered financial advice. Investors should conduct their own research and consult with financial professionals before making investment decisions.
The high cost of exiting winners prematurely
The abstract principle that selling winners too early destroys returns becomes concrete when the dollar figures are attached.
| Company | Exit price/range | Subsequent price or value | Mechanism of early exit |
|---|---|---|---|
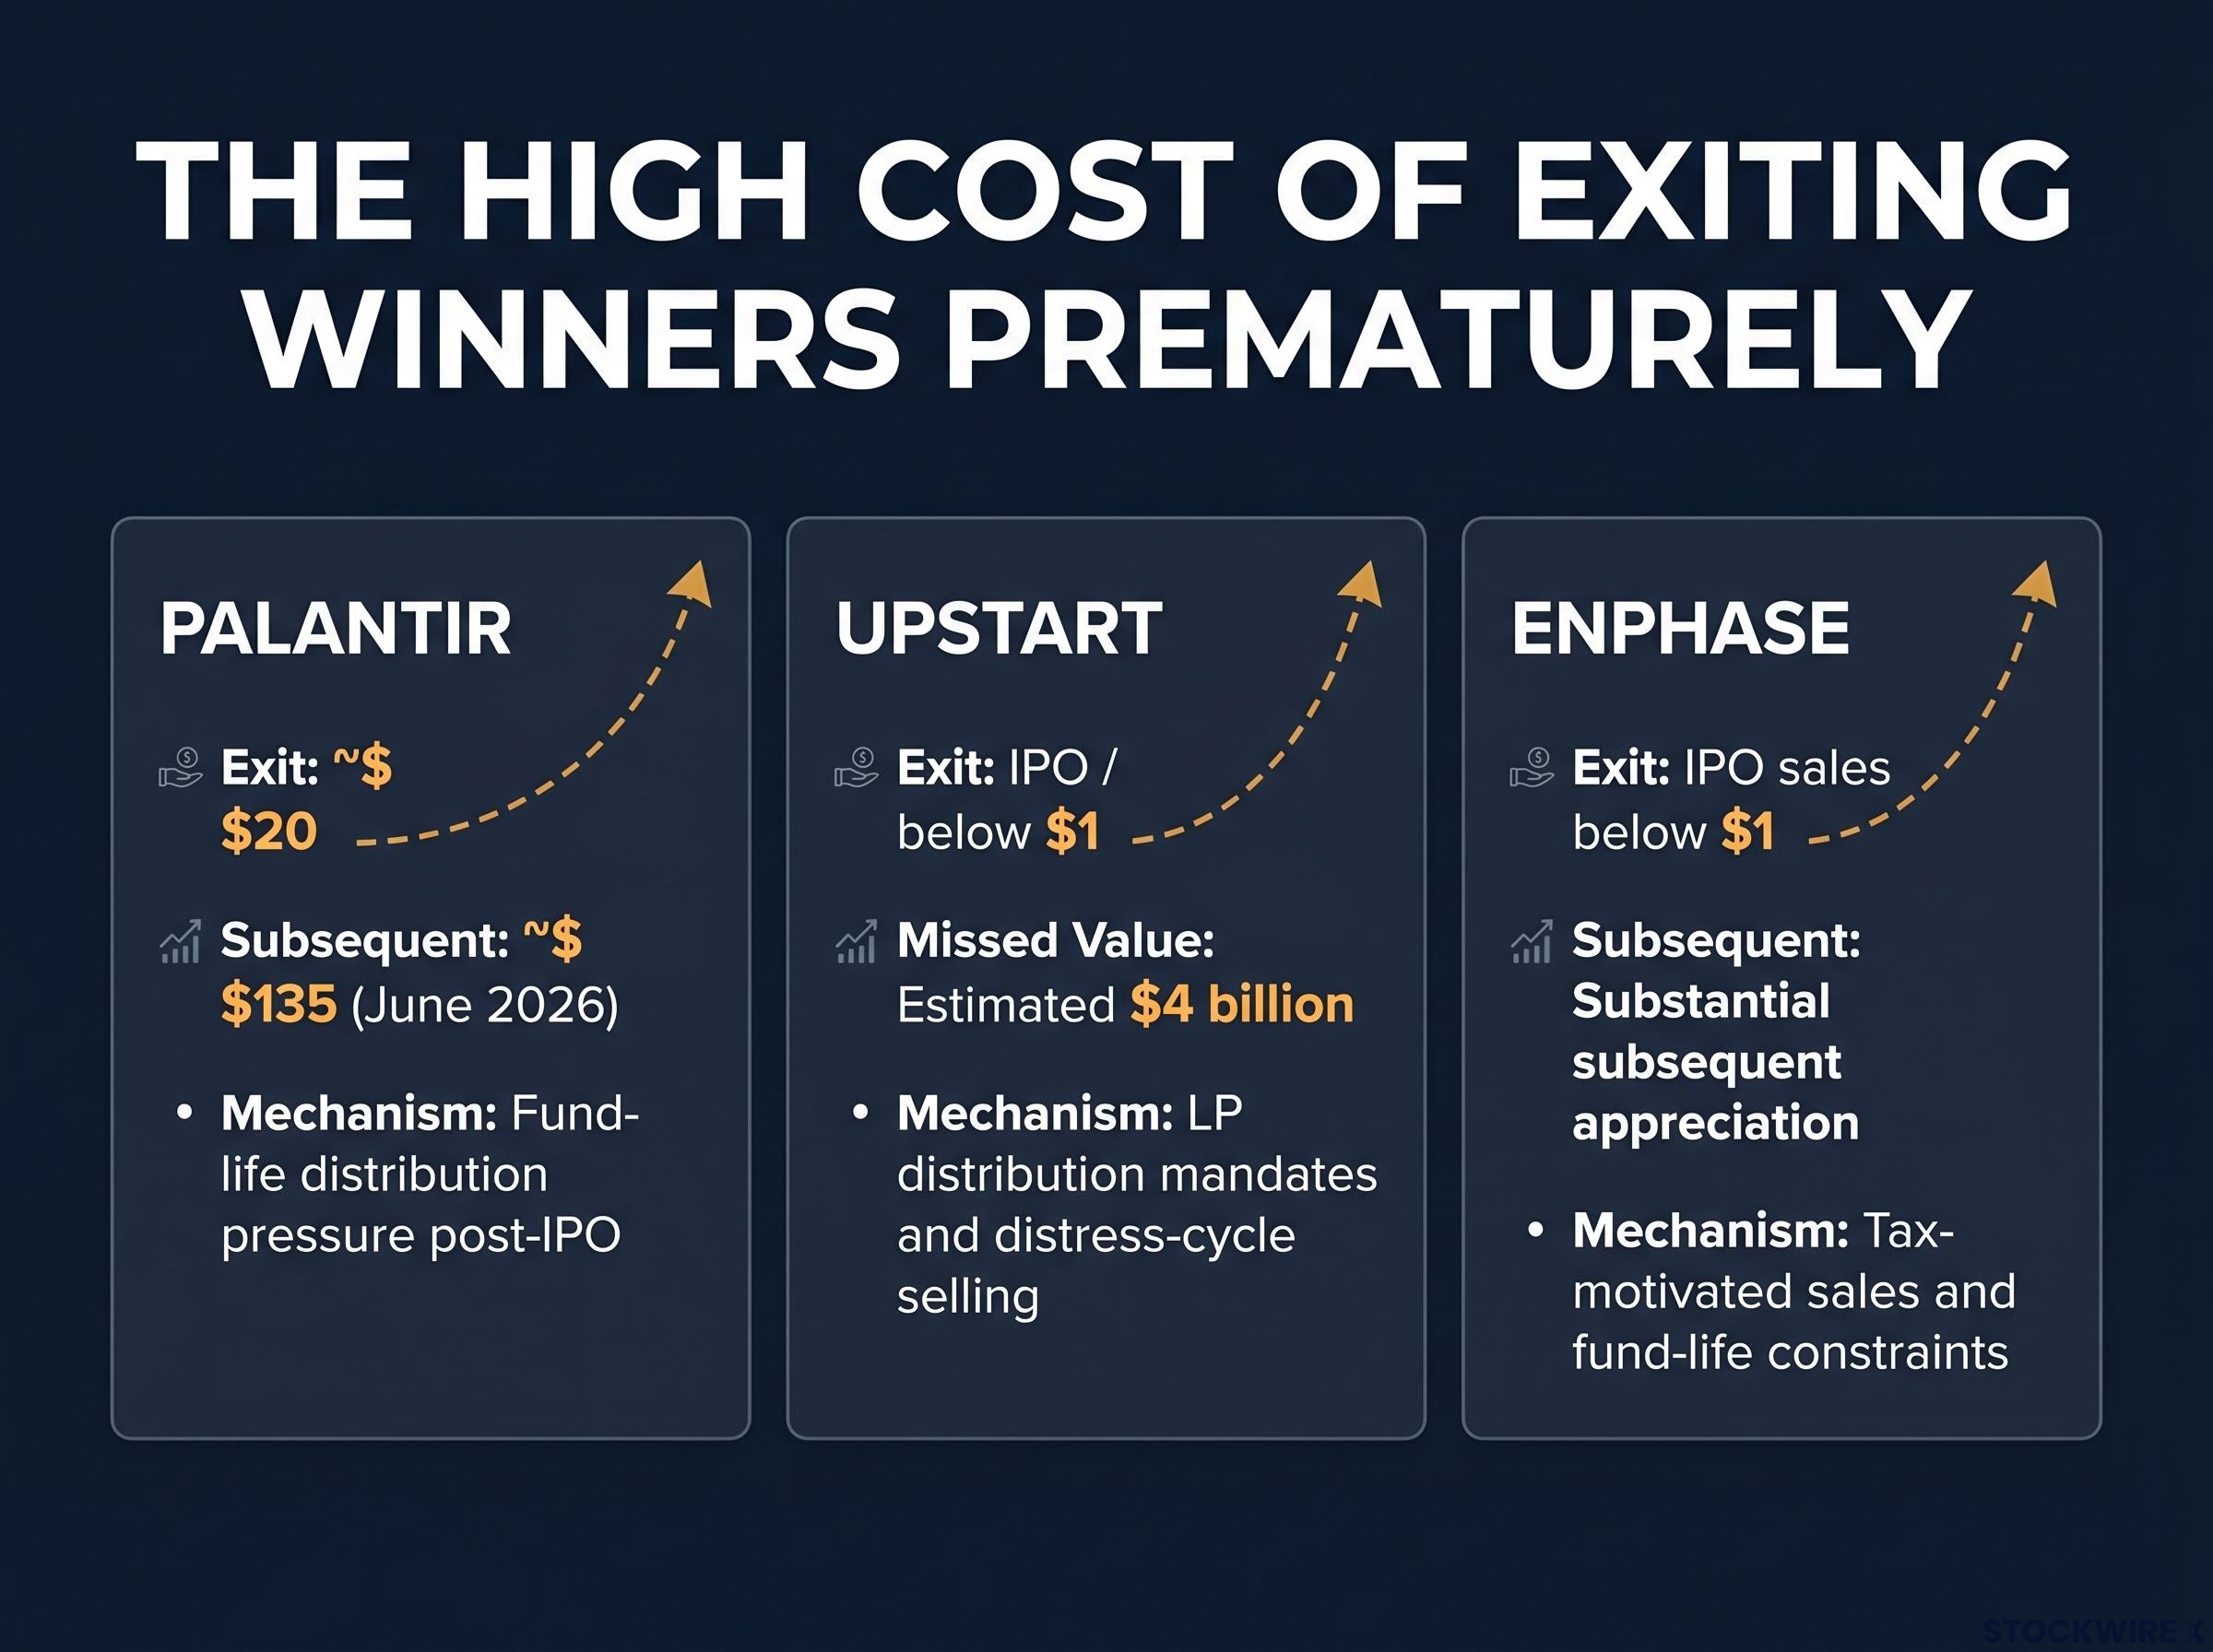
| Palantir | Approximately $20 | Approximately $135 (June 2026) | Fund-life distribution pressure post-IPO |
| Upstart | IPO exit; additional sales reportedly below $1 | Estimated $4 billion in missed value | LP distribution mandates and distress-cycle selling |
| Enphase | IPO sales below $1 | Substantial subsequent appreciation | Tax-motivated sales and fund-life constraints |
The Palantir case is the clearest missed-compounder story. One firm sold near $20 and watched the stock climb to approximately $135, an 8-10x return left on the table. The Upstart case represents a different failure mode: a Series B investor that sold at IPO and again reportedly below $1 per share during a distress cycle, potentially missing approximately $4 billion in value.
The estimated $4 billion in missed value from the Upstart position illustrates how structural selling pressure, driven by fund-life clocks and LP distribution mandates, can overwhelm long-term conviction at precisely the wrong moment.
Enphase followed a similar arc: early IPO sales below $1 preceding substantial appreciation. In at least one case, the experience of board membership restricting liquidity led an investor to adopt a policy of no longer joining boards, a structural reform born from a specific, costly mistake.
These are not hypothetical scenarios. They are documented postmortems from named firms, and the mechanism that caused them remains present in most venture and growth investment vehicles today.
Seasonal timing strategies produce the same structural failure mode in a different form: investors who exited on the Sell in May signal in 2025 missed a 23.6% full-window return, and those who followed the same rule in May 2026 missed a 5.3% single-month gain, with both windows opening immediately after market dislocations when recovery potential was at its highest.
The real lesson Nvidia’s valuation debate is teaching investors right now
Return to the Nvidia question with the full framework in hand, and the debate changes shape. The right question is not “will Nvidia go higher?” That is a prediction, and predictions about individual stock prices are unreliable regardless of who makes them. The right question is: has the thesis broken, and does a clearly superior opportunity exist?
The investors who compounded the most through Meta’s 2022 drawdown shared specific characteristics. ValueAct and Capital Group held or increased positions, framing it as a mispriced moat asset. Their structural edge was not better forecasting; it was mandates that tolerated tracking error and stable capital bases that did not force redemptions. During Nvidia’s own 2022-2023 correction, investors including T. Rowe Price and Fidelity technology funds maintained or rebuilt positions into the trough, explicitly citing long-term AI conviction.
The synthesis across every case study examined is consistent: focus on multi-year earnings power and moat durability, not market-cap absolutes. Pre-define thesis-break conditions. Recognise that structural selling pressure is the primary mechanism of premature exits.
Across Palantir, Upstart, Enphase, Meta, and now the Nvidia debate, the structurally dominant mistake has been selling too early, not holding too long. The bear case for Nvidia, including AI capex cyclicality, hyperscaler custom silicon, and the Cisco analog, is legitimate and warrants ongoing monitoring. It is a thesis-check input. It is not, on its own, a sell trigger.
The investors who captured the full payoff from the great compounders of the past two decades were not better forecasters. They were better architects of rules, structures, and mandates that prevented them from acting on the wrong instinct at the wrong time.
Past performance does not guarantee future results. Financial projections are subject to market conditions and various risk factors.
—