
SIA Engineering just reported an 8.6% revenue drop and a 6.1% fall in net profit, and its operating profit jumped 159% in the same quarter. Both statements are true. Understanding why they are not contradictory is the difference between reading this earnings release correctly and reacting to the wrong number.
The Q1 FY27 results, released 31 July 2026, show a surface-level earnings dip driven almost entirely by lower pass-through materials work and a deliberate investment cycle at the SAESL engine MRO joint venture. Neither factor reflects a deterioration in SIAEC’s core franchise. Phillip Securities Research has maintained its BUY rating and S$4.06 target price. DBS holds at S$4.00 with a HOLD call, citing valuation rather than business quality.
Here is what actually matters in this quarter: which headline number to trust, what the SAESL capex cycle means for the next two to three quarters, and how to hold the PSR and DBS positions simultaneously to build a more complete risk-reward picture than either house offers alone.
Why the headline revenue number is the wrong place to start
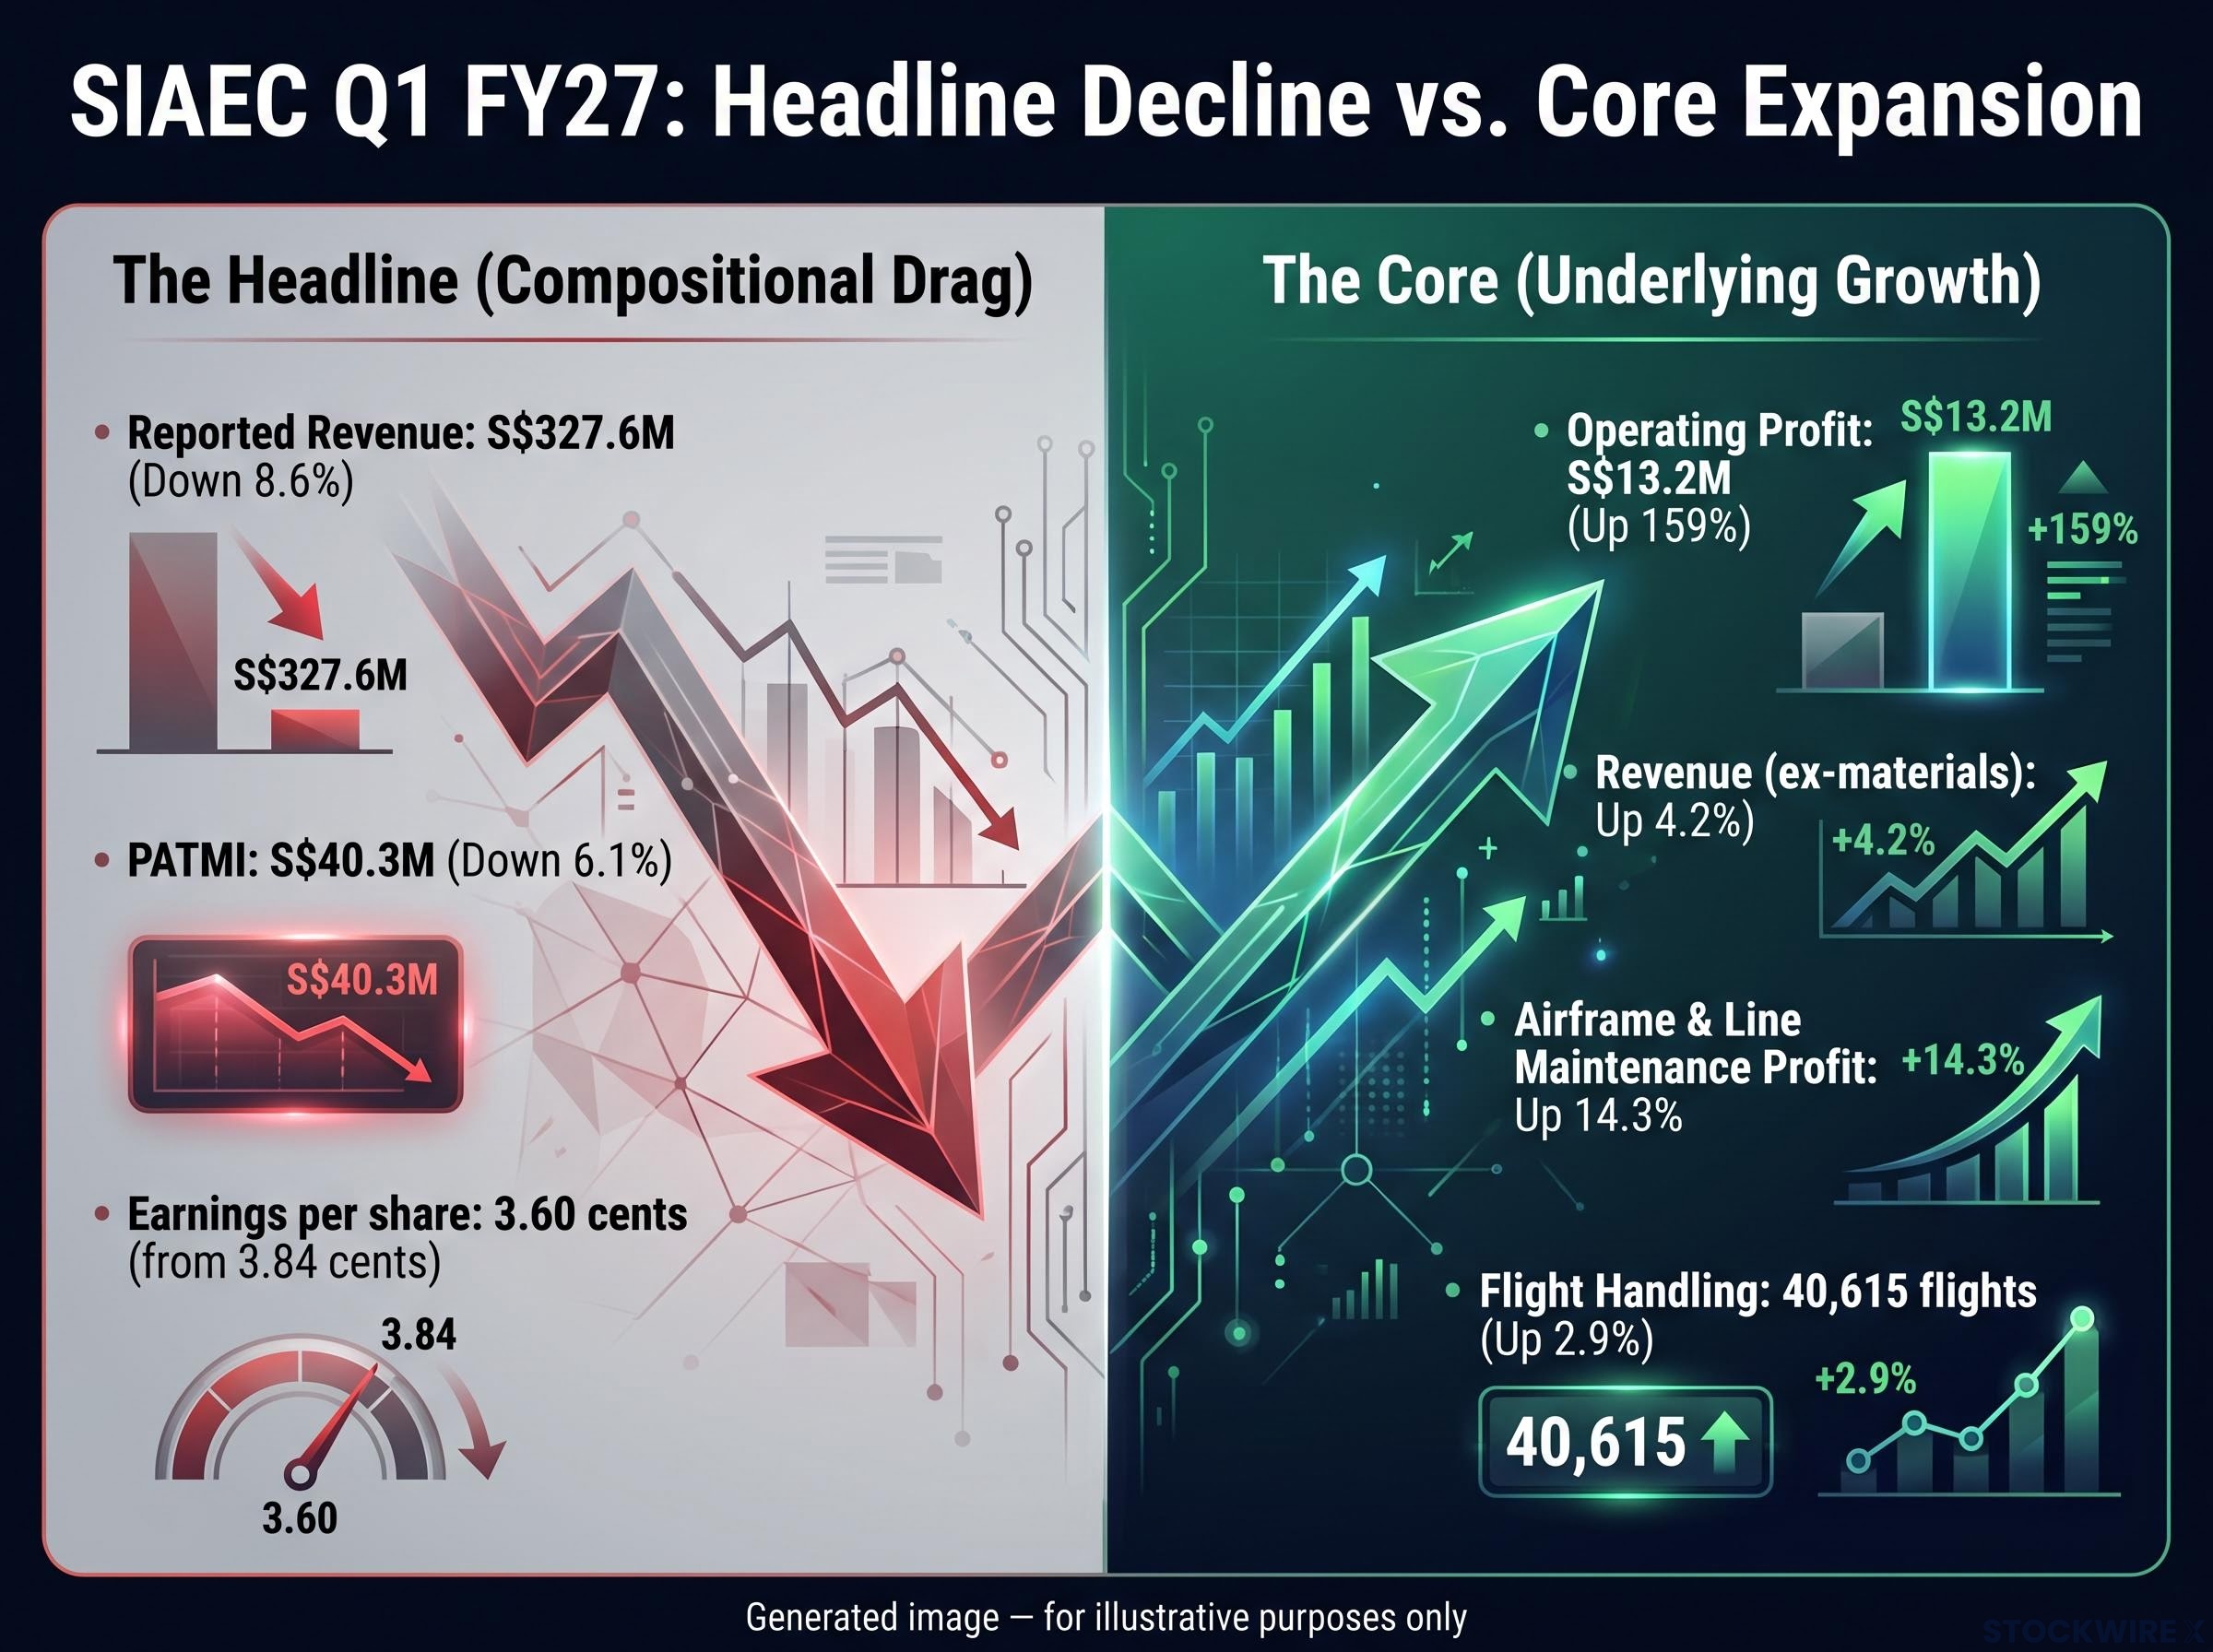
The 8.6% total revenue decline, from S$358.4 million to S$327.6 million, looks like contraction. It is not. The drop is almost entirely attributable to a reduced volume of materials-intensive pass-through work. Materials procurement is a billing mechanism: SIAEC sources parts and components on behalf of customers at low margin. When that work is lighter, reported revenue shrinks, but the quality of each remaining dollar of revenue improves.
Strip out materials, and a different picture emerges:
The gap between reported and ex-materials revenue is a textbook case of why earnings report analysis rewards investors who look past headline figures: when a billing mechanism like materials procurement inflates the revenue base in one period and contracts the next, reported growth rates become a poor proxy for underlying business momentum.
- Total revenue (reported): S$327.6 million, down 8.6% year-on-year
- Revenue (ex-materials): up 4.2% year-on-year
- Operating profit: S$13.2 million, up 159% from S$5.1 million
The number that matters: Group operating profit reached S$13.2 million, a 159% year-on-year improvement, the clearest signal that SIAEC is earning more per dollar of work it performs.
Group expenditure fell 11.0% to S$314.4 million, driven by lower material costs and reduced outsourced repair spending. The quarter saw 20 heavy maintenance checks completed, a 13% decline on the prior year, while the managed component fleet contracted 9% to 151 aircraft. Both figures explain why materials volumes dropped; they do not signal a loss of competitive position.
| Metric | Q1 FY26 | Q1 FY27 |
|---|---|---|
| Revenue (reported) | S$358.4M | S$327.6M |
| Revenue (ex-materials) | — | Up 4.2% YoY |
| Operating Profit | S$5.1M | S$13.2M |
The revenue mix shift is working in the company’s favour, not against it. Investors who anchor on the headline decline risk misreading the direction of operational improvement entirely.
When big ASX news breaks, our subscribers know first
The SAESL drag explained: investment cycle or structural problem?
A significant share of SIAEC’s group earnings flows not through its own income statement but through associates and joint ventures. That means capital spending decisions made at the JV level, even when they build future capacity, can depress reported group profit today.
In Q1 FY27, this is exactly what happened:
- Share of profits from associates and JVs: S$31.0 million, representing an 18.0% year-on-year reduction
- Engine and component segment JV contribution: approximately S$7 million lower year-on-year, a 19.2% decline
The primary source of weakness is SAESL, SIAEC’s major engine maintenance, repair, and overhaul joint venture. SAESL is spending on tooling, equipment, and facilities to expand throughput capacity. That spending reduces current-period JV earnings while building revenue capacity for future periods.
The result at the group level: PATMI (profit after tax and minority interests) totalled S$40.3 million, a 6.1% decrease against the prior-year quarter. Earnings per share fell to 3.60 cents from 3.84 cents.
Investment costs versus demand weakness: how to tell the difference
These two scenarios look different in the data. If the engine MRO market were weakening because airlines were deferring checks and flight volumes were falling, you would expect revenue per aircraft to decline alongside JV profits. That is a demand problem.
What the Q1 data actually shows is something else. Flight volumes rose 2.9%. Operating performance at the SIAEC level improved materially. JV profits declined because of named capex at SAESL, not because fewer engines needed work. That is an investment-cycle pattern.
Phillip Securities Research forecasts that SAESL’s capex burden will reach its highest point within FY26/27. If that assessment is correct, the next one to two quarters represent the deepest point of the JV earnings headwind. Investors buying now absorb the worst of the drag before the recovery accrues.
Capex cycles and earnings recovery follow a consistent pattern across industrials and infrastructure businesses: the period of maximum investment drag typically precedes the inflection in free cash flow by two to four quarters, which is why the timing of SAESL’s spending peak carries more weight than the current-period JV profit decline itself.
Where the business is actually growing
After two layers of qualification, here is the affirmative case. The segment that best represents SIAEC’s core franchise, airframe and line maintenance, is expanding.
- Airframe and line maintenance segment profits: the segment recorded a 14.3% year-on-year gain, the clearest evidence that SIAEC’s labour-driven, volume-based core is compounding underneath the headline noise.
- Line maintenance flight handling: 40,615 flights processed during the quarter, reflecting a 2.9% year-on-year increase and a direct measure of recurring, volume-driven demand tied to Asia-Pacific air traffic normalisation.
The counter-signal: The group headline profit contracted 6.1%, yet core MRO segment profit advanced 14.3% and ex-materials revenue broadened by 4.2%.
Line maintenance is the stable, recurring earnings base that supports the investment case during periods of JV headwinds. For investors separating noise from signal, these segment-level metrics are the most direct evidence that SIAEC’s competitive position has not deteriorated. The franchise value is compounding; the financial reporting just happens to be catching the worst quarter of a temporary capex cycle.
Oliver Wyman’s MRO market forecast for 2026-2036 identifies Asia-Pacific passenger traffic growth as a primary driver of regional MRO demand, providing independent structural backing for the thesis that SIAEC’s core franchise is expanding into a supportive long-run demand environment.
What the analysts actually disagree on
Two houses cover this stock with near-identical price targets and opposing recommendations. That alone tells you the debate is not about business quality.
| House | Rating | Target Price | Basis | Key Condition for Upside |
|---|---|---|---|---|
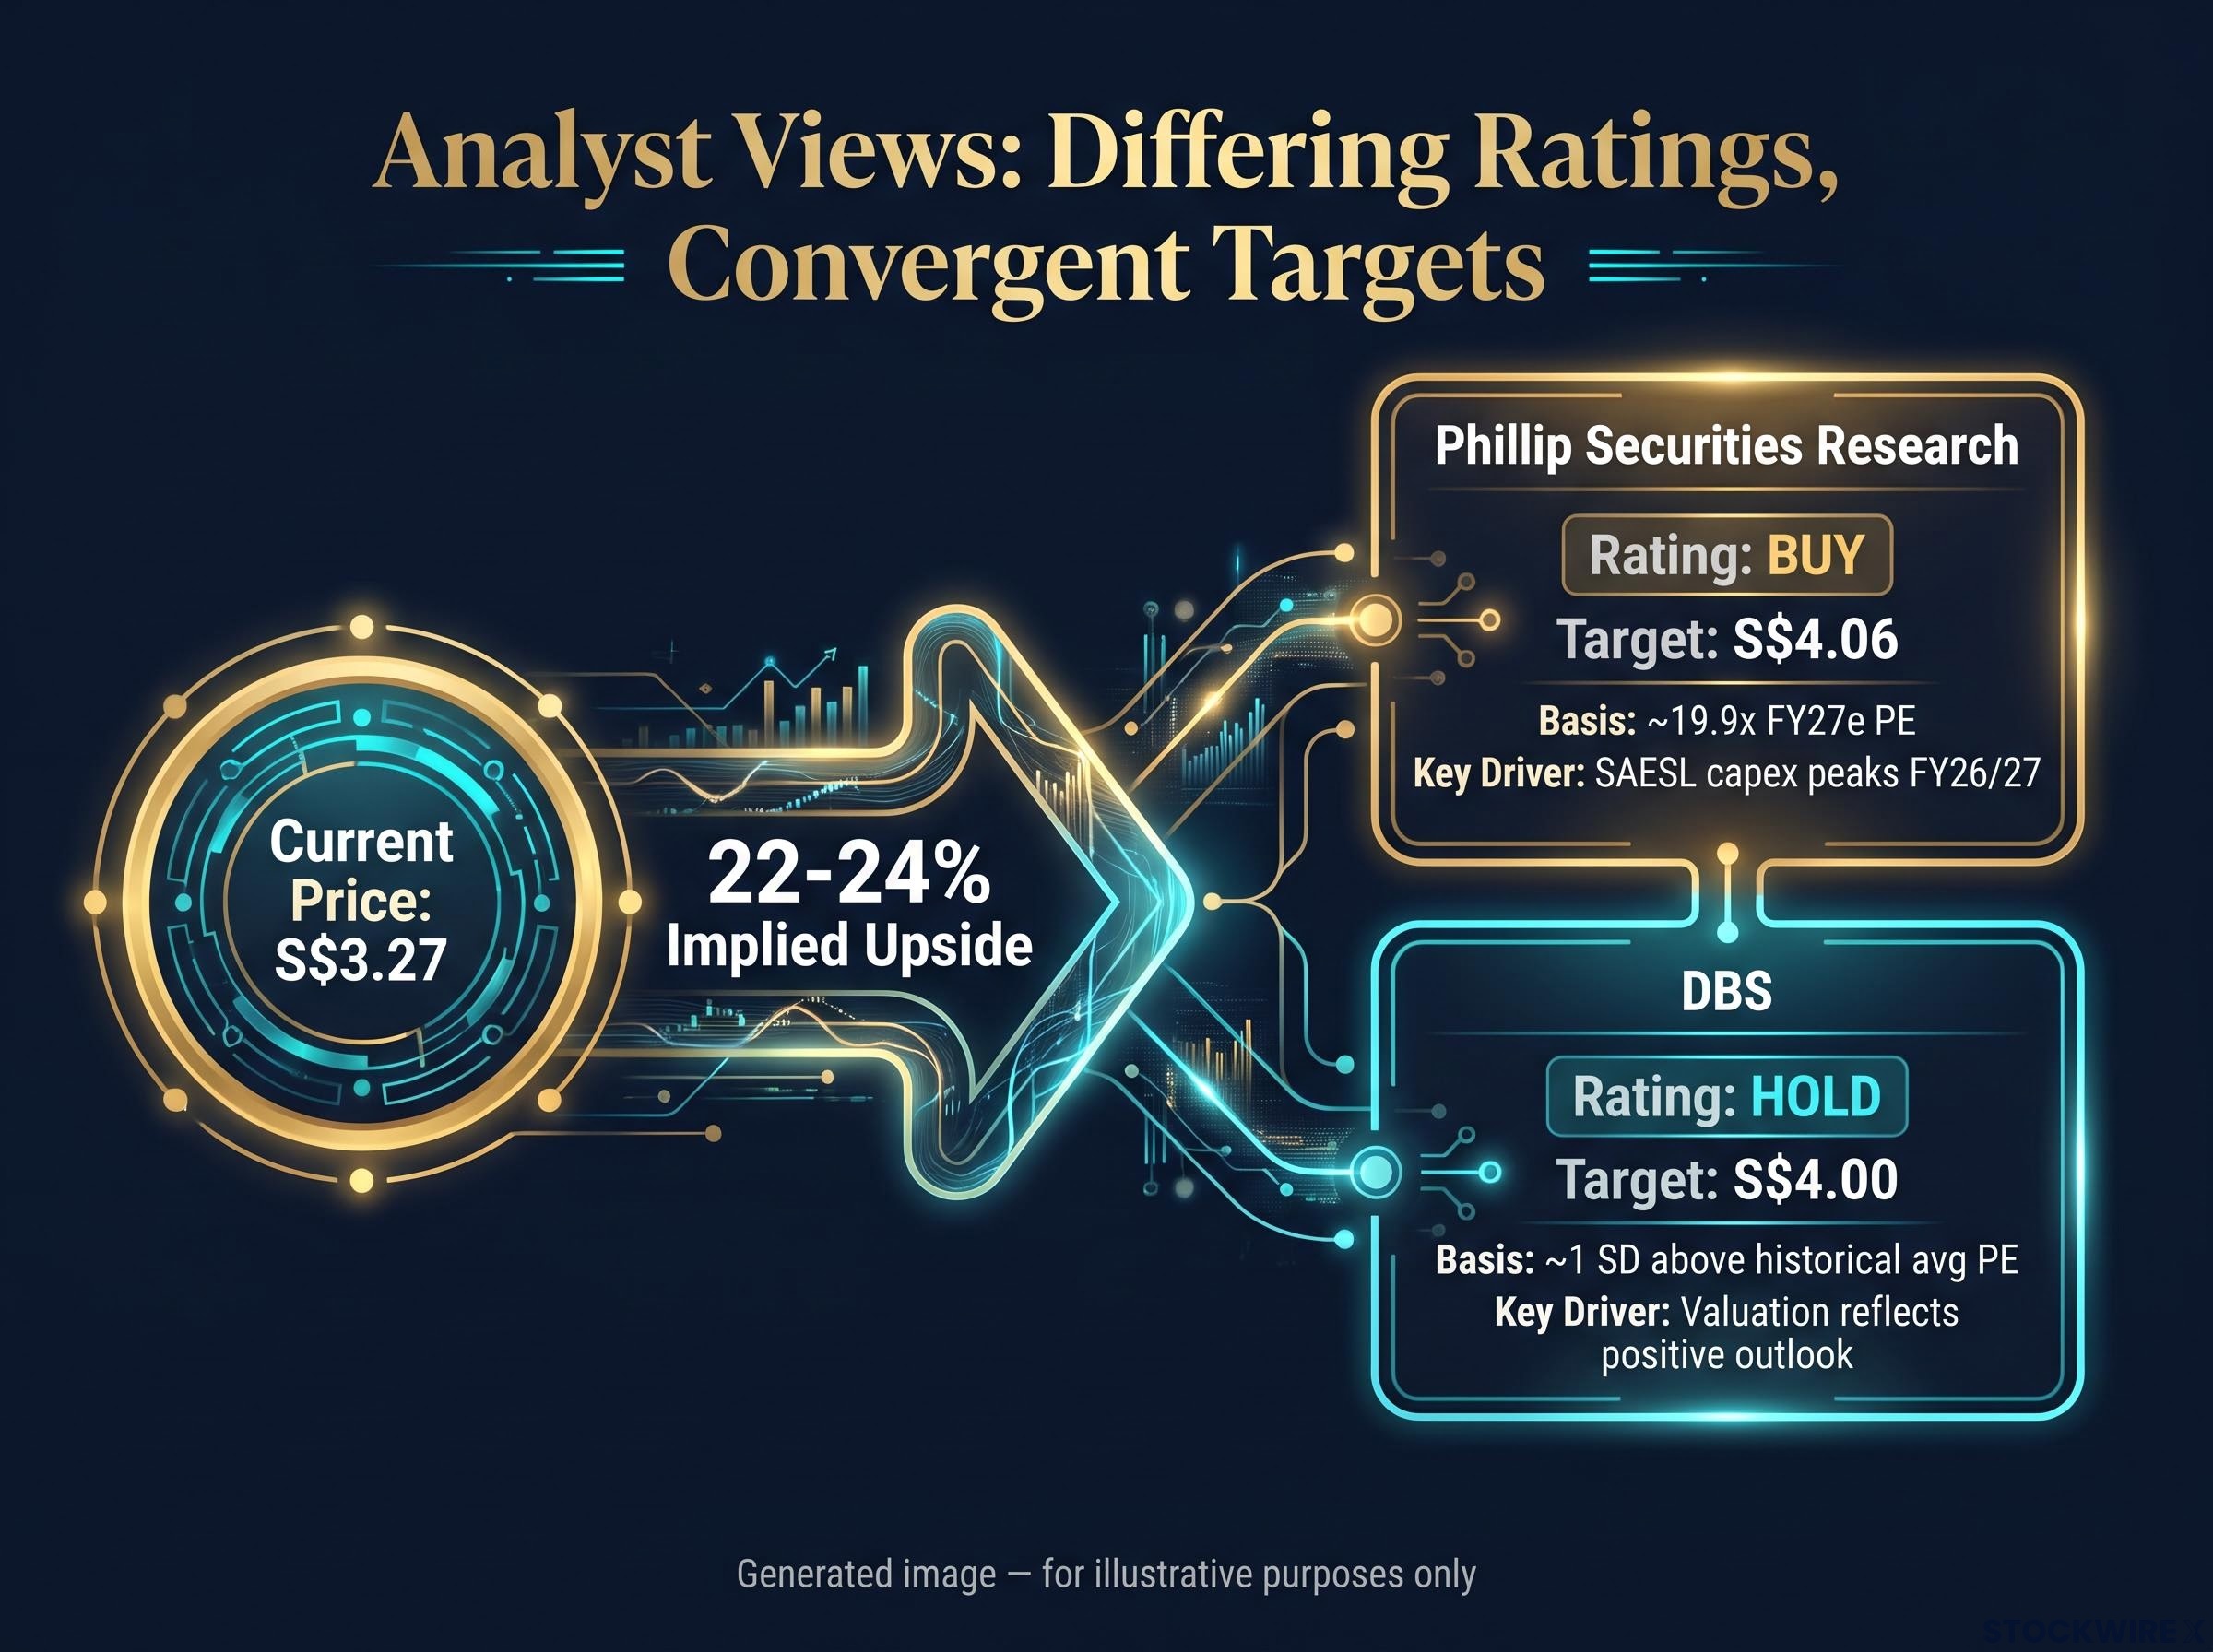
| Phillip Securities Research | BUY | S$4.06 | ~19.9x FY27e PE | SAESL capex peaks FY26/27; Asia-Pacific MRO demand runway intact |
| DBS | HOLD | S$4.00 | ~1 SD above historical avg PE | Valuation already reflects positive outlook; patience over new buying |
The share price at the time of results sat at approximately S$3.27, down 0.6% on the day. That implies roughly 22-24% upside to both targets.
Singapore equity market context matters for interpreting SIAEC’s premium multiple: with the broader SGX delivering an 11.3% return in H1 2026 and banking stocks trading at elevated valuations, a defensively positioned MRO franchise at roughly 20x forward earnings sits inside a market where quality businesses are consistently commanding premium pricing.
Reading the premium multiple in context
When a stock trades approximately one standard deviation above its historical average price-to-earnings ratio (the average multiple the market has historically paid for a company’s earnings), it means the market is already pricing in a benign outlook. That leaves limited margin for error if the SAESL investment cycle extends beyond expectations.
At 19.9-20x FY27 estimated earnings, SIAEC’s valuation reflects the quality and defensiveness of its MRO franchise. This is not a distressed or overlooked valuation. Both houses agree on the business; the divergence is purely about whether today’s price already captures the optimism. The narrow gap between a BUY and a HOLD on a stock with 22-24% implied upside tells you the real question is how patient you need to be, and how much of the JV recovery is already priced in.
The four variables that will determine whether this thesis plays out
Rather than listing abstract risks, here are four specific metrics and milestones to track across Q2 and Q3 FY27. Each is observable in quarterly reporting.
- SAESL capex cycle: This is the load-bearing variable. PSR expects FY26/27 to be the peak year. Watch associate and JV profit trends in Q2 and Q3 for stabilisation signals. If JV profits remain flat or begin recovering, the capex-cycle thesis holds. If they decline further, the investment phase may be longer than forecast.
- Heavy maintenance workload: Checks fell 13% to 20 in Q1. A recovery toward the prior-year level would signal workload normalisation and a return of materials-related revenue.
- Managed component fleet recovery: The fleet shrank 9% to 151 aircraft. Fleet size is a leading indicator for materials revenue; growth here would confirm that the Q1 contraction was temporary.
- Valuation and expectations risk: With the stock at a premium multiple, any earnings miss relative to the 22% quarterly run-rate assumption is likely to compress the multiple more sharply than it would at a lower valuation. Premium prices embed optimism, and missed inflection points tend to be punished.
The pivotal assumption: Should SAESL’s capex burden reach its peak this financial year as Phillip Securities Research projects, the present quarter marks the trough of the earnings headwind, with JV profit recovery expected to take hold from H2 FY27 onwards.
Holding the contradictions: what Q1 FY27 actually tells a long-horizon investor
Three numbers cut through the noise. A 159% surge in operating profit. Ex-materials revenue expanding 4.2%. The airframe and line maintenance segment advancing 14.3%. All three point in the same direction: the core franchise is improving, and the headline decline is a compositional artefact layered on top of a temporary JV investment drag.
The analyst divergence reinforces this reading. PSR’s BUY at S$4.06 and DBS’s HOLD at S$4.00 agree on business quality and long-term MRO demand. The disagreement is a valuation timing question, not a fundamental one. Both houses see approximately the same company; they disagree on how much of the future is already in the price at S$3.27.
First verification point: The SAESL JV profit trend in Q2 FY27. If associate and JV profits stabilise or begin recovering, the capex-cycle thesis firms up and the path to the analyst targets becomes more visible.
The investor best positioned to benefit from SIAEC at current prices is one with a multi-quarter horizon, comfort with a premium multiple, and the discipline to monitor the four variables above rather than react to headline figures that tell the wrong story.
For investors wanting a repeatable framework to apply to future SIAEC releases and similar JV-heavy industrials, our full explainer on reading earnings beyond the headline covers the four-layer method: beat source, accounting presentation, forward guidance, and margin and cash flow trends.
This article is for informational purposes only and should not be considered financial advice. Investors should conduct their own research and consult with financial professionals before making investment decisions. Past performance does not guarantee future results. Financial projections are subject to market conditions and various risk factors.