Foxconn Beats Q2 Estimates by 6% as AI Server Demand Surges
17 hrs ago

On 18 May 2026, sovereign bond yields across six major economies surged to generational highs in a single session. Germany, France, Italy, Spain, the United States, and Japan all posted sharp moves upward simultaneously, a degree of synchronisation that ING analysts described as “the dominant story across global financial markets.” The trigger sits in energy markets: Brent crude above $110 per barrel, the Strait of Hormuz largely closed to tanker traffic, and oil prices up roughly 57% since late February when Middle East conflict escalated. Bond markets are repricing the inflation risk that follows. What comes next, for borrowing costs, equity valuations, and emerging market stability, depends on whether the energy shock proves temporary or entrenched. This article traces the cause, the mechanics, and the consequences of a bond sell-off that has become a portfolio-wide event.
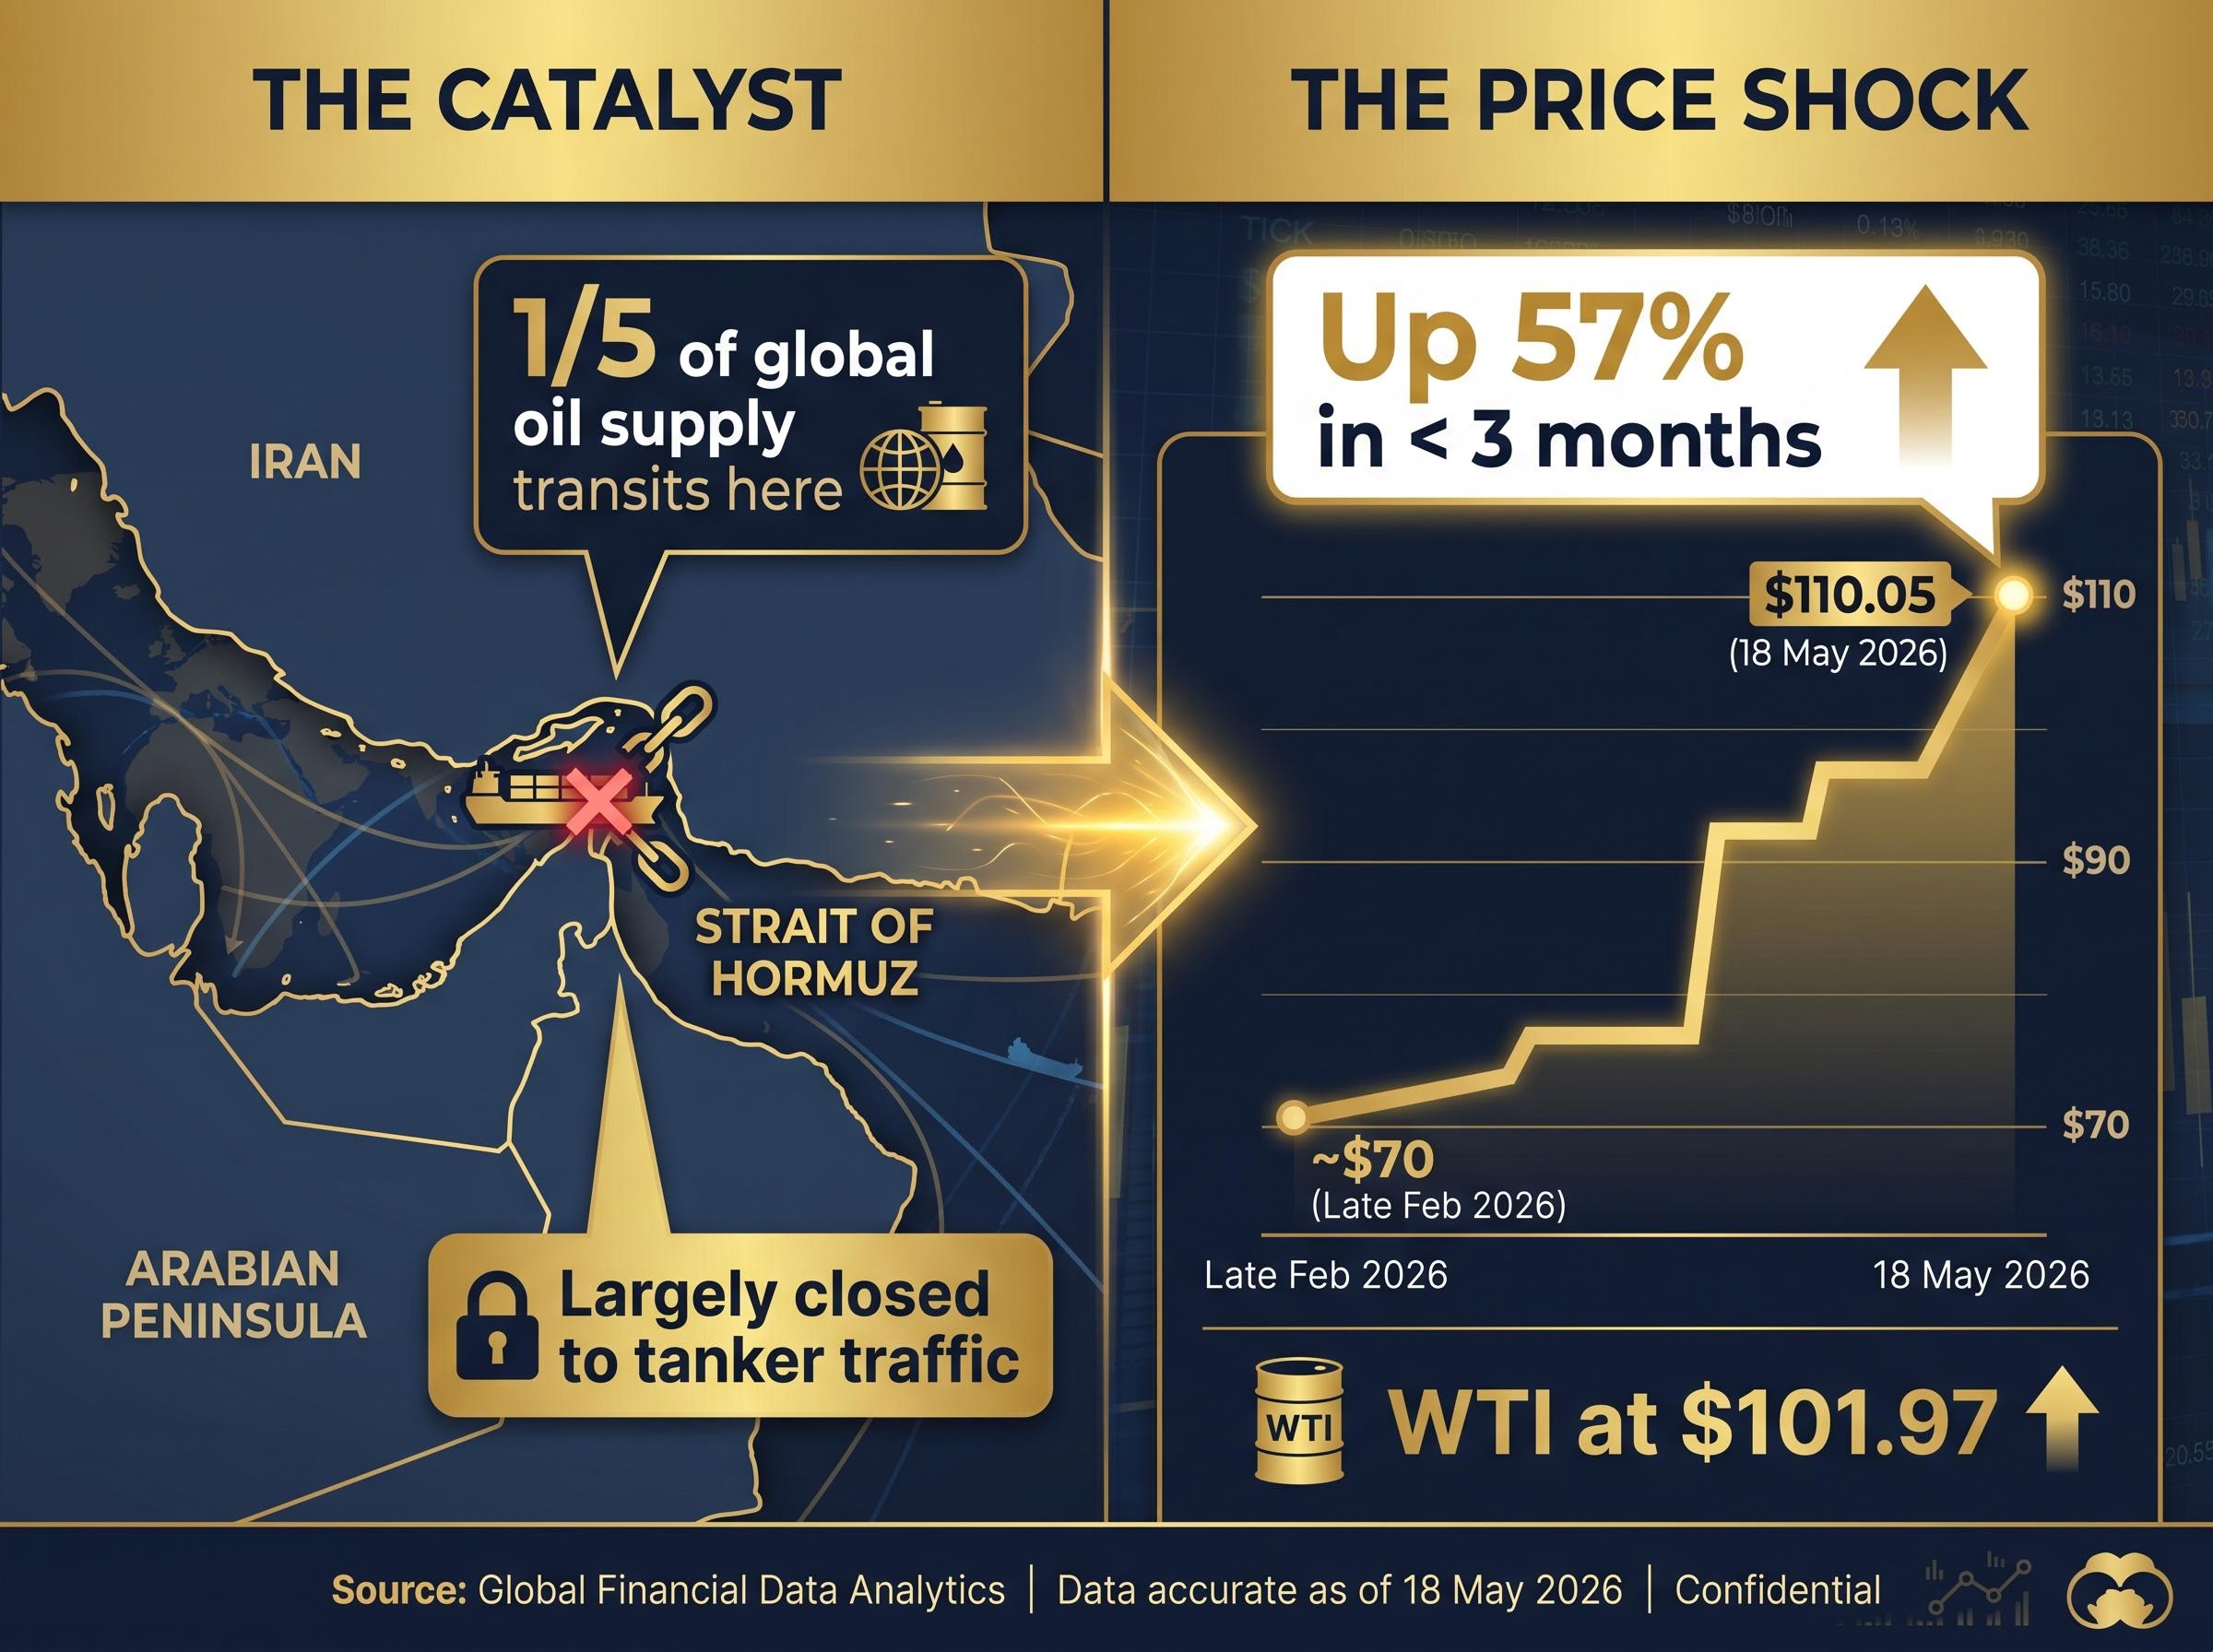
The oil move came first. Brent crude traded at approximately $70 before conflict escalation in late February 2026. By 18 May, it stood at $110.05, up roughly +0.72% on the session alone. WTI closed at $101.97, up approximately +0.94%. A 57% rise in less than three months.
Brent crude has risen approximately 57% since late February 2026, driven by sustained conflict in the Middle East and the near-total closure of the Strait of Hormuz to commercial tanker traffic.
The transmission into bonds is direct. Roughly one-fifth of global oil supply transits the Strait of Hormuz, and that waterway has been largely inaccessible to tankers throughout the conflict. Higher energy costs feed into the price of nearly everything: transport, manufacturing, agriculture, consumer goods. Bond investors, facing the prospect of sustained inflation, demand higher yields to compensate for the erosion of their fixed returns.
The scale of the oil supply disruption extends well beyond the Strait of Hormuz closure itself: Saudi Arabia’s crude output fell to its lowest level since 1990 in April 2026, global inventories were drawing at more than double the previous record pace, and IEA projections showed no scenario in which supply and demand return to balance before October 2026.
The reason bond investors react so sharply to energy shocks is rooted in how inflation erodes fixed returns over time; a bond paying 3% annually loses real purchasing power at any inflation rate above that level, which is why even a credible risk of sustained price rises is enough to trigger an immediate sell-off.
The sequence on 18 May:
Energy prices are the fastest-moving input into headline inflation, and bond investors globally repriced that risk on 18 May.
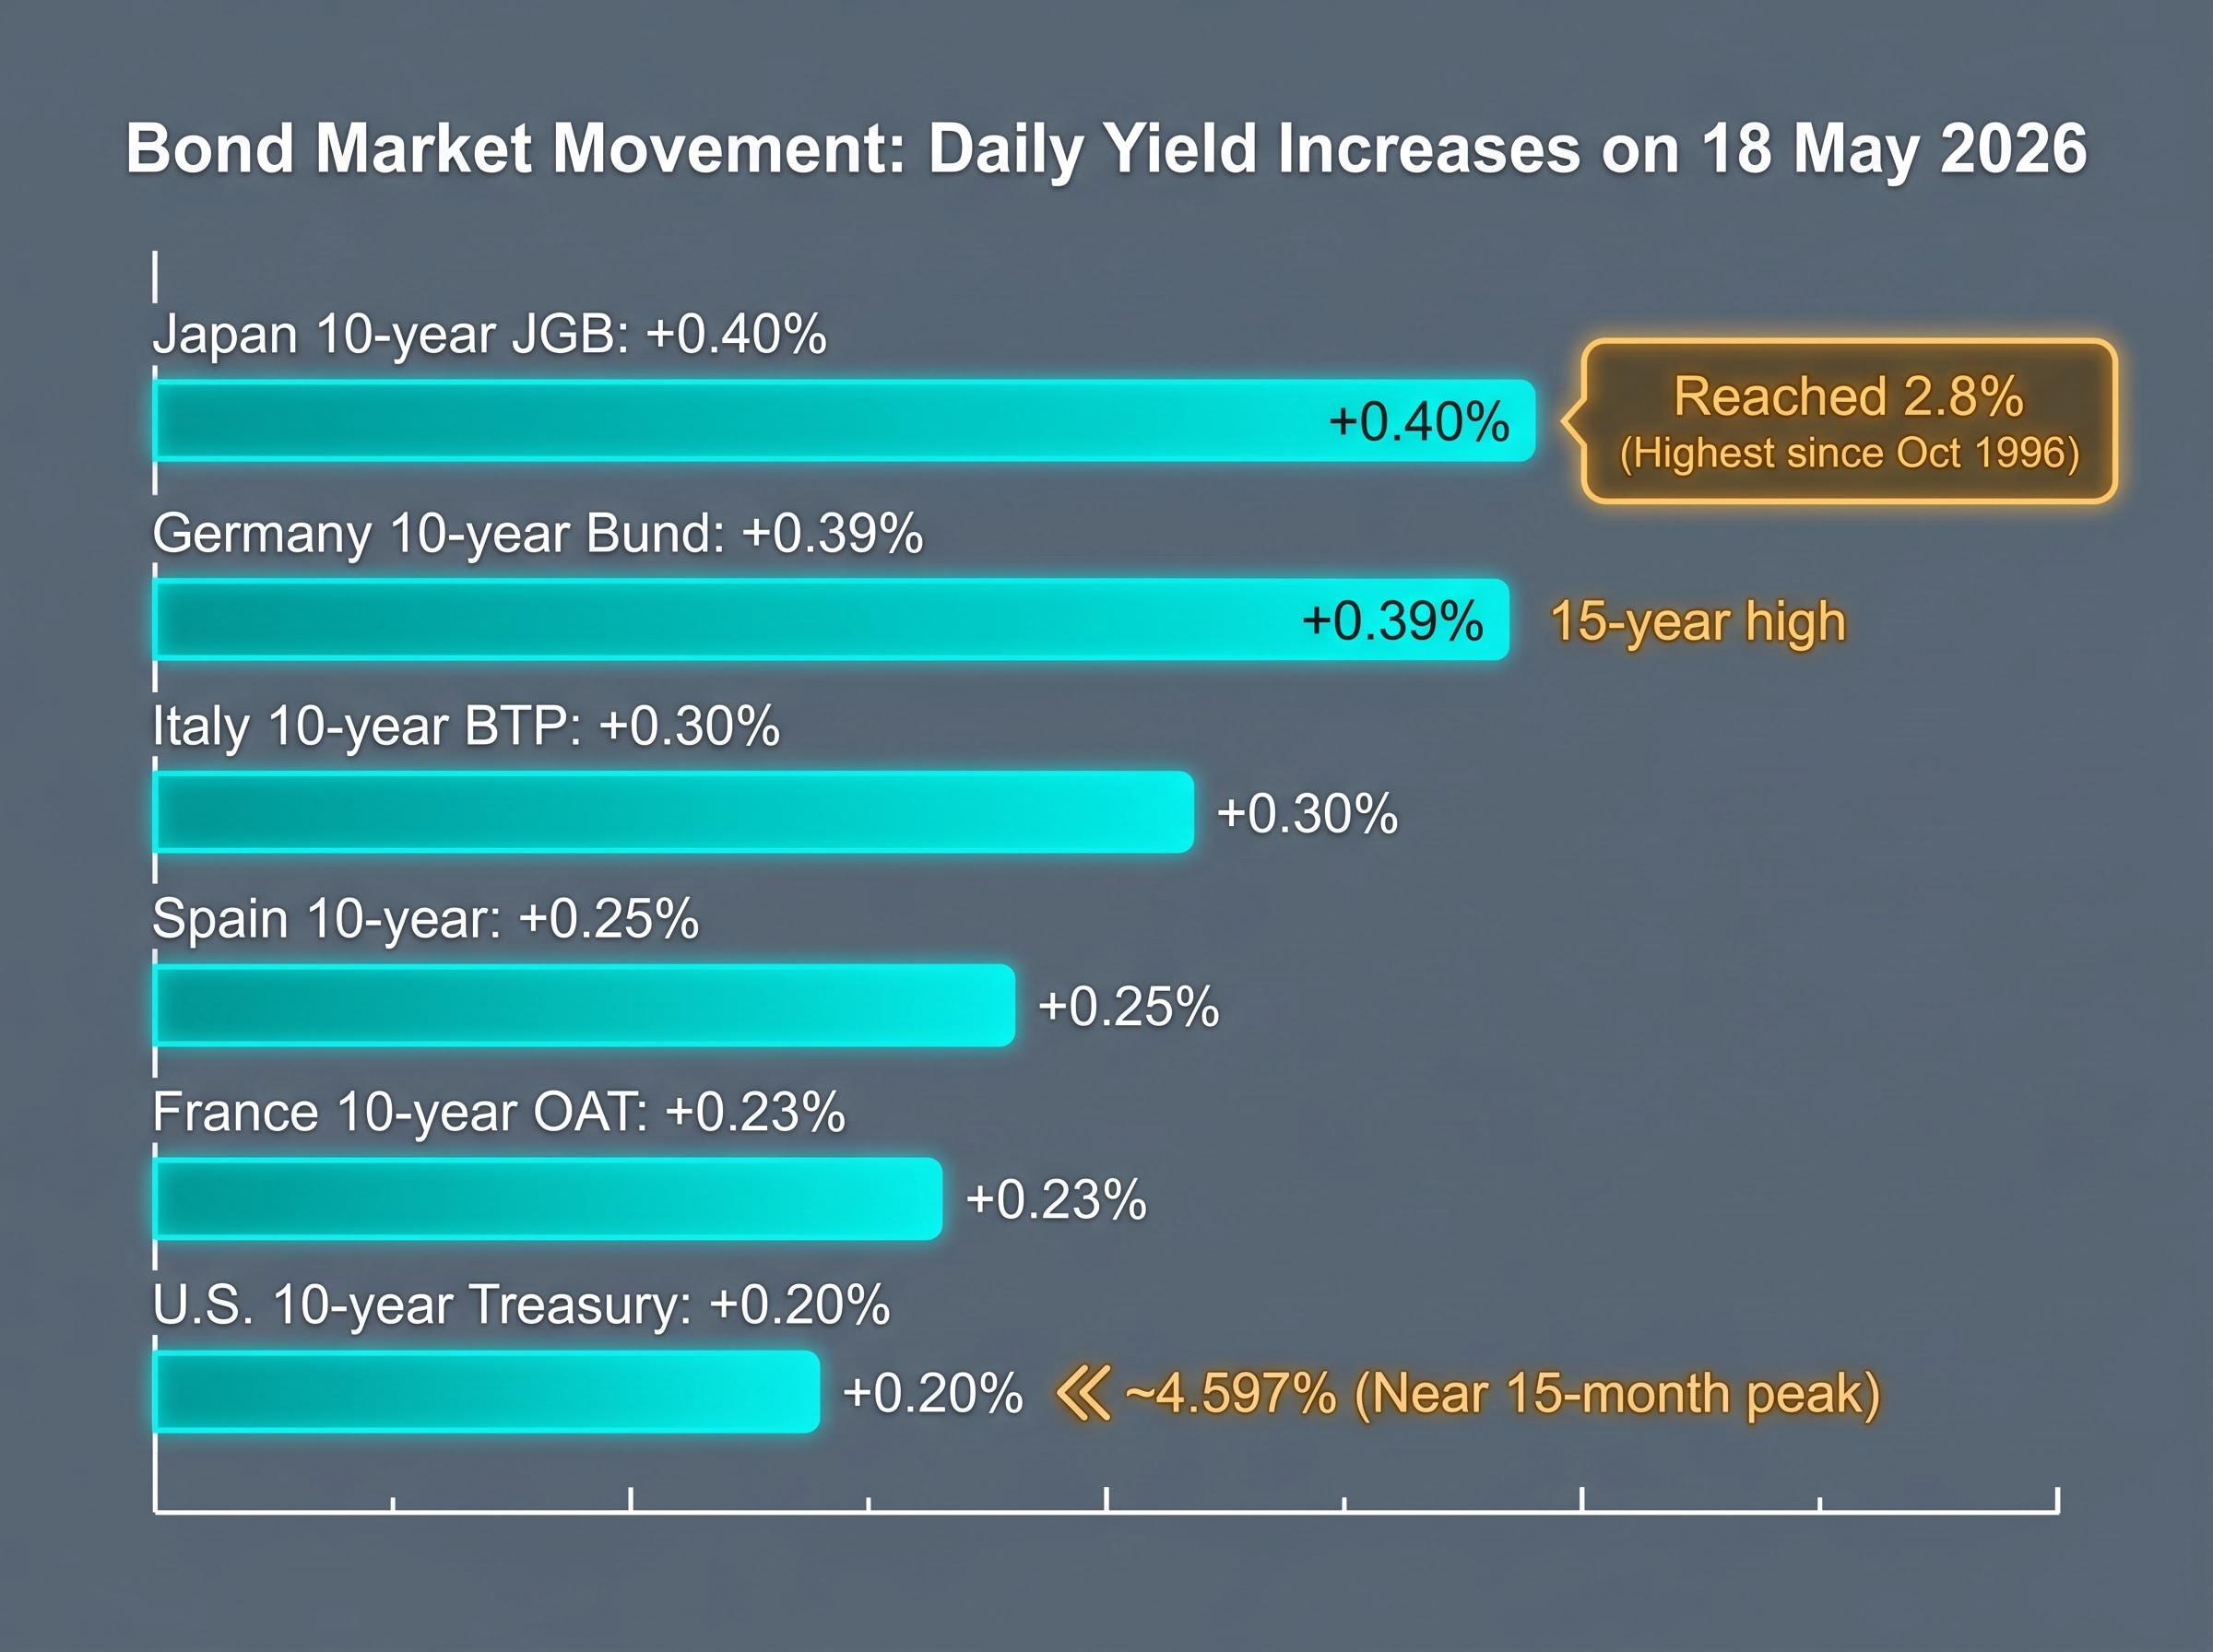
Japan delivered the most historically striking move. The 10-year Japanese Government Bond (JGB) yield rose approximately +0.40% on the session to reach 2.8%, its highest level since October 1996, a 30-year peak. According to Reuters live market reports, 20-year JGB yields are also at multi-decade highs.
| Market | Yield Move (18 May) | Level / Benchmark Context |
|---|---|---|
| Japan 10-year JGB | +0.40% | 2.8%, highest since October 1996 |
| Germany 10-year Bund | +0.39% | 15-year high |
| Italy 10-year BTP | +0.30% | Peripheral spread widening |
| Spain 10-year | +0.25% | Peripheral spread widening |
| France 10-year OAT | +0.23% | Multi-year high |
| U.S. 10-year Treasury | Near 15-month peak | Approximately 4.597% |
| Euro Bund Futures | -0.12% | 124.13 (price decline reflects yield rise) |
ING analysts described the sell-off as “the dominant story across global financial markets” in a published note. The simultaneous nature of these moves, spanning different currency blocs, different rate cycles, and different fiscal positions, is what distinguishes this episode from routine volatility.
US 30-year yields above 5% for the first time since 2007, UK 30-year gilt yields at their highest since 1998, and Japanese 30-year JGB yields at an all-time record were the markers recorded just three days earlier on 15 May, establishing the trajectory that the 18 May session extended further.
A 30-year high in JGB yields carries particular weight. Japan’s bond market has been the anchor of global low-rate expectations for decades. When JGB yields break out, it signals that the repricing of inflation risk is not confined to economies with conventional inflation problems. It is global.
A bond’s price and its yield move in opposite directions. When investors sell bonds, prices fall and yields rise. The Euro Bund Futures decline of roughly -0.12% to 124.13 on 18 May illustrates this inversion concretely: the price dropped because yields climbed.
The cascade from there affects nearly every corner of financial markets:
When German Bund yields hit a 15-year high and U.S. Treasury yields approach 4.597%, the cost of borrowing reprices across the global financial system. Mortgage rates reference sovereign yields. Corporate bond pricing builds on top of them. Every leveraged position becomes more expensive to maintain.
The discount rate mechanism is where bonds meet equities directly: higher yields raise the rate used to value future corporate earnings, compressing the present value of growth stocks, utilities, and real estate names whose cash flows sit furthest in the future.
This is the reason a bond sell-off is not a specialist concern. Any reader holding equities, property, or leveraged assets is exposed.
The dilemma facing central banks is real. Raising rates fights inflation but risks breaking something in a financial system already under strain. Cutting rates risks entrenching the energy price shock into broader inflation expectations. Each major central bank faces a version of this constraint.
The Federal Reserve’s publicly documented posture has been broadly “restrictive and patient,” monitoring financial conditions tightening through market yields rather than adding rate hikes. Rising long-term yields have effectively done some tightening work for the Fed by raising borrowing costs across the economy without a policy rate change. The constraint: if energy-driven inflation proves persistent, the Fed cannot cut rates to relieve market pressure without risking its credibility on the 2% inflation target.
The Federal Reserve’s rate path carries an additional dimension in May 2026: Kevin Warsh was confirmed as Chair on 13 May into an environment of 3.8% headline CPI and three regional Fed presidents publicly calling for rate hikes by Q3, creating a policy leadership context that shapes how markets interpret any Fed communication on the bond sell-off.
ECB President Christine Lagarde made brief remarks at G7 meetings on 18 May 2026. Asked about the bond sell-off, she responded: “I always worry, that’s my job!” according to Reuters. The ECB’s known framework distinguishes between temporary energy price shocks, which policy should look through, and second-round effects that embed into wages and services inflation, which require a response. The widening in Italian and Spanish sovereign spreads adds a fragmentation dimension the Fed does not face.
JGB yields at 2.8% represent the highest level since October 1996. The BoJ has been cautiously normalising policy after decades of ultra-loose settings, tolerating some yield rise as part of that process. Its stated readiness to conduct bond-buying operations to maintain orderly market conditions acts as a backstop, but the speed of the move tests the boundary between “orderly normalisation” and disruptive repricing.
Central bank decisions in the coming weeks will determine whether this sell-off stabilises or accelerates. Understanding each bank’s constraints helps readers anticipate how policymakers are likely to respond.
The bond sell-off is sending waves outward through three asset classes simultaneously.
The tightest squeeze falls on countries at the intersection of high external debt, large current-account deficits, and energy import dependence. The IMF has warned that these economies are most vulnerable to the combined shock of elevated global yields and oil prices. Energy exporters have seen relatively better performance on improved terms of trade, though risk-off sentiment has limited gains.
The IMF sovereign debt vulnerability analysis of emerging market and developing economies identifies countries carrying high external debt alongside large current-account deficits as the most exposed to combined shocks of elevated global yields and commodity price surges, precisely the conditions markets are navigating in May 2026.
For readers with diversified portfolios, the ripple effects into equities, corporate debt, and emerging markets confirm that this is not a fixed-income event. It is a portfolio-wide repricing.
This article is for informational purposes only and should not be considered financial advice. Investors should conduct their own research and consult with financial professionals before making investment decisions.
The speed and global synchronisation of the current sell-off has drawn explicit comparisons with three prior episodes, each offering a different lesson.
| Episode | Primary Cause | Central Bank Response | Key Risk Identified |
|---|---|---|---|
| 1994 Bond Massacre | Unexpected Fed rate tightening | Fed continued tightening cycle | Global synchronisation, speed of repricing |
| 2013 Taper Tantrum | Fed balance-sheet signal | Fed ultimately delayed tapering | EM capital outflows, currency crises |
| 2022 UK Gilt Crisis | Fiscal shock exposing LDI leverage | BoE emergency bond buying | Hidden leverage in pension structures |
| May 2026 | Energy shock, geopolitical term premia | Patience on cuts; monitoring conditions | Stagflation risk; EM vulnerability; no LDI equivalent identified |
The 1994 episode is the closest parallel in terms of global reach and speed, but the cause then was a policy surprise from the Fed. The current shock is external in origin: energy prices and geopolitical risk driving term premia higher. The 2013 taper tantrum shares the EM pressure dimension, but central banks are not surprising markets with tightening signals; they are emphasising patience. The 2022 UK gilt crisis serves as a reminder that yield spikes expose leverage, but regulators have identified no equivalent to the LDI pension structure at the centre of that episode. Monitoring of non-bank intermediaries is ongoing, and no systemic dislocation has been reported.
Market participants have characterised the current environment as a potential “new regime” in which term premia are rising due to persistent inflation risk, higher real rates, and fiscal concerns rather than a one-off policy communication error. The energy shock adds a stagflationary dimension that none of the three historical episodes shared.
Past performance does not guarantee future results. Financial projections are subject to market conditions and various risk factors.
The energy shock and the bond sell-off are not separate events. They are the same event viewed from two angles, and neither has resolved.
The variables that will determine whether the repricing extends or reverses are identifiable: the status of the Strait of Hormuz and the trajectory of ceasefire negotiations; central bank communications at and following the G7; corporate earnings guidance revisions as companies absorb higher input costs; and EM central bank responses to currency and inflation pressure.
Markets are pricing a new inflation risk regime. Whether that repricing proves correct depends on whether the energy shock is temporary or entrenched. A rapid resolution in the Strait of Hormuz could reverse much of the yield move. A prolonged closure would confirm the structural shift that bond markets are now betting on.
These statements reflect current market conditions and are subject to change based on geopolitical developments and policy responses.
A bond market sell off occurs when investors sell bonds in large volumes, pushing bond prices down; because bond prices and yields move in opposite directions, falling prices cause yields to rise, making borrowing more expensive across the economy.
On 18 May 2026, sovereign bond yields across six major economies surged simultaneously after Brent crude oil rose roughly 57% since late February 2026, driven by Middle East conflict and the near-total closure of the Strait of Hormuz, prompting bond investors to reprice the inflation risk that follows an energy shock.
Rising bond yields increase the discount rate used to value future corporate earnings, which compresses the present value of growth stocks, utilities, and real estate companies whose cash flows sit furthest in the future, leading to broad equity valuation declines.
The IMF has identified countries carrying high external debt alongside large current-account deficits as most exposed, particularly energy-importing emerging market economies in Asia where higher oil prices worsen trade balances and fuel domestic inflation simultaneously.
The 1994 bond massacre is the closest parallel in terms of global reach and speed, but that episode was triggered by a Fed policy surprise whereas the May 2026 sell off has an external cause: an energy price shock and geopolitical risk driving term premia higher, adding a stagflationary dimension that none of the three historical comparison episodes shared.