Why European Equities Are 9% Behind, and What Could Close the Gap
2 hrs ago


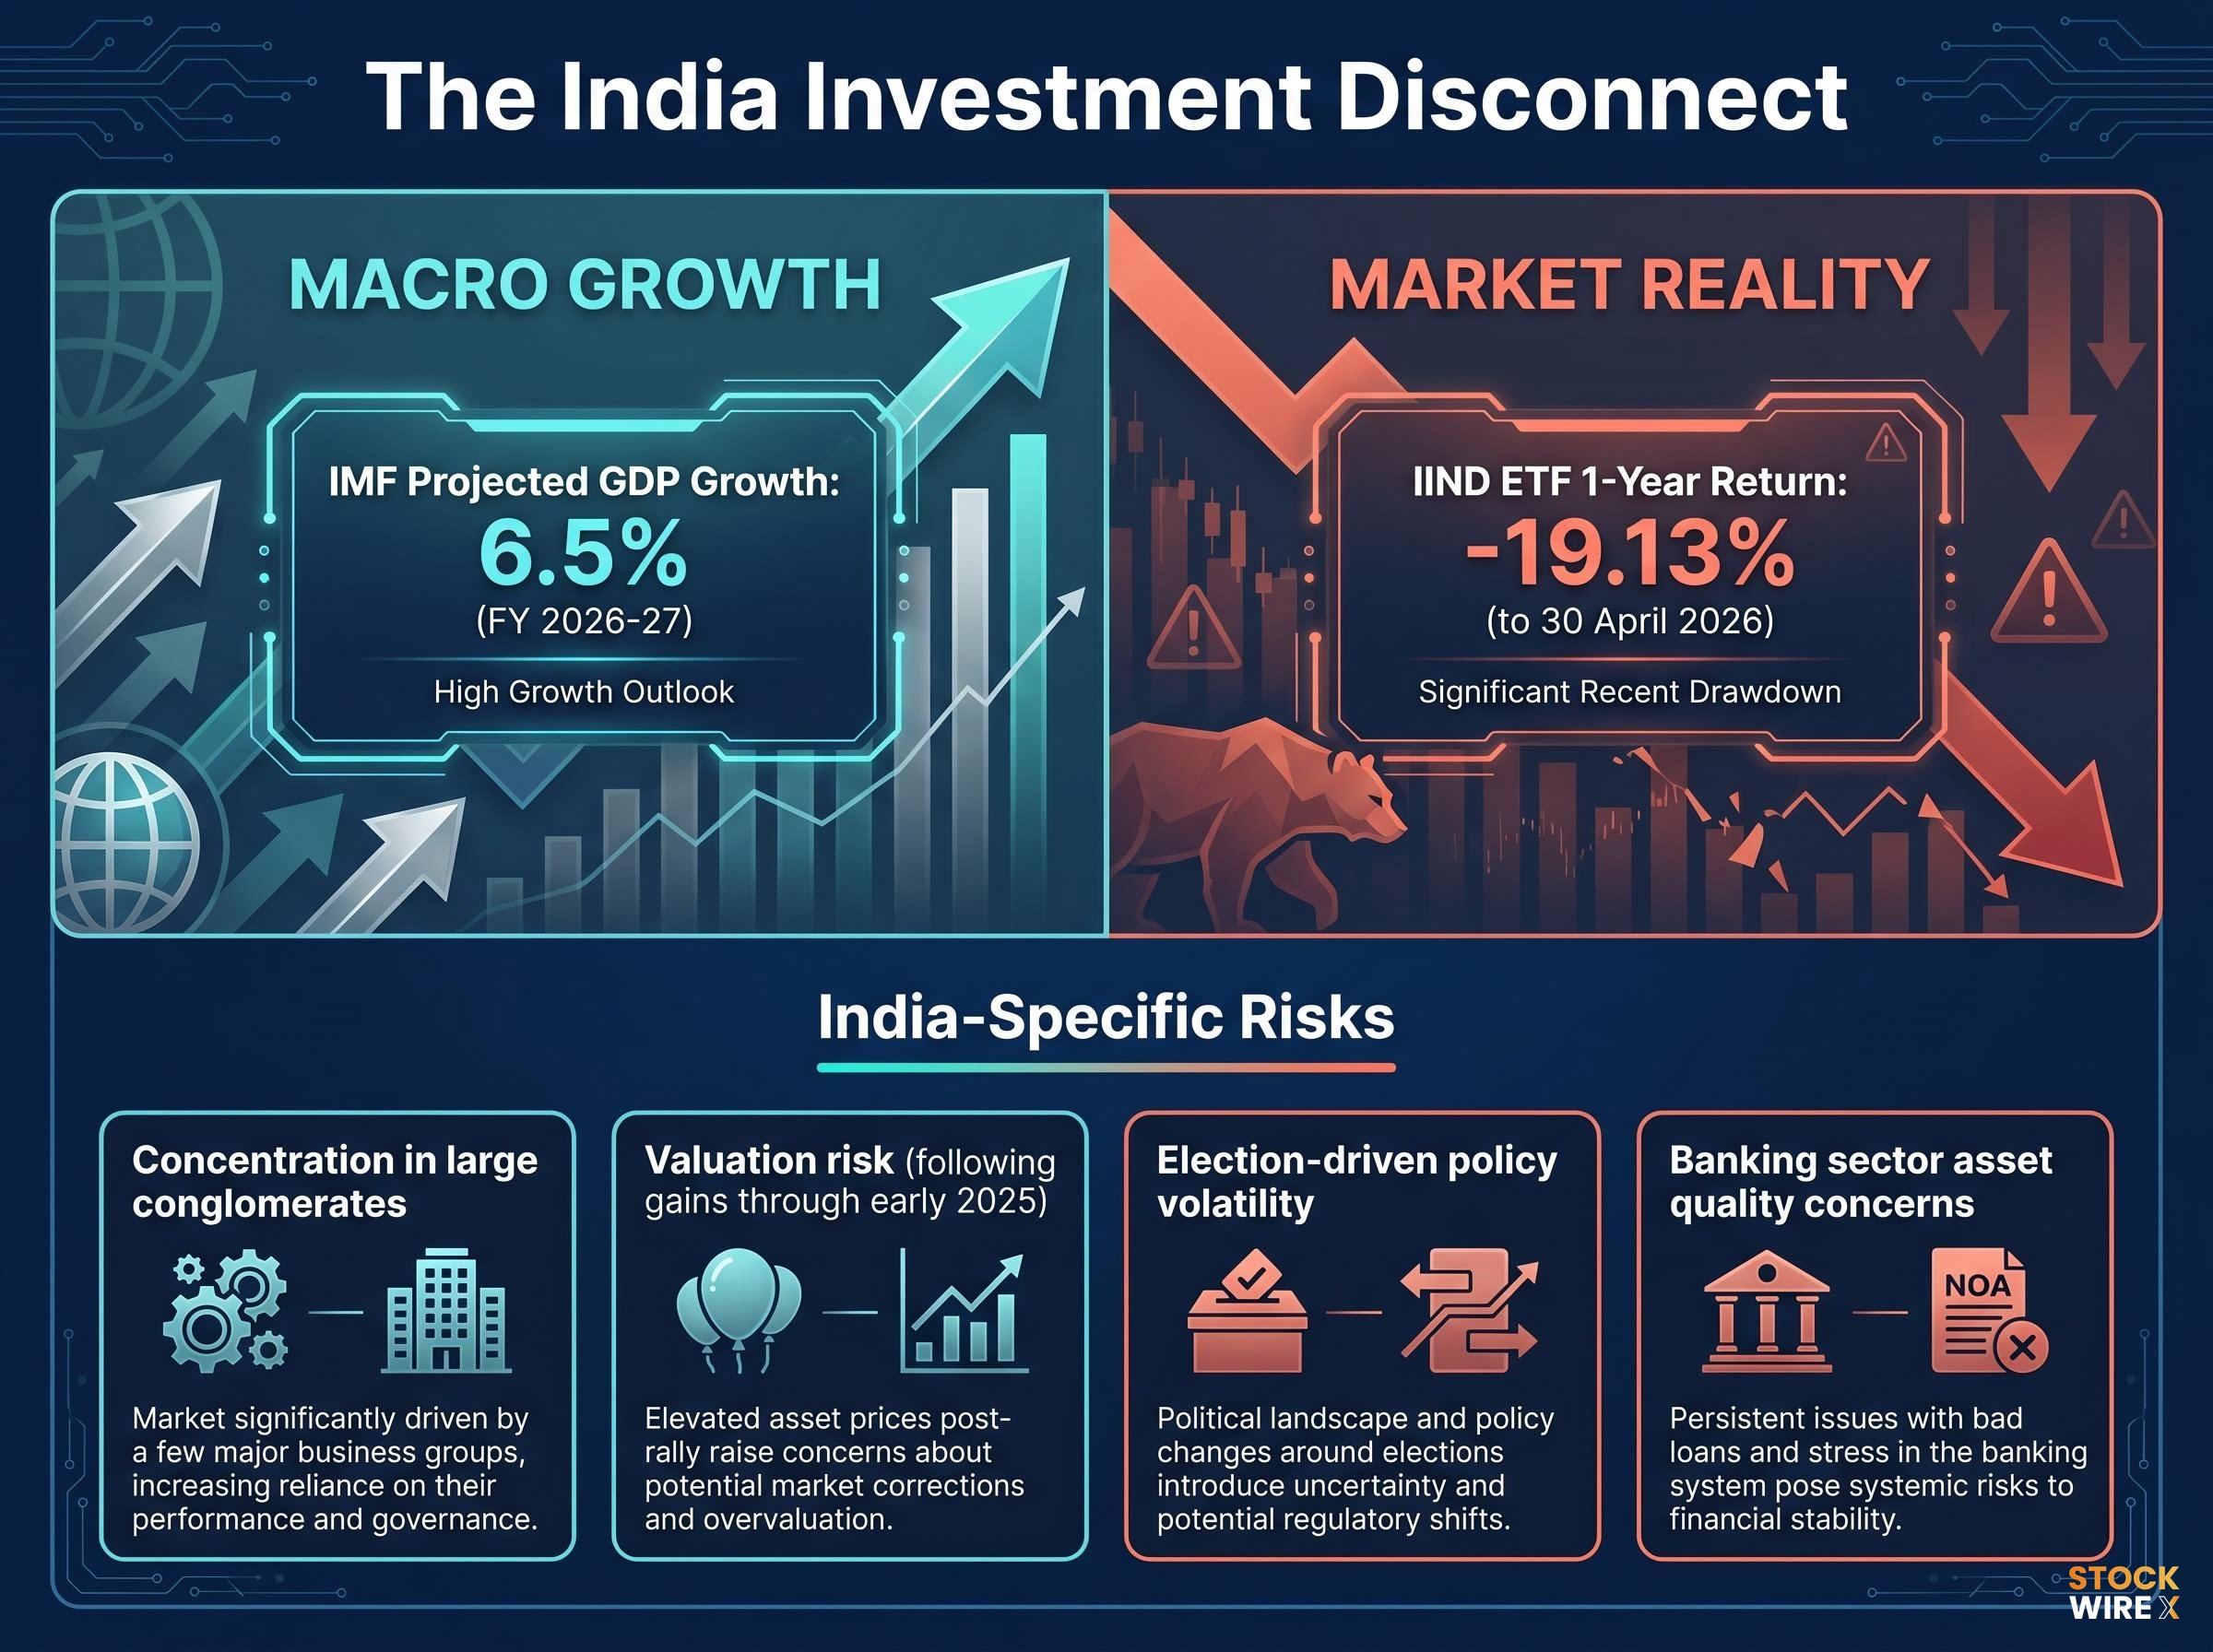
India equity ETFs on the ASX delivered a 1-year return of -19.13% to 30 April 2026, even as the International Monetary Fund forecast the country’s GDP to grow at 6.5% for FY 2026-27. That gap between economic momentum and investment outcome is precisely the problem quality screening tries to solve.
Australian investors now have more global and emerging market ETF options than at any point in the market’s history, but more options also means more ways to get the exposure wrong. Broad market-cap-weighted funds hand the most weight to the largest companies by default, regardless of profitability, balance sheet strength, or capital efficiency. Quality-factor approaches attempt to break that link, applying systematic filters before allocating a single dollar.
This analysis examines the case for quality-screened international ETFs, using the Betashares Global Quality Leaders ETF (QLTY) and the Betashares India Quality ETF (IIND) as concrete examples, and provides Australian investors with a practical framework for evaluating whether the quality tilt is worth the premium fee over plain-vanilla alternatives.
Market-cap weighting has a structural blind spot. It allocates the most capital to the largest companies, which are not necessarily the most profitable, the least leveraged, or the most efficient with shareholder capital. A company can sit near the top of a benchmark index by virtue of scale alone, carrying mediocre margins and a stretched balance sheet.
Quality screening is designed to close that gap. Rather than weighting by size, a quality-screened ETF applies rules-based filters that prioritise financial durability.
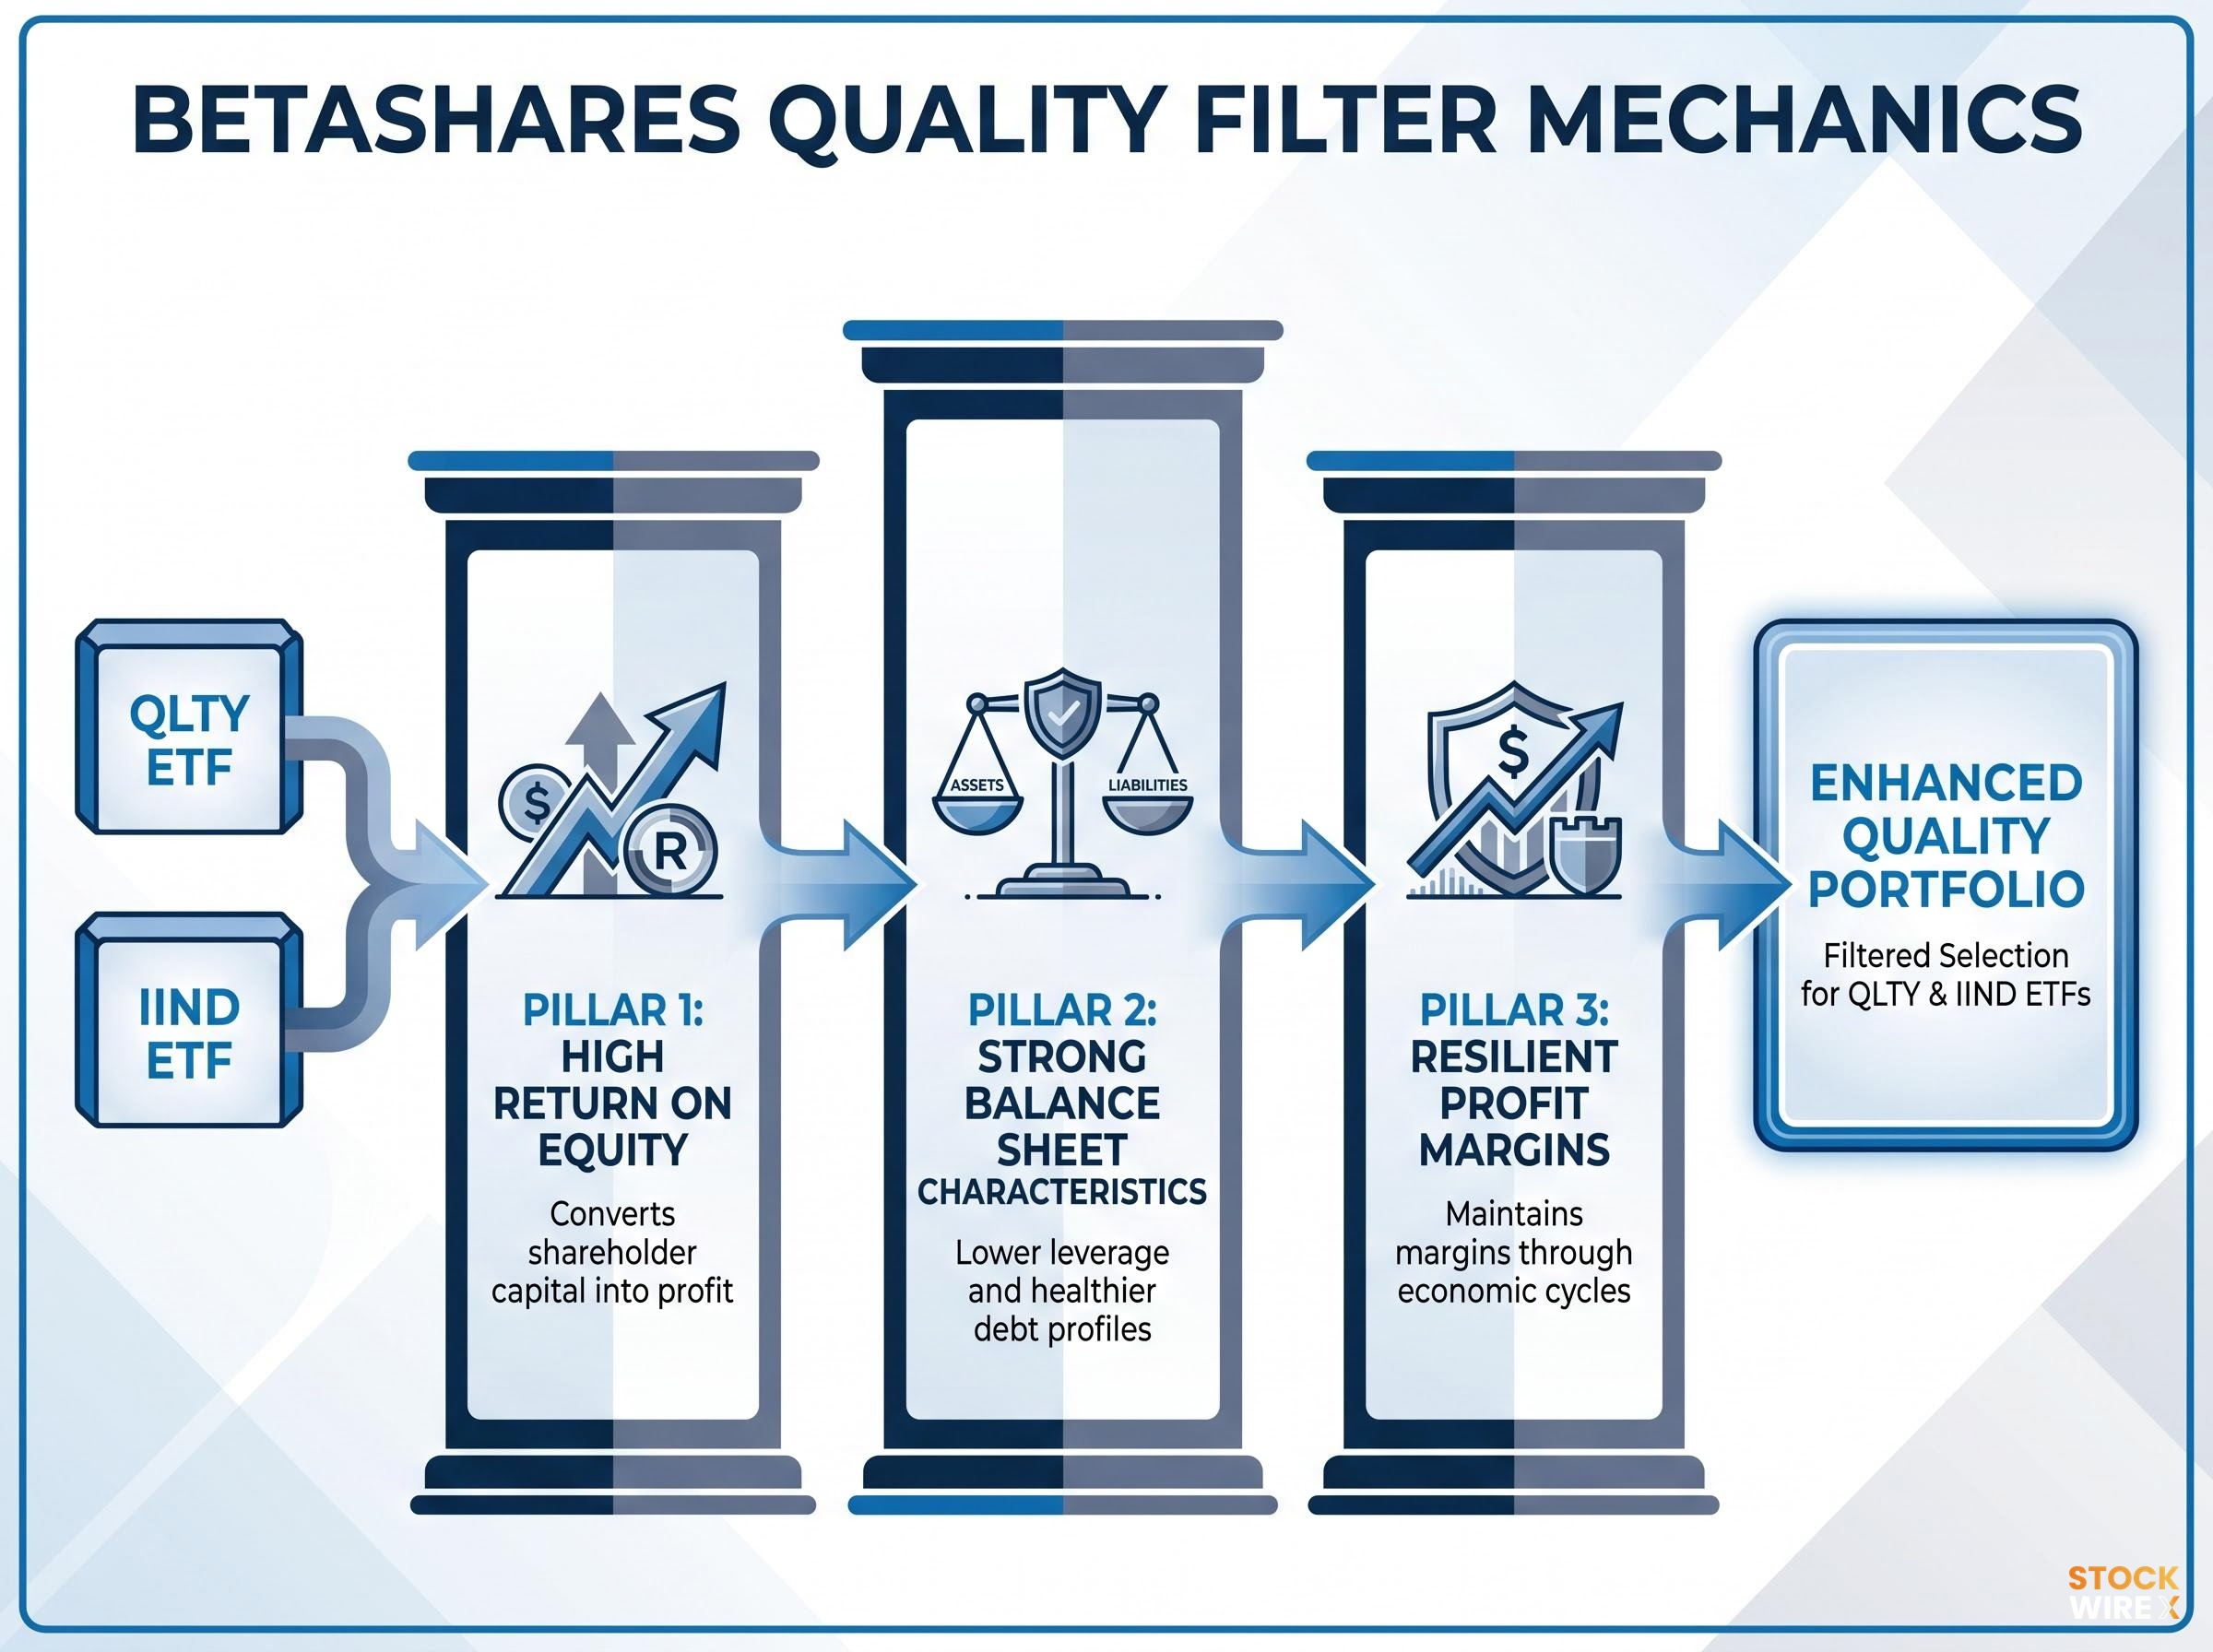
Betashares applies three core criteria across both QLTY and IIND:
QLTY tracks the Nasdaq Developed Select Leaders ex-Australia Index, holding international companies that pass these quality filters while excluding Australian equities. For local investors already holding domestic positions, the ex-Australia structure avoids duplication.
The distinction matters when comparing ETFs. A fund labelled “quality” without transparent, rules-based screening criteria may be using the term as a marketing label rather than applying genuine financial discipline.
The return sequence across multiple time periods tells a more complete story than any single trailing figure.
| Period | Return |
|---|---|
| 1-year | 4.70% |
| 3-year p.a. | 13.18% |
| 5-year p.a. | 10.18% |
| Since inception p.a. | 12.93% |
Performance as at 30 April 2026. Source: Betashares Fund Factsheet. Returns are after fees, before tax, and assume reinvestment of distributions. Past performance is not indicative of future performance.
The 1-year return of 4.70% looks modest in isolation. It looks even more compressed against the same measure twelve months earlier: QLTY’s 1-year return as at 30 April 2025 was 27.3%. That swing illustrates how sharply single-year figures can shift and why they are unreliable as the sole measure of a strategy’s merit.
The longer periods tell a different story. The since-inception annualised return of 12.93% (from 5 November 2018) spans a range of market conditions that tested the quality thesis under genuine pressure: the 2020 COVID drawdown, the 2022 rate-shock selloff, and the speculative rallies that followed each.
12.93% annualised since inception (5 November 2018): QLTY’s full-cycle return covers two bear markets and two recoveries, providing a more representative view of the quality factor’s behaviour than any trailing 12-month figure.
The compression of the 1-year number likely signals a period where speculative or narrow-leadership dynamics drove returns, conditions where quality strategies historically lag. That lag is not a flaw; it is a feature of the factor’s risk-management design.
The macro case for India reads well on paper. The IMF’s April 2026 World Economic Outlook projected GDP growth of 6.5% for FY 2026-27, following a January 2026 revision that lifted the FY 2025-26 estimate to 7.3%. A demographic dividend, rising middle class, accelerating digital adoption, and positioning as a China-plus-one manufacturing alternative underpin the structural thesis.
The IMF April 2026 World Economic Outlook projected India’s real GDP growth at 6.5% for FY 2026-27, a forecast that sits at the heart of the structural bull case for Indian equities but which has historically had limited predictive power over short-to-medium-term equity returns.
Then there is the investment return.
| Period | Return |
|---|---|
| 1-year | -19.13% |
| 3-year p.a. | 0.90% |
| 5-year p.a. | 4.01% |
| Since inception p.a. | 4.61% |
Performance as at 30 April 2026. Source: Betashares Fund Factsheet. Returns are after fees, before tax, and assume reinvestment of distributions. Inception date: 2 August 2019. Past performance is not indicative of future performance.
From +31.8% to -19.13% in twelve months: IIND’s 1-year return as at 30 April 2025 was 31.8%. Twelve months later, it was -19.13%. The swing encapsulates the volatility inherent in single-country emerging market exposure.
Structural GDP growth and short-to-medium-term equity returns are not the same thing. India-specific risks compound the disconnect:
Quality screening attempts to navigate these risks by filtering for profitability and balance sheet strength before allocating. It does not eliminate the volatility; the -19.13% figure makes that plain. What it aims to do is ensure the companies receiving capital within the portfolio are financially durable enough to withstand the drawdowns that concentrated emerging market exposure produces.
Emerging market ETF risks extend well beyond the quality of the underlying companies: currency movements, index classification differences across MSCI and FTSE Russell, and the tendency for broad EM funds to behave as concentrated Asian technology positions rather than genuinely diversified developing-economy exposures all compound the volatility that IIND’s return sequence illustrates.
Quality screening is not a no-downside strategy. There are specific market conditions where the factor systematically lags, and investors who hold quality ETFs should understand when and why.
According to Betashares’ March 2024 analysis, quality companies have historically produced smaller drawdowns and faster recoveries during earnings recessions, particularly relative to broad global benchmarks. A 2024 Morningstar Australia factor update reinforced this observation, noting that quality-tilted global funds outperformed broad market peers since the COVID-19 downturn in periods of rising rate volatility, due to more stable earnings and lower leverage.
Factor premiums cyclical behaviour is well-documented in the academic literature: value and low volatility outperformed in 2022, then lagged sharply in 2023 as mega-cap technology concentration in cap-weighted benchmarks rewarded a narrow cohort of stocks that quality screens would typically underweight.
Morningstar also flagged that sector and country concentration risk remains a consideration even within quality-screened portfolios, a caution particularly relevant for single-country funds like IIND.
The distinction that matters is between quality underperforming during a speculative rally (which is a feature of the factor’s risk-management design) and quality underperforming because the factor itself is structurally challenged. The former is expected and temporary. The latter would require evidence of a sustained breakdown in the relationship between financial quality and long-term returns, which the data does not currently support.
Neither QLTY nor IIND is designed as a whole-of-portfolio solution. QLTY’s ex-Australia structure makes it a natural complement to domestic equity holdings, while IIND represents a concentrated geographic bet that carries meaningfully higher volatility. Both function best as components within a diversified international allocation rather than standalone positions.
The fee premium for quality screening is real. Whether it is justified depends on what the screen delivers over a full cycle.
| Strategy type | Approximate MER |
|---|---|
| QLTY (global quality-screened) | 0.35% p.a. |
| IIND (India quality-screened) | 0.80% p.a. |
| Broad global developed ETF (indicative range) | 0.18-0.25% p.a. |
MER figures for QLTY and IIND sourced from Betashares PDS and current factsheets. Broad global developed ETF range is indicative; precise figures require referencing current issuer PDS documents.
QLTY’s 0.35% sits 0.10-0.17 percentage points above the broad global developed ETF range. For a quality screen that has delivered 12.93% annualised since inception, the premium is modest relative to the return differential.
IIND’s 0.80% is a higher hurdle. The additional cost reflects the operational complexity of implementing a quality-screened, single-country emerging market strategy, but it also means the quality filter must deliver measurable risk-reduction benefit to justify its cost against the fund’s actual multi-year return sequence. A 3-year annualised return of 0.90% at a 0.80% fee warrants scrutiny.
The fee premium over plain-vanilla ETFs should be evaluated against multi-year risk-adjusted returns, not trailing 12-month figures. S&P 500-tracking ETFs on the ASX sit in the 0.03-0.10% range, providing a useful lower-cost reference point for investors weighing how much they are willing to pay for screening discipline.
The analytical layers covered above consolidate into five evaluation criteria applicable to any quality-screened ETF, not just QLTY and IIND.
Fund screening before performance data becomes the focus is the approach professional analysts use: Morningstar’s three-pillar framework evaluating people, process, and parent quality has demonstrably separated its top-rated funds from negatively rated ones over five-year horizons, providing a structural complement to the return-focused evaluation framework this article applies.
This framework applies to any ASX-listed quality or factor ETF. Investors can return to it when assessing new launches or reconsidering existing holdings.
Quality screening does not eliminate volatility. IIND’s 2025-2026 return sequence removes any doubt on that point. What it does is apply systematic financial discipline, filtering for profitability, balance sheet strength, and capital efficiency, that broad market-cap weighting does not provide.
The trade-off is honest. Quality ETFs sit above plain-vanilla index funds in cost and below active managers. The value proposition depends on whether the filter improves risk-adjusted outcomes over the investor’s specific time horizon.
QLTY and IIND are not equivalent products despite sharing a quality framework. One offers diversified developed-market exposure with a multi-year track record that has weathered multiple market regimes. The other offers concentrated emerging market access with higher fees and higher volatility. Investors should assess each against their portfolio goals, time horizon, and tolerance for geographic concentration risk.
For Australian investors ready to move from fund evaluation to portfolio design, our dedicated guide to ETF portfolio construction covers how to determine the right split between domestic and international equity, how cap-weighted concentration in the ASX 200 affects a whole-of-portfolio view, and how to maintain a disciplined allocation across market cycles without triggering unnecessary tax events.
This article is for informational purposes only and should not be considered financial advice. Investors should conduct their own research and consult with financial professionals before making investment decisions. Past performance does not guarantee future results.
Current performance data, holdings, and fee disclosures are available in the Betashares PDS documents and monthly factsheets for both QLTY and IIND, which should be consulted before making any allocation decisions.
A quality ETF applies rules-based financial filters, typically screening for high return on equity, strong balance sheets, and resilient profit margins, before allocating capital, whereas a standard index ETF weights holdings purely by market capitalisation regardless of profitability or leverage.
The Betashares Global Quality Leaders ETF (QLTY) has delivered an annualised return of 12.93% since its inception on 5 November 2018, covering multiple bear markets and recoveries, though its 1-year return to 30 April 2026 was a more modest 4.70%.
Strong GDP growth does not automatically translate into equity returns; India-specific risks including valuation pressures after prior gains, concentration in large conglomerates, and election-driven policy volatility contributed to IIND's 1-year return of -19.13% to 30 April 2026 despite positive macroeconomic forecasts.
QLTY charges a management expense ratio of 0.35% per annum and IIND charges 0.80% per annum, compared to an indicative range of 0.18-0.25% for broad global developed market ETFs and as low as 0.03-0.10% for S&P 500-tracking ETFs on the ASX.
Quality ETFs typically lag during early-cycle recoveries, speculative risk-on rallies, and narrow technology-driven episodes where low-profit, high-beta stocks lead returns, because quality screens systematically underweight the kinds of companies that outperform in those conditions.