Investing During Inflation: Portfolio Strategies for 2026
42 mins ago

Parsons Corporation delivered a striking contrast to the market on Wednesday, reporting an overall contraction in quarterly sales alongside a historic surge in profitability margins. These Q1 2026 results arrived on April 29, 2026, serving as a redemption moment after the defence contractor missed Wall Street expectations in the previous quarter.
The latest PSN earnings report offers a clear breakdown of how operational efficiency and a massive new order pipeline are protecting the company’s bottom line. By separating the immediate top-line shock from the underlying mechanical drivers, the data provides a complete picture of corporate health.
Investors looking at the headline revenue decline can find reassurance in the underlying metrics. The market reaction indicates that operational execution is currently carrying more weight than total sales volume.
The central tension of the first-quarter report lies in the company achieving higher earnings despite a drop in total sales. Parsons reported adjusted earnings per share of $0.79, decisively outperforming pre-release analyst estimates that ranged from $0.59 to $0.69. This bottom-line victory contrasts directly with the annual revenue decline, establishing operational efficiency as the primary financial narrative.
Analyst coverage capturing pre-earnings market consensus expectations highlighted significant growth concerns leading into the report, which makes the profitability beat a notable deviation from anticipated trends.
Total quarterly sales landed at $1.5 billion, representing a 4 percent annual drop that largely aligned with prior market previews. However, the underlying organic growth metrics tell a different story when adjusted for specific confidential agreements. According to company data, excluding a classified contract, the company achieved a top-line growth rate of 8 percent.
Investors need to see that the earnings beat was driven by operational success rather than accounting anomalies. These adjusted figures prove the stock’s resilience, demonstrating that management can extract higher profits in a tight revenue environment.
| Metric | Q1 2026 Actual | Analyst Consensus |
|---|---|---|
| Adjusted EPS | $0.79 | $0.59 to $0.69 |
| Total Sales | $1.5 billion | Sequential decline expected |
| Top-Line Growth (Ex-Classified) | According to company data, 8 percent | N/A |
Moving beyond the headline numbers, the mechanical drivers behind the earnings beat reveal how the company constructed its historic profitability. Parsons delivered an adjusted EBITDA margin of 10.1 percent, which marks a 50 basis point increase year-on-year. According to company data, this expansion generated an adjusted EBITDA of $151 million for the quarter.
The financial improvements extended to cash management, with the company recording significant progress in first-quarter cash utilisation. According to company data, operational cash utilisation improved to $4 million, a clear recovery from the negative $12 million recorded in the prior year. This demonstrates the company’s ability to extract more value from existing contracts, a highly important indicator of management competence and margin safety.
Maintaining margin safety is particularly critical when energy shocks and rising business input costs threaten to erode the profitability of long-term government infrastructure projects.
“Our first quarter results highlighted the resilience of our business and our team’s high level of execution, as we delivered our highest adjusted EBITDA margin ever, reached record levels for both total and funded backlog, achieved a robust book-to-bill ratio of 1.4x in both segments, and generated record first quarter cash flow,” said Carey Smith, Chief Executive Officer.
Before examining specific forward projections, it is helpful to understand the structural mechanics of defence contracting. Government and infrastructure contractors evaluate their future stability using specialised pipeline metrics that transform abstract billions into concrete indicators of future revenue. Equipping novice investors with this technical vocabulary is necessary for accurately evaluating defence stocks.
A healthy order pipeline separates guaranteed government funding from potential future work. Industry standards suggest that maintaining a book-to-bill ratio above 1.0x is required for long-term revenue predictability, as it proves a company is winning more work than it is currently completing.
The three terms used to measure this forward-looking stability include:
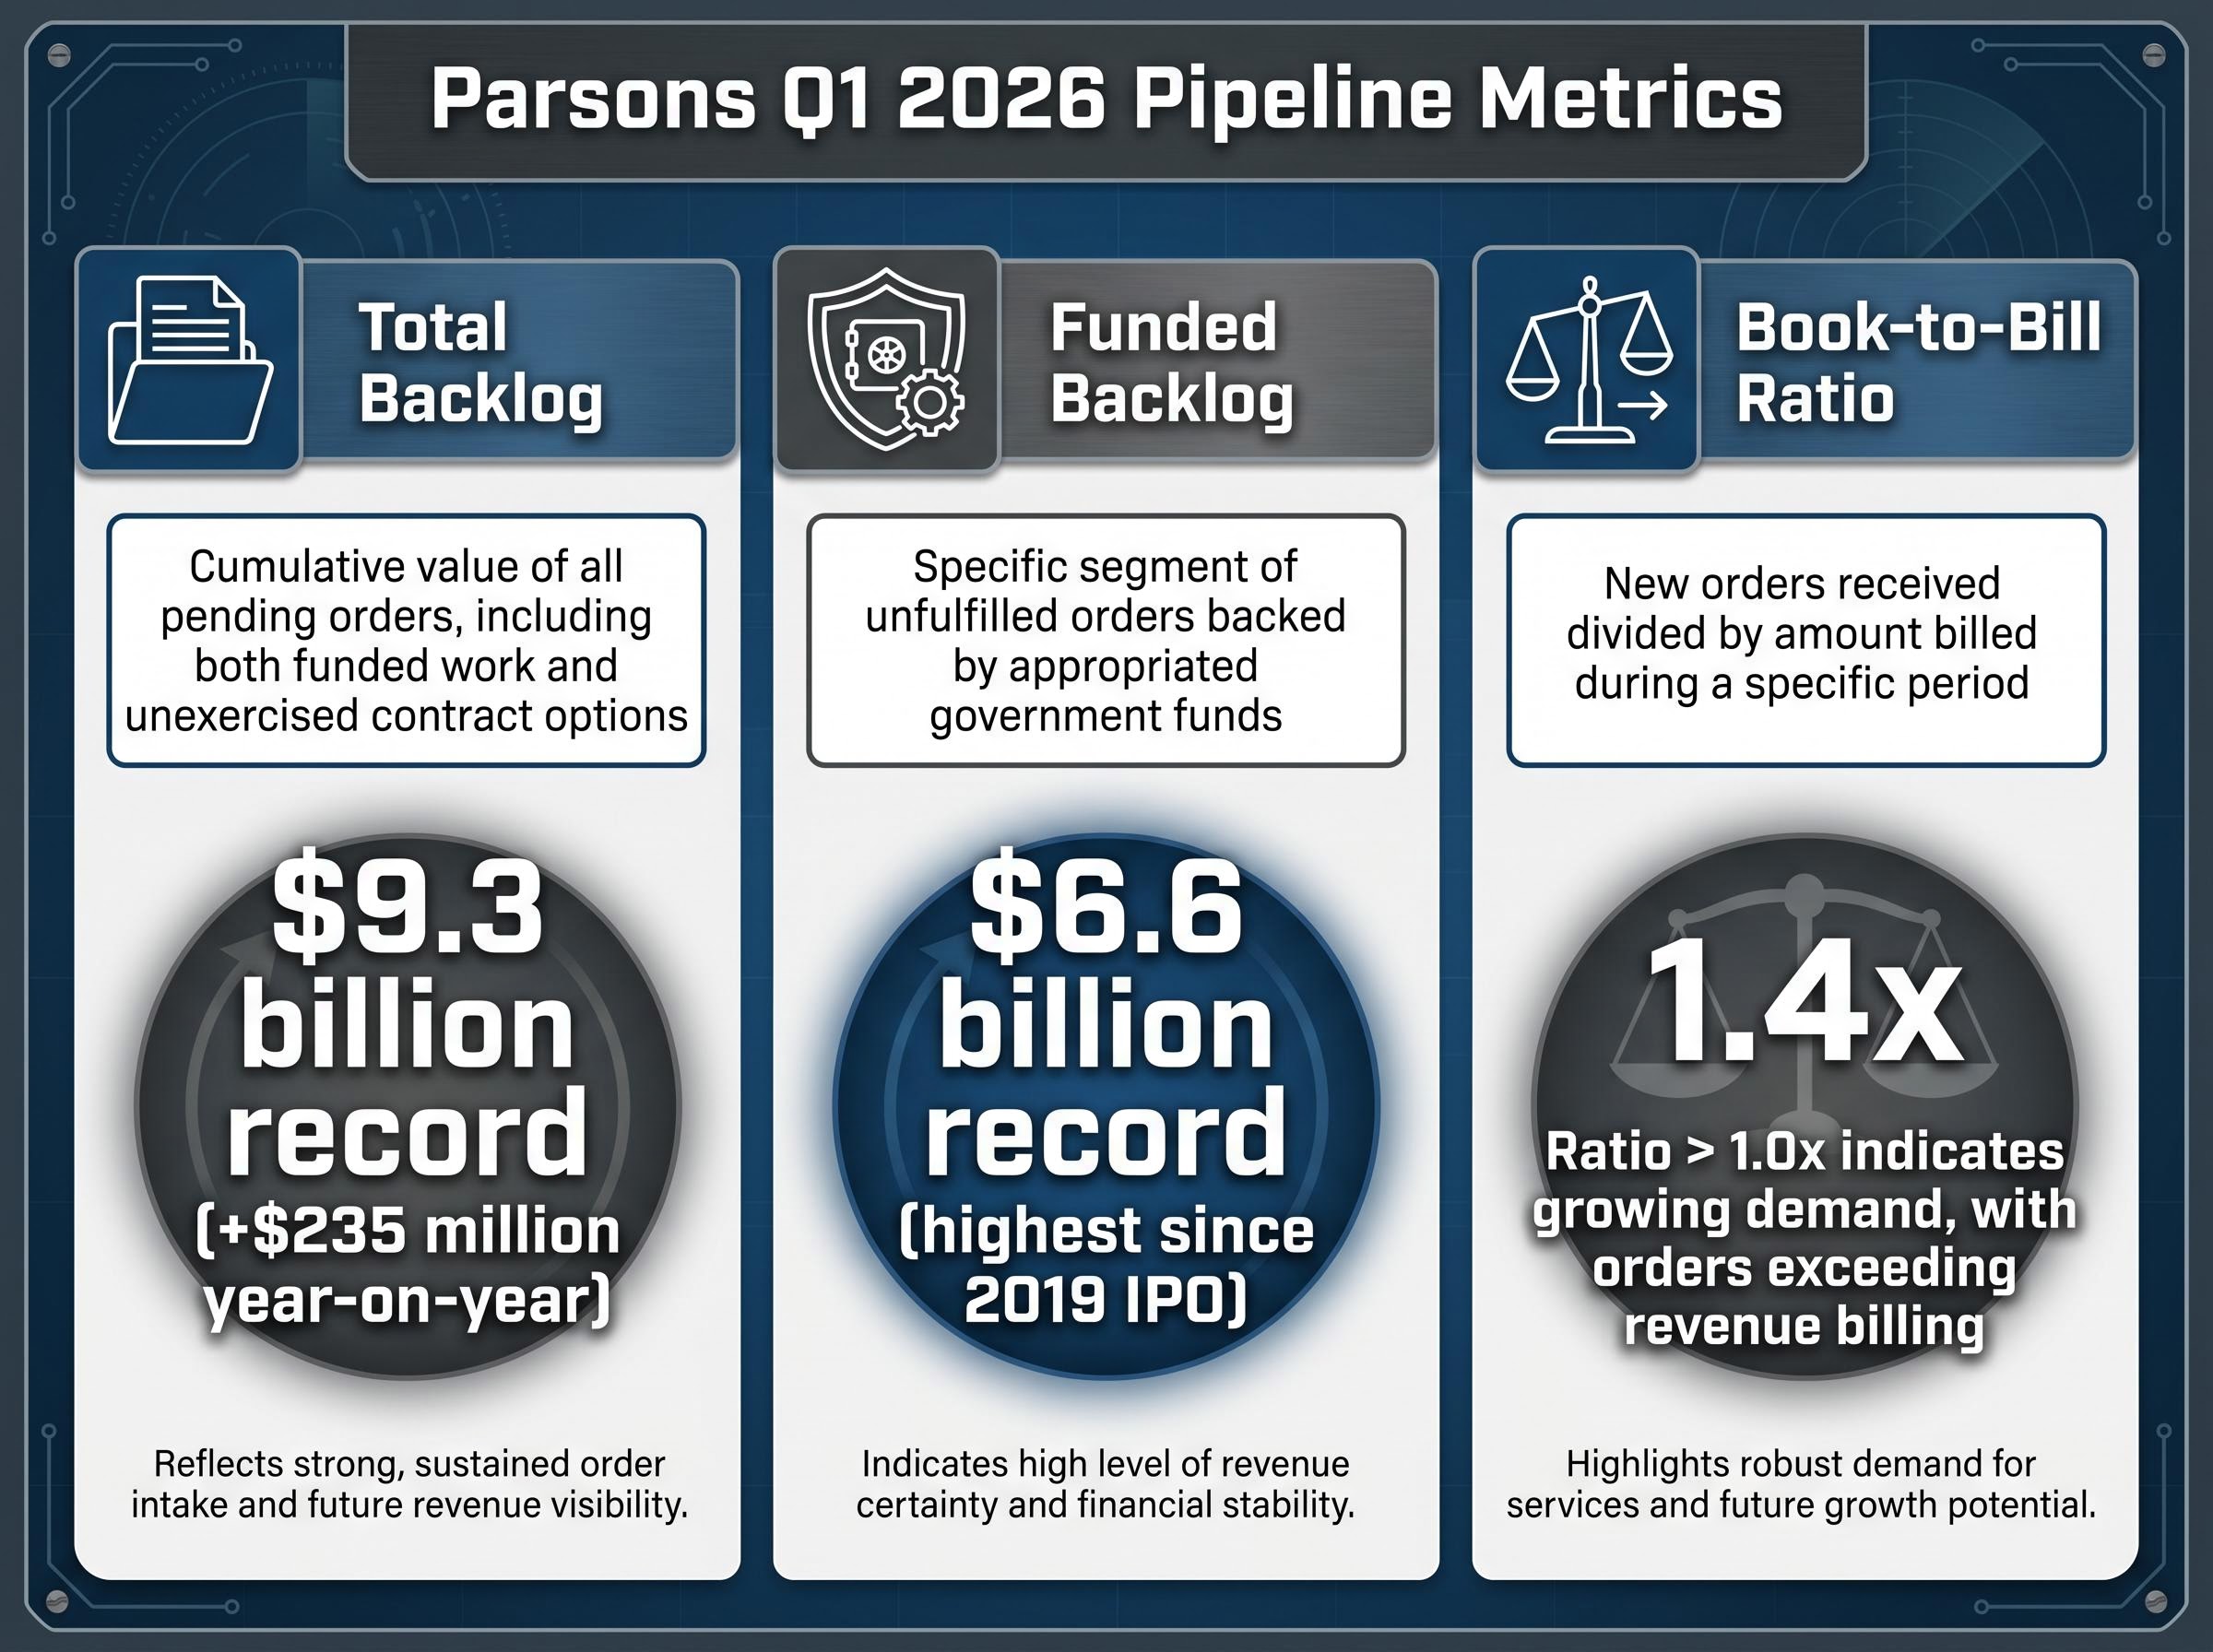
Total Backlog: The cumulative value of all pending orders, including both funded work and unexercised contract options. Funded Backlog: The specific segment of unfulfilled orders backed by appropriated government funds. * Book-to-Bill Ratio: A metric calculated by dividing new orders received by the amount billed during a specific period.
For investors wanting to explore the specific mechanics behind the earnings beat, our comprehensive walkthrough of Parsons’ Q1 performance examines the 1.4x book-to-bill ratio and the underlying 20 percent net income drop that the adjusted figures overshadowed.
Shifting focus from past performance to future security, the massive backlog figures establish a clear narrative of long-term operational stability. Parsons acquired a significant influx of new orders across its business segments during the first quarter, pushing cumulative pending orders to a record $9.3 billion. This represents a $235 million year-on-year increase.
According to company data, the financed segment of these unfulfilled orders reached a record $6.6 billion, marking the highest funded backlog since the company’s 2019 initial public offering. Furthermore, the company recorded a book-to-bill metric of 1.4x across both of its operational divisions. This proves that the contractor is replacing completed work significantly faster than it is burning through it.
This expanded pipeline directly supports management’s decision to maintain their full-year financial guidance. According to company data, the company projects top-line revenue for the year to land between $6.5 billion and $6.8 billion.
According to company data, the median of this corporate sales forecast sits at $6.65 billion, which falls just under the $6.665 billion market expectation. However, the sheer size of the newly secured backlog mitigates the risk associated with this slightly conservative guidance. The secured pipeline provides high visibility into future earnings, insulating the company against short-term procurement delays.
Past performance does not guarantee future results. Financial projections are subject to market conditions and various risk factors.
The immediate pre-market trading reaction served as a decisive vote of confidence from institutional investors. Prior to the market opening on April 29, 2026, equity values for Parsons climbed 3.15 percent to $53.49. The combination of record margins and expanding backlog successfully overshadowed the annual revenue decline.
This strong institutional support is particularly notable given the material earnings pressure impacting the broader market, as elevated fuel costs force capital toward companies with high revenue visibility.
This positive reception stands in sharp contrast to the cautious sentiment that followed the fourth-quarter 2025 earnings release. In that previous quarter, adjusted EPS came in at $0.75, missing the analyst estimates of $0.80 and triggering a cautious market response.

The day’s price action frames this morning surge as a potential resumption of a longer-term growth trend rather than a short-term anomaly. As the market digests these figures, the upcoming management conference call is expected to further influence analyst price targets.
This article is for informational purposes only and should not be considered financial advice. Investors should conduct their own research and consult with financial professionals before making investment decisions.
Parsons Corporation reported adjusted earnings per share of $0.79, exceeding analyst estimates, alongside an adjusted EBITDA margin of 10.1 percent. This strong bottom-line performance occurred despite a 4 percent decline in total sales.
The company achieved higher profitability through enhanced operational efficiency and effective cash management. This resulted in its highest adjusted EBITDA margin ever and improved operational cash utilization.
A book-to-bill ratio divides new orders by billed revenue, indicating whether a company is winning more work than it completes. For defence contractors like Parsons, a ratio above 1.0x signals long-term revenue predictability and stability.
Parsons reported a record total backlog of $9.3 billion and a funded backlog of $6.6 billion in Q1 2026. This extensive pipeline provides high visibility into future earnings and strengthens the company's long-term operational stability.
Yes, Parsons decisively outperformed analyst estimates for adjusted EPS, reporting $0.79 against a consensus range of $0.59 to $0.69. Total sales of $1.5 billion largely aligned with expectations for a sequential decline.