Palantir just delivered one of the strongest software earnings reports in recent memory. Q2 2026 achieved simultaneous records in commercial revenue growth, operating margins, free cash flow, and net revenue retention. Shares jumped by more than 10% on the news.
The instinct is to treat that as a green light. The more productive question is not whether Q2 was good (it was) but what that kind of performance is already worth at the current price.
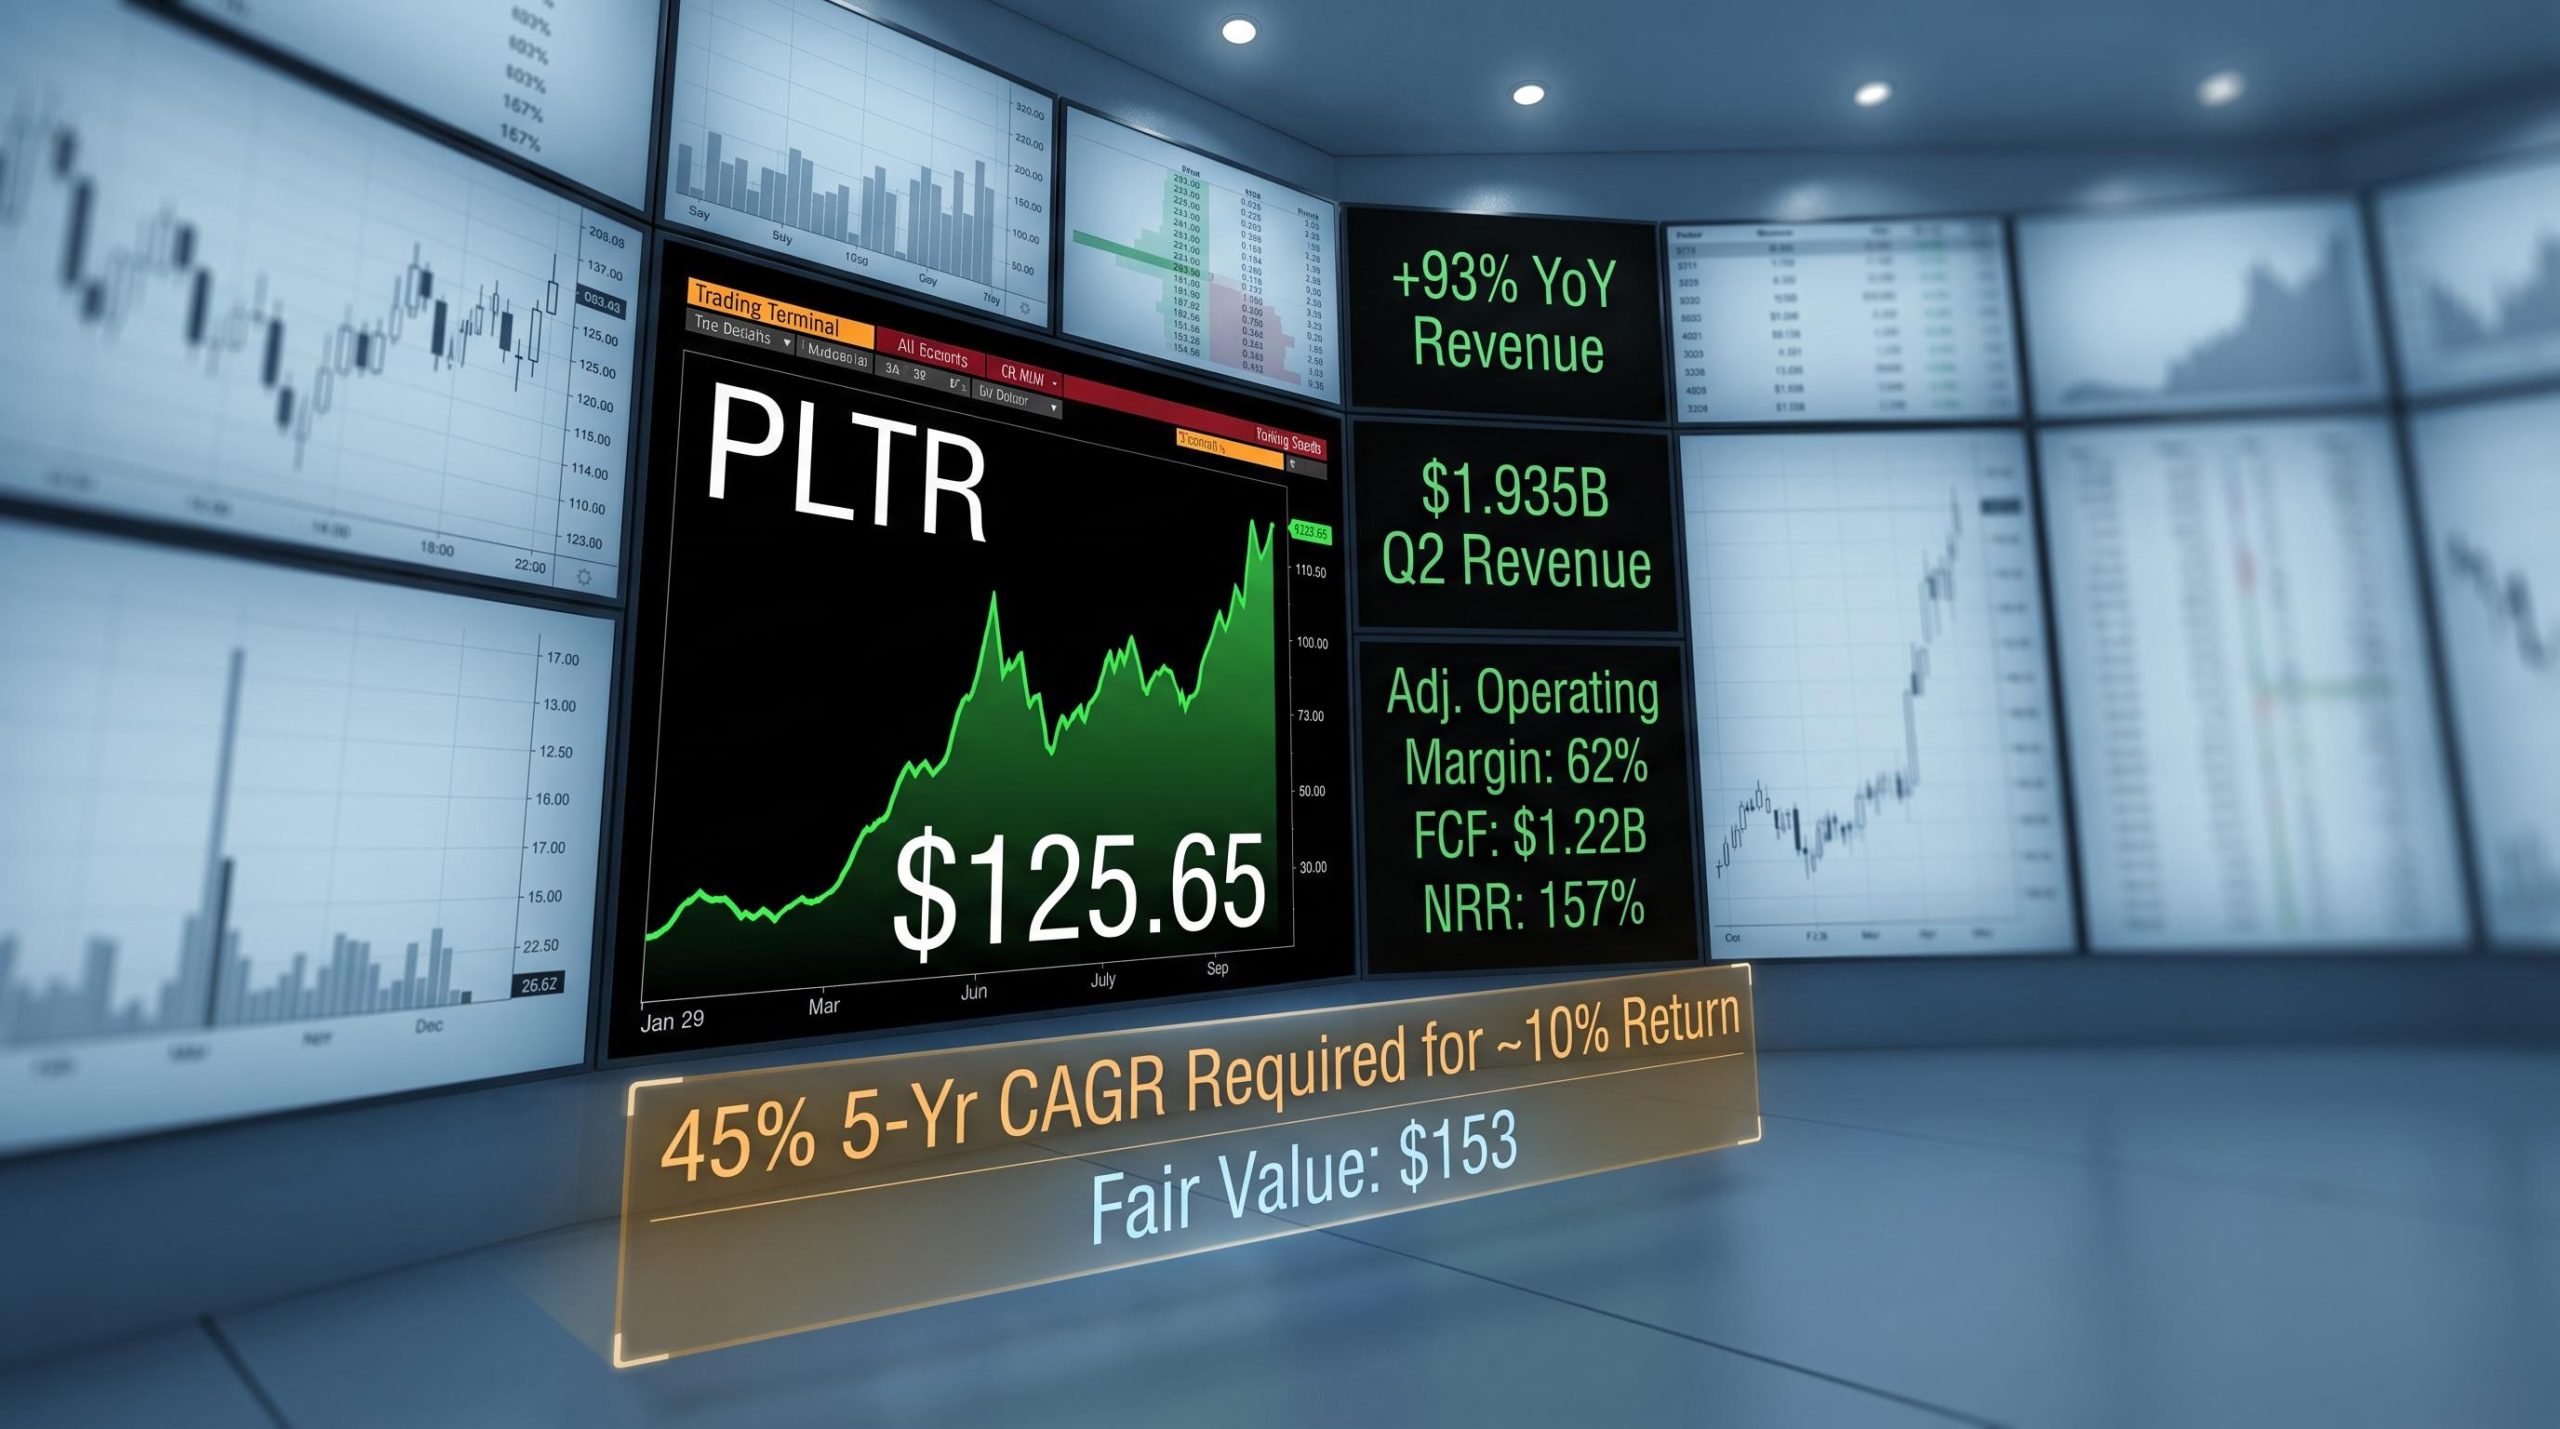
Morningstar rates the stock 3 stars at roughly $125.65 per share, a fair value signal that suggests the current price already reflects a substantial portion of the company’s growth story. Management raised full-year guidance to at least 82% overall revenue growth and 134% U.S. commercial revenue growth. These are extraordinary figures. The question is whether they are extraordinary enough to justify what the price is asking you to believe about the next five years.
Here is a clear framework for evaluating that question, built on the actual numbers and Morningstar’s valuation analysis, not sentiment. You will know exactly what growth trajectory you are underwriting if you buy at this price.
Record metrics on every dimension: what Q2 2026 actually delivered
Start with the headline: $1.935 billion in total revenue, up 93% year over year and 19% sequentially. U.S. revenue hit $1.573 billion, up 115% year over year, accounting for roughly 81% of the total. The U.S. commercial segment alone generated $764 million, up 149% year over year at a record rate and 28% sequentially. U.S. government revenue reached $809 million, up 90% year over year, also a record.
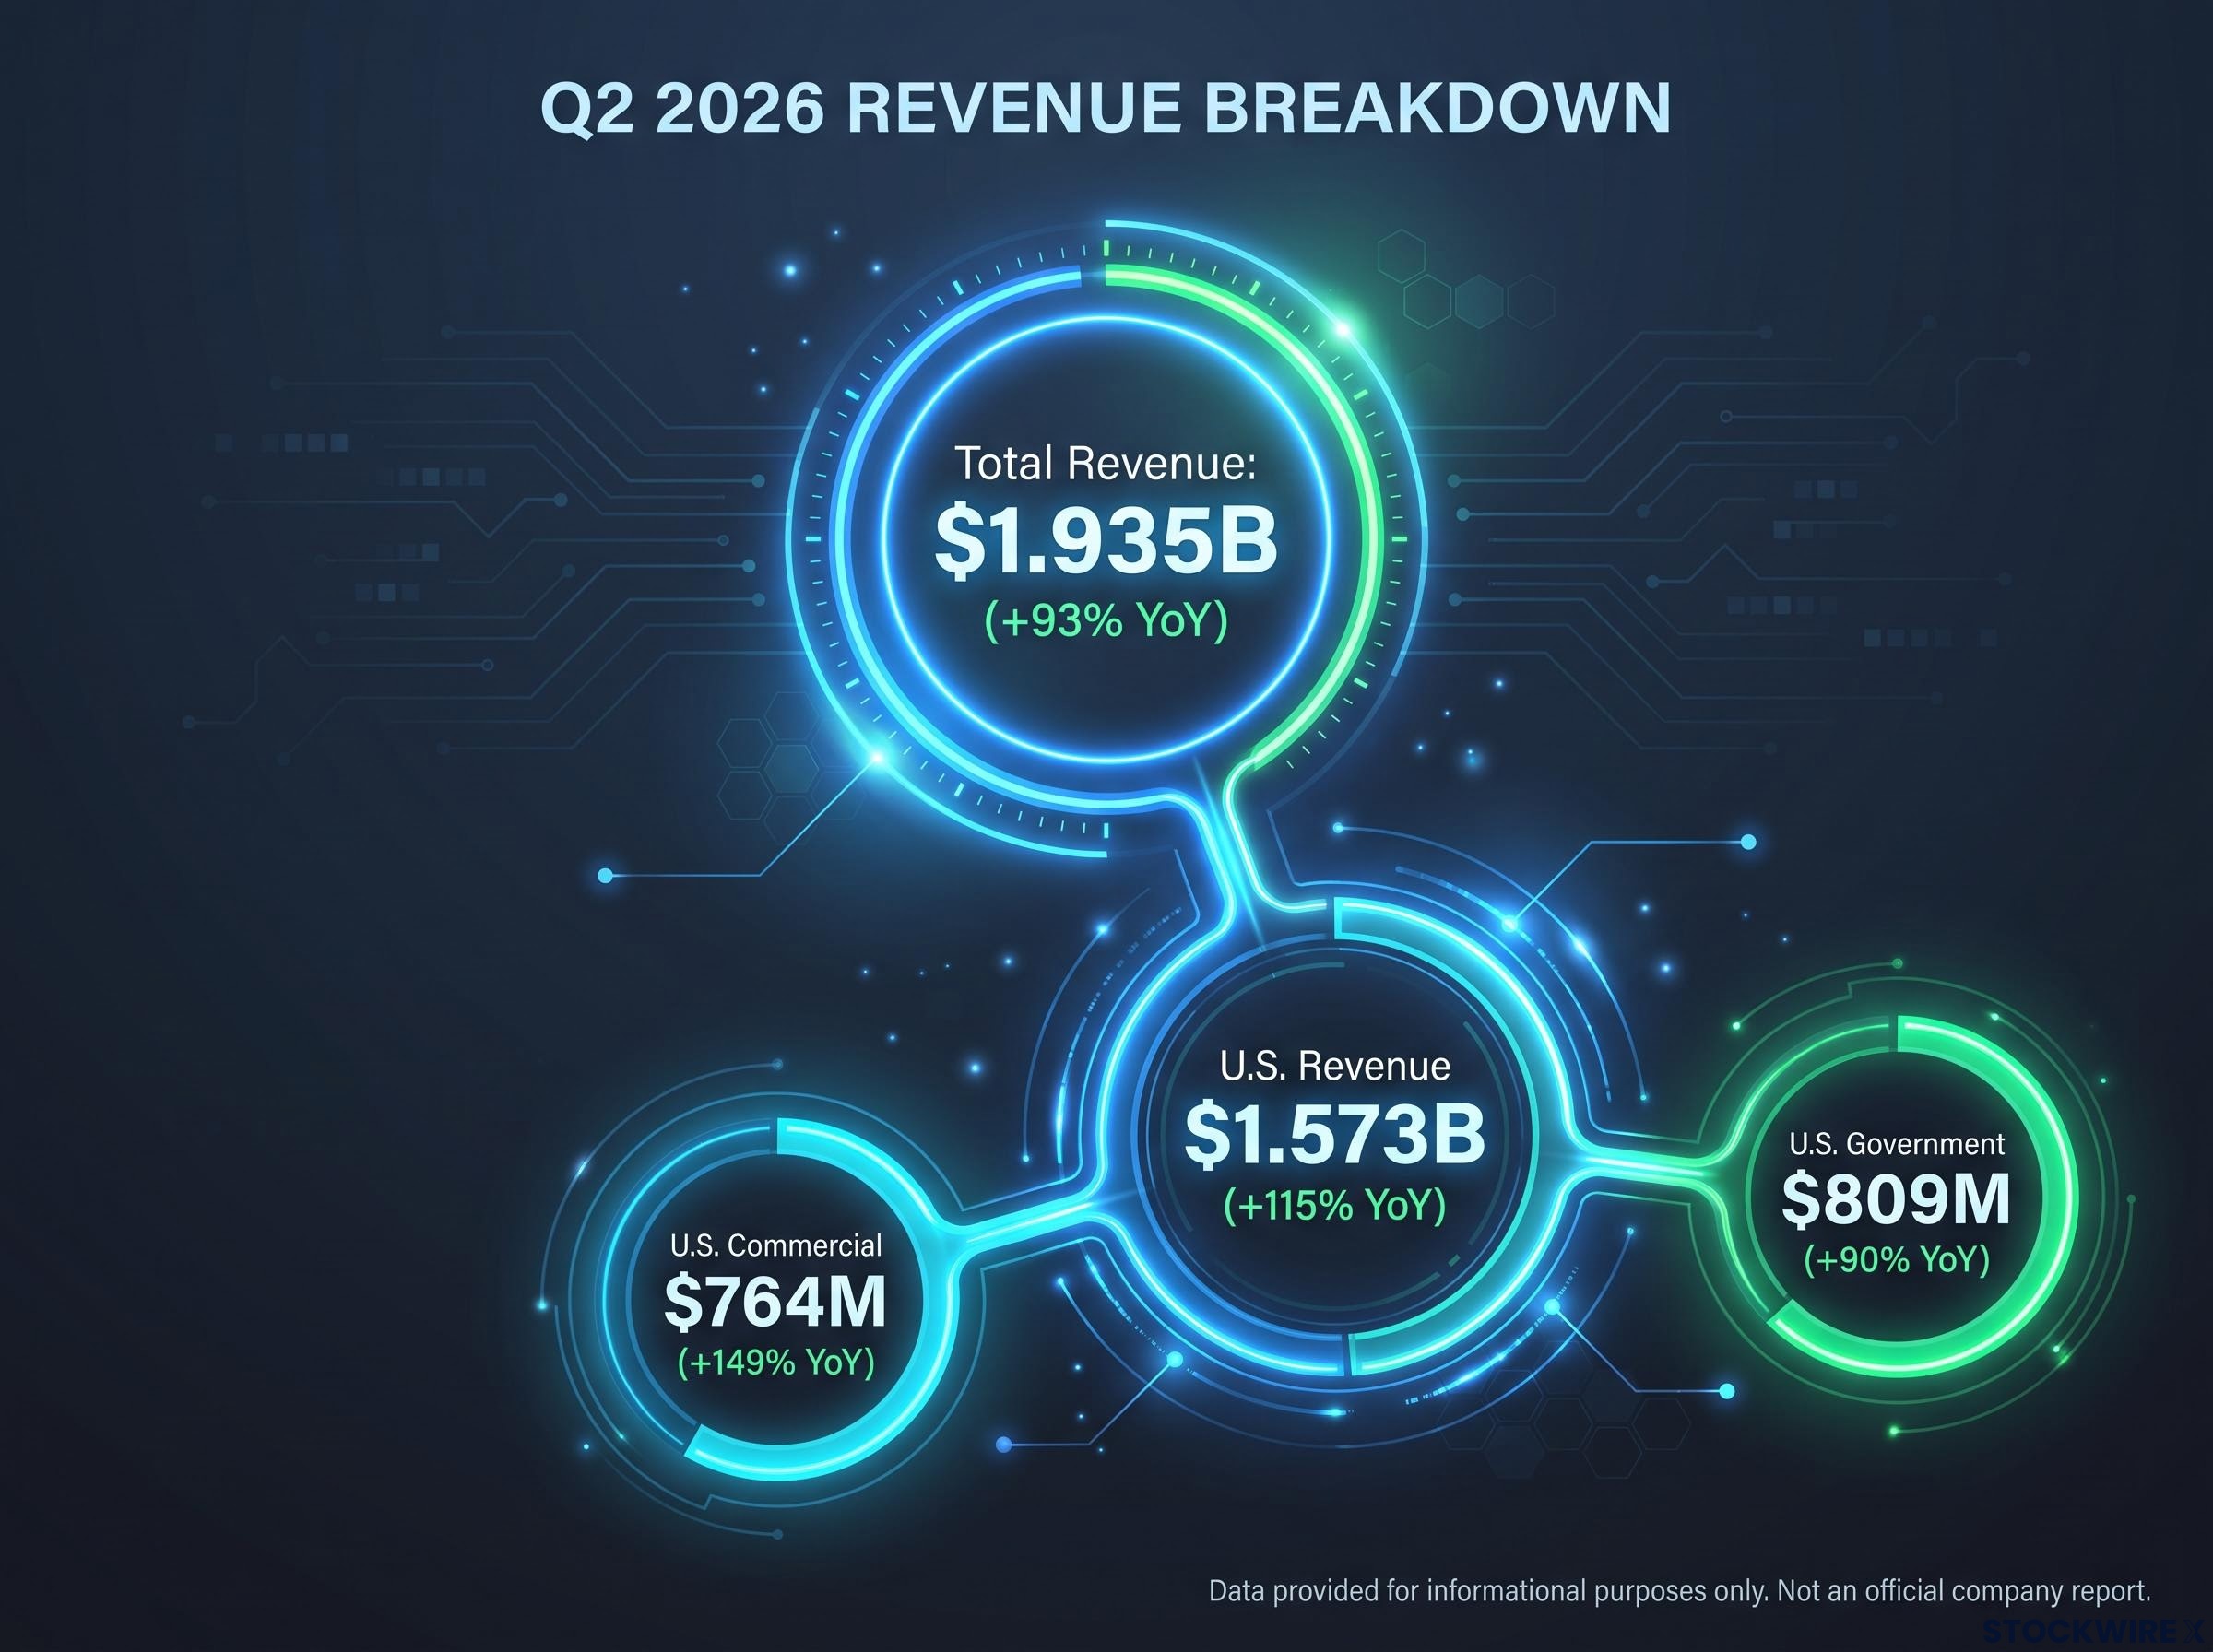
The profitability story is just as striking, and it operates on its own terms. GAAP operating margin came in at 47%. Adjusted operating margin reached a new peak of 62%, an all-time high for the company. GAAP net income reached $1.062 billion, a 55% net margin. Adjusted free cash flow was $1.22 billion at a 63% margin, up 115% year over year.
| Metric | Q2 2026 Value | Year-over-Year Change |
|---|---|---|
| Total Revenue | $1.935B | +93% |
| U.S. Revenue | $1.573B | +115% |
| U.S. Commercial Revenue | $764M | +149% |
| U.S. Government Revenue | $809M | +90% |
| GAAP Operating Margin | 47% | All-time high (adjusted: 62%) |
| Adjusted FCF Margin | 63% | +115% |
| Net Revenue Retention | 157% | Record |
| Rule of 40 Score | 155 | — |
The synthesis metric is the Rule of 40 score.
Rule of 40 score: 155. This combines 93% revenue growth with an approximately 62% adjusted free cash flow margin. A score above 40 is considered strong in software. Palantir is nearly four times that threshold, placing it among the highest-performing software businesses in the public markets by this measure.
That score tells you something specific: Palantir is not trading profitability for growth or growth for profitability. It is doing both at once, at a level that very few public software companies have achieved simultaneously. Understanding the full scope of Q2 allows you to separate what the company has proven about its current business from what the price is asking you to believe about its future.
Rule of 40 scoring assigns equal weight to revenue growth rate and free cash flow margin, which is why Palantir’s combined score of 155 is analytically striking: only around 20% of public SaaS companies exceed the 40-point threshold at all, and scores above 50 command materially higher revenue multiples.
When big ASX news breaks, our subscribers know first
Net revenue retention at 157%: the figure that matters most for long-term investors
Net revenue retention (NRR) measures how much existing customers are spending compared to one year ago. A rate of 157% means that the customers Palantir had in Q2 2025 spent 57% more in Q2 2026 than they did a year earlier, before counting any new customers at all.
That distinction matters. Headline revenue growth of 93% combines two sources: expansion within existing accounts and revenue from brand-new customers. NRR isolates the first. It tells you how sticky and expansive the platform is once a customer has adopted it.
The 2026 SaaS NRR benchmarks for enterprise software show top-quartile performers typically in the 115-130% range, making Palantir’s 157% reading a result that sits meaningfully above even the strongest cohort in the broader market.
The coexistence of both signals simultaneously is the analytically meaningful point. U.S. commercial customer count grew 35% year over year (breadth), while existing customers expanded spending at a 157% rate (depth). Both are strong. But for evaluating durability, the depth signal carries more weight.
High NRR has three structural implications:
- Unit economics improve with time. Each customer relationship becomes more profitable as it matures, because the cost of acquiring and onboarding that customer is already spent.
- Switching costs compound. The more deeply a customer integrates Palantir into its operations, the harder it becomes to replace. That reinforces the moat.
- Reduced reliance on new logo acquisition. Revenue can grow even if the pace of new customer wins slows, because existing accounts keep expanding.
Why deep adoption signals something different than rapid customer growth
Rapid customer count growth is a leading indicator. It tells you the market is interested. High NRR is a durability indicator. It tells you the customers who arrived last year, or the year before, are becoming more committed, not less.
The more interesting question for an investor evaluating Palantir’s revenue trajectory is not how many new customers signed on in Q2. It is how much the customers from prior years are expanding their commitment. At 157%, the answer is: substantially. For an investor evaluating the durability of Palantir’s revenue, this figure is more reassuring than the headline growth rate because it signals the business is deepening inside customers who are already bought in, not just counting on new contract wins to sustain the trajectory.
What gives Palantir its edge, and how durable is it?
At the core of Palantir’s competitive advantage is its ontology framework, which functions as an organisation-specific operational model built by mapping and connecting an enterprise’s disparate data sources (procurement, logistics, finance, HR, operations) into a unified structure that supports workflow-level decision-making. The system does not merely analyse data. It supports automated, workflow-level decision-making tailored to how a specific organisation actually operates.
That customised mapping creates genuine switching costs. Replacing Palantir means more than swapping one analytics dashboard for another. It can require re-engineering mission-critical workflows built around the platform’s structure.
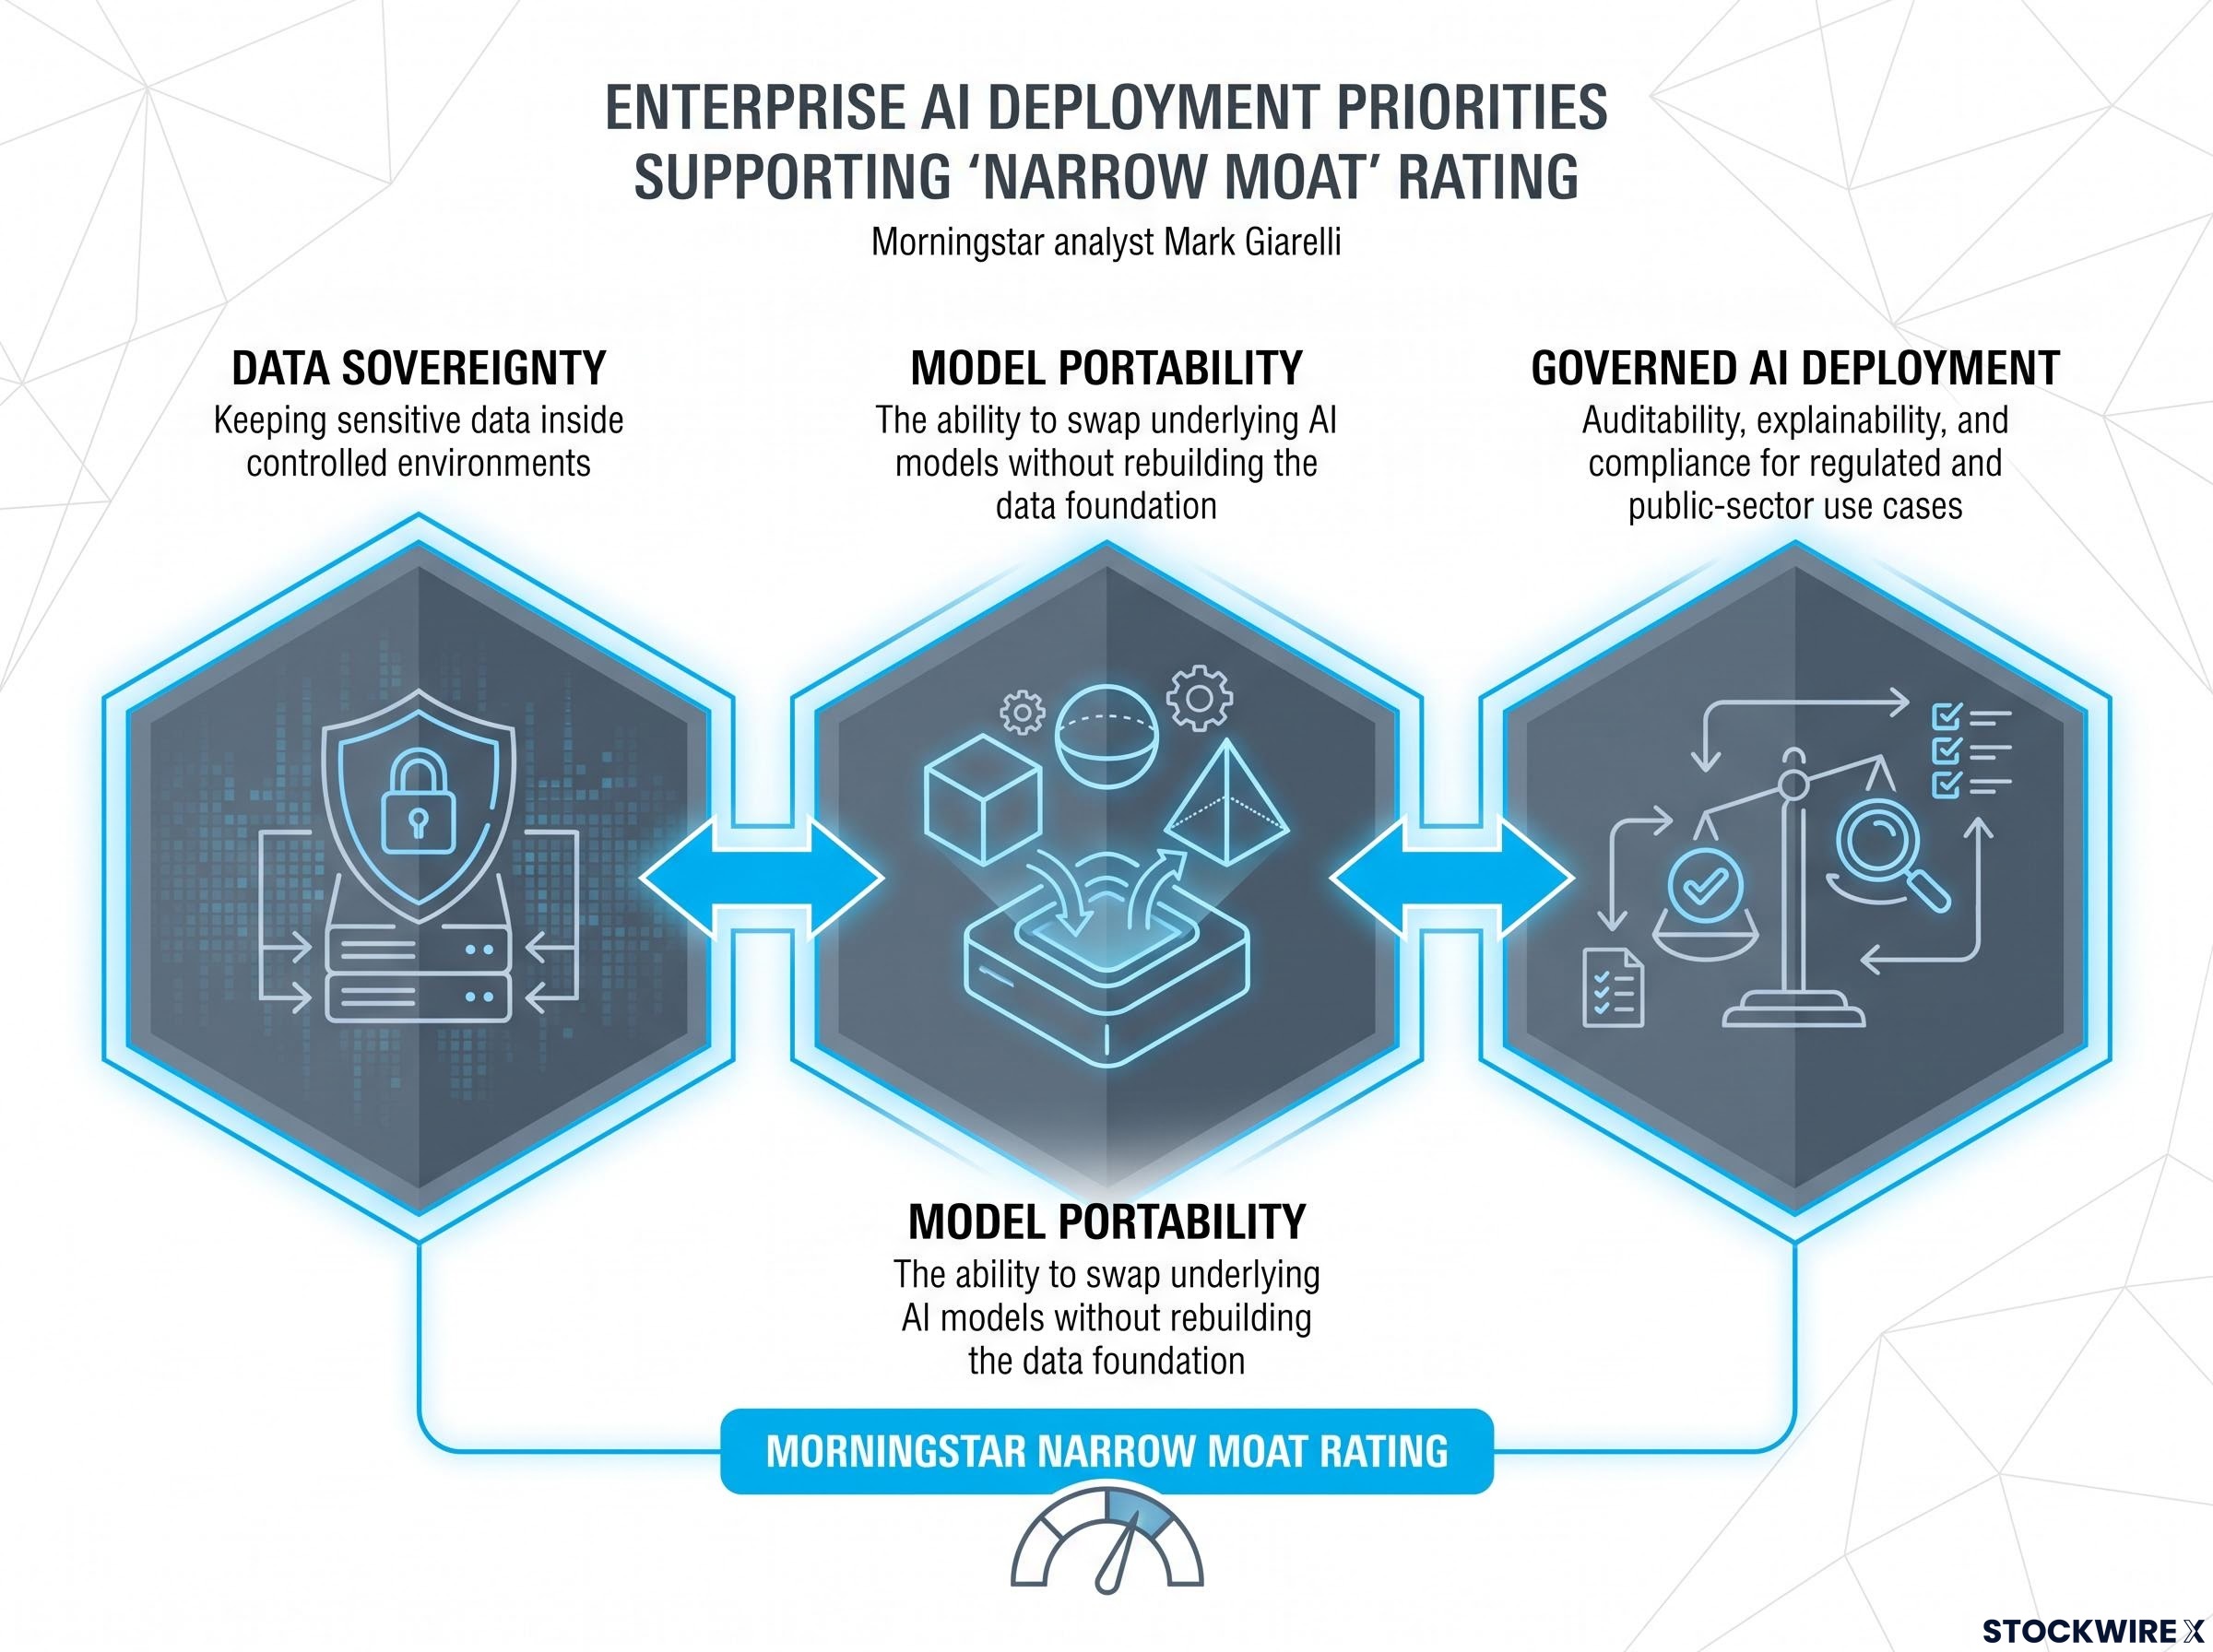
Morningstar equity analyst Mark Giarelli points to three priorities that enterprise and government customers are increasingly requiring from AI deployments, each of which reinforces Palantir’s position:
- Data sovereignty: Keeping sensitive data inside controlled environments
- Model portability: The ability to swap underlying AI models without rebuilding the data foundation
- Governed AI deployment: Auditability, explainability, and compliance for regulated and public-sector use cases
These priorities are front-of-mind for governments and large enterprise customers, and neither frontier AI models nor standard cloud infrastructure offerings readily satisfy all three requirements at once. According to Morningstar’s analysis, this gap is actively working in Palantir’s favour as enterprises seek AI deployments that meet these criteria.
What Narrow Moat means in practice, and what it does not guarantee
Morningstar assigns Palantir a Narrow Moat rating, rooted in the switching costs created by the ontology framework. The Narrow (not Wide) designation is a durability signal, not a certainty signal. It means the advantage is expected to hold over at least a decade, not that it is immune to disruption.
The primary factors Morningstar cites for withholding a Wide Moat rating are the rapidly advancing capabilities of AI models and increasing competitive density. Morningstar’s modelling assumes that revenue growth rates will moderate once the business moves beyond its 10-year forecast horizon. That tells you Palantir has a real, defensible advantage today, but the advantage is not wide enough to make the growth assumptions embedded in the current price feel low-risk over a multi-year horizon.
AI displacement risk across enterprise software is not uniform: vertical platforms with deep regulatory workflows and multi-year configuration histories are structurally harder to replace than horizontal analytical tools, a distinction that matters when evaluating whether Palantir’s ontology-based moat is durable or merely cyclically defensible.
The valuation reality: what growth rate does $125 actually demand?
Morningstar’s fair value estimate is $153 per share. With shares at approximately $125.65 as of 3 August 2026, the stock trades below that estimate but not at levels Morningstar would characterise as materially undervalued. The 3-star rating signals “approximately fairly valued,” not “clearly cheap.”
The embedded growth hurdle is where the arithmetic sharpens. Morningstar analyst Mark Giarelli’s analysis indicates that generating approximately a 10% annualised return from around $125 would require Palantir to deliver roughly 45% average annual revenue growth over a five-year horizon, with valuation multiples compressing over that same period.
The valuation contraction thesis has attracted notable institutional attention: Michael Burry maintained a short position after Q1 2026 results despite the earnings beat, a signal that the debate around Palantir’s multiple was already well-formed before Q2 numbers arrived.
The five-year bar: Maintaining roughly 45% average annual revenue growth across five consecutive years would rank Palantir among the top quintile of software companies by historical growth rate going back to 2010, a bar that relatively few businesses have ever cleared.
| Scenario | Assumed 5-Year CAGR | Implied Return from ~$125 | Morningstar Characterisation |
|---|---|---|---|
| Bull | 55%+ | Attractive upside | Today’s price proves conservative |
| Base | ~45% | ~10% annualised | Fairly valued (3 stars) |
| Bear | Below 35% | Mediocre to negative | Overvalued relative to delivered growth |
The gap between Q2’s 93% revenue growth and the 45% sustained rate required to earn a 10% return is the central tension. Q2 clears the bar easily. The question is whether the pace holds as the revenue base compounds and the comparison periods become harder. That is not a bearish argument. It is the arithmetic every investor at this price is implicitly underwriting.
Wide outcome range: why position sizing matters as much as the investment thesis
Morningstar assigns Palantir a Very High Uncertainty rating. This is a distribution-of-outcomes statement, not a negative verdict. Both the bullish and bearish scenarios are plausible, and the current price is not a failsafe against either extreme.
- Bull case: Palantir becomes the de facto operating system for AI deployment across governments and enterprises globally. In this outcome, today’s valuation proves conservative and the stock compounds from here.
- Bear case: Advances in general-purpose AI tooling narrow Palantir’s differentiation faster than expected, compressing both growth rates and margins. The moat holds structurally but the premium evaporates.
Two things can simultaneously be true: Palantir can have a real, defensible moat, and the distribution of plausible multi-year outcomes can still be very wide. That is what Very High Uncertainty captures. Even if the moat holds, the range of plausible outcomes is wide enough that position size is a risk management decision, not just a conviction decision.
The practical implication is a shift in the question. Instead of “should I own Palantir,” the more useful question is “how much Palantir is right for my portfolio.” A high-uncertainty, high-expectation compounder is not inherently uninvestable. It demands explicit sizing relative to your total portfolio risk tolerance and your confidence in a top-quintile growth outcome persisting.
A framework for the decision: validating your assumptions before you act
Q2 2026 largely settles one debate: Palantir is a great business. Differentiated platform, accelerating demand across both government and commercial, improving unit economics, and $1.22 billion in quarterly free cash flow. The unresolved question is whether the current price is right for you, specifically, because that depends on how much of the embedded growth path you are willing to underwrite.
Two tests, depending on where you sit:
- If you already hold Palantir: Does Q2 validate or challenge the thesis that underwrote your original position? If your thesis assumed sustained, very high growth, the quarter provides evidence the company is executing at or above that bar. The decision becomes portfolio management: is your current position size appropriate for a Very High Uncertainty holding?
- If you are considering a new position: Does the approximately 45% five-year growth requirement fit your own base case for the company? And if it does, is the position you are considering sized for the range of outcomes the Very High Uncertainty rating implies?
The reframe question: “What growth trajectory is the current price already assuming, and am I comfortable underwriting that path?”
The forward signal to watch is whether Q3 2026 and beyond show revenue growth beginning to decelerate from the 93% pace. That is when the embedded expectations in the current price face their first real test. Morningstar’s fair value sits at $153, the current price at approximately $125.65, and the stock carries a 3-star rating. The right question is not whether Q2 was good. It is whether your own assumptions about Palantir’s next five years are consistent with what the current price already requires, and whether your position size reflects the uncertainty involved.
Morningstar fair value methodology applies the same star-rating logic across high-uncertainty growth stocks: a 3-star rating signals approximate fair value rather than a buy signal, and the distance between market price and fair value estimate must be evaluated alongside the uncertainty tier assigned to each company, not treated as a standalone discount percentage.
This article is for informational purposes only and should not be considered financial advice. Investors should conduct their own research and consult with financial professionals before making investment decisions. Past performance does not guarantee future results. Financial projections are subject to market conditions and various risk factors.