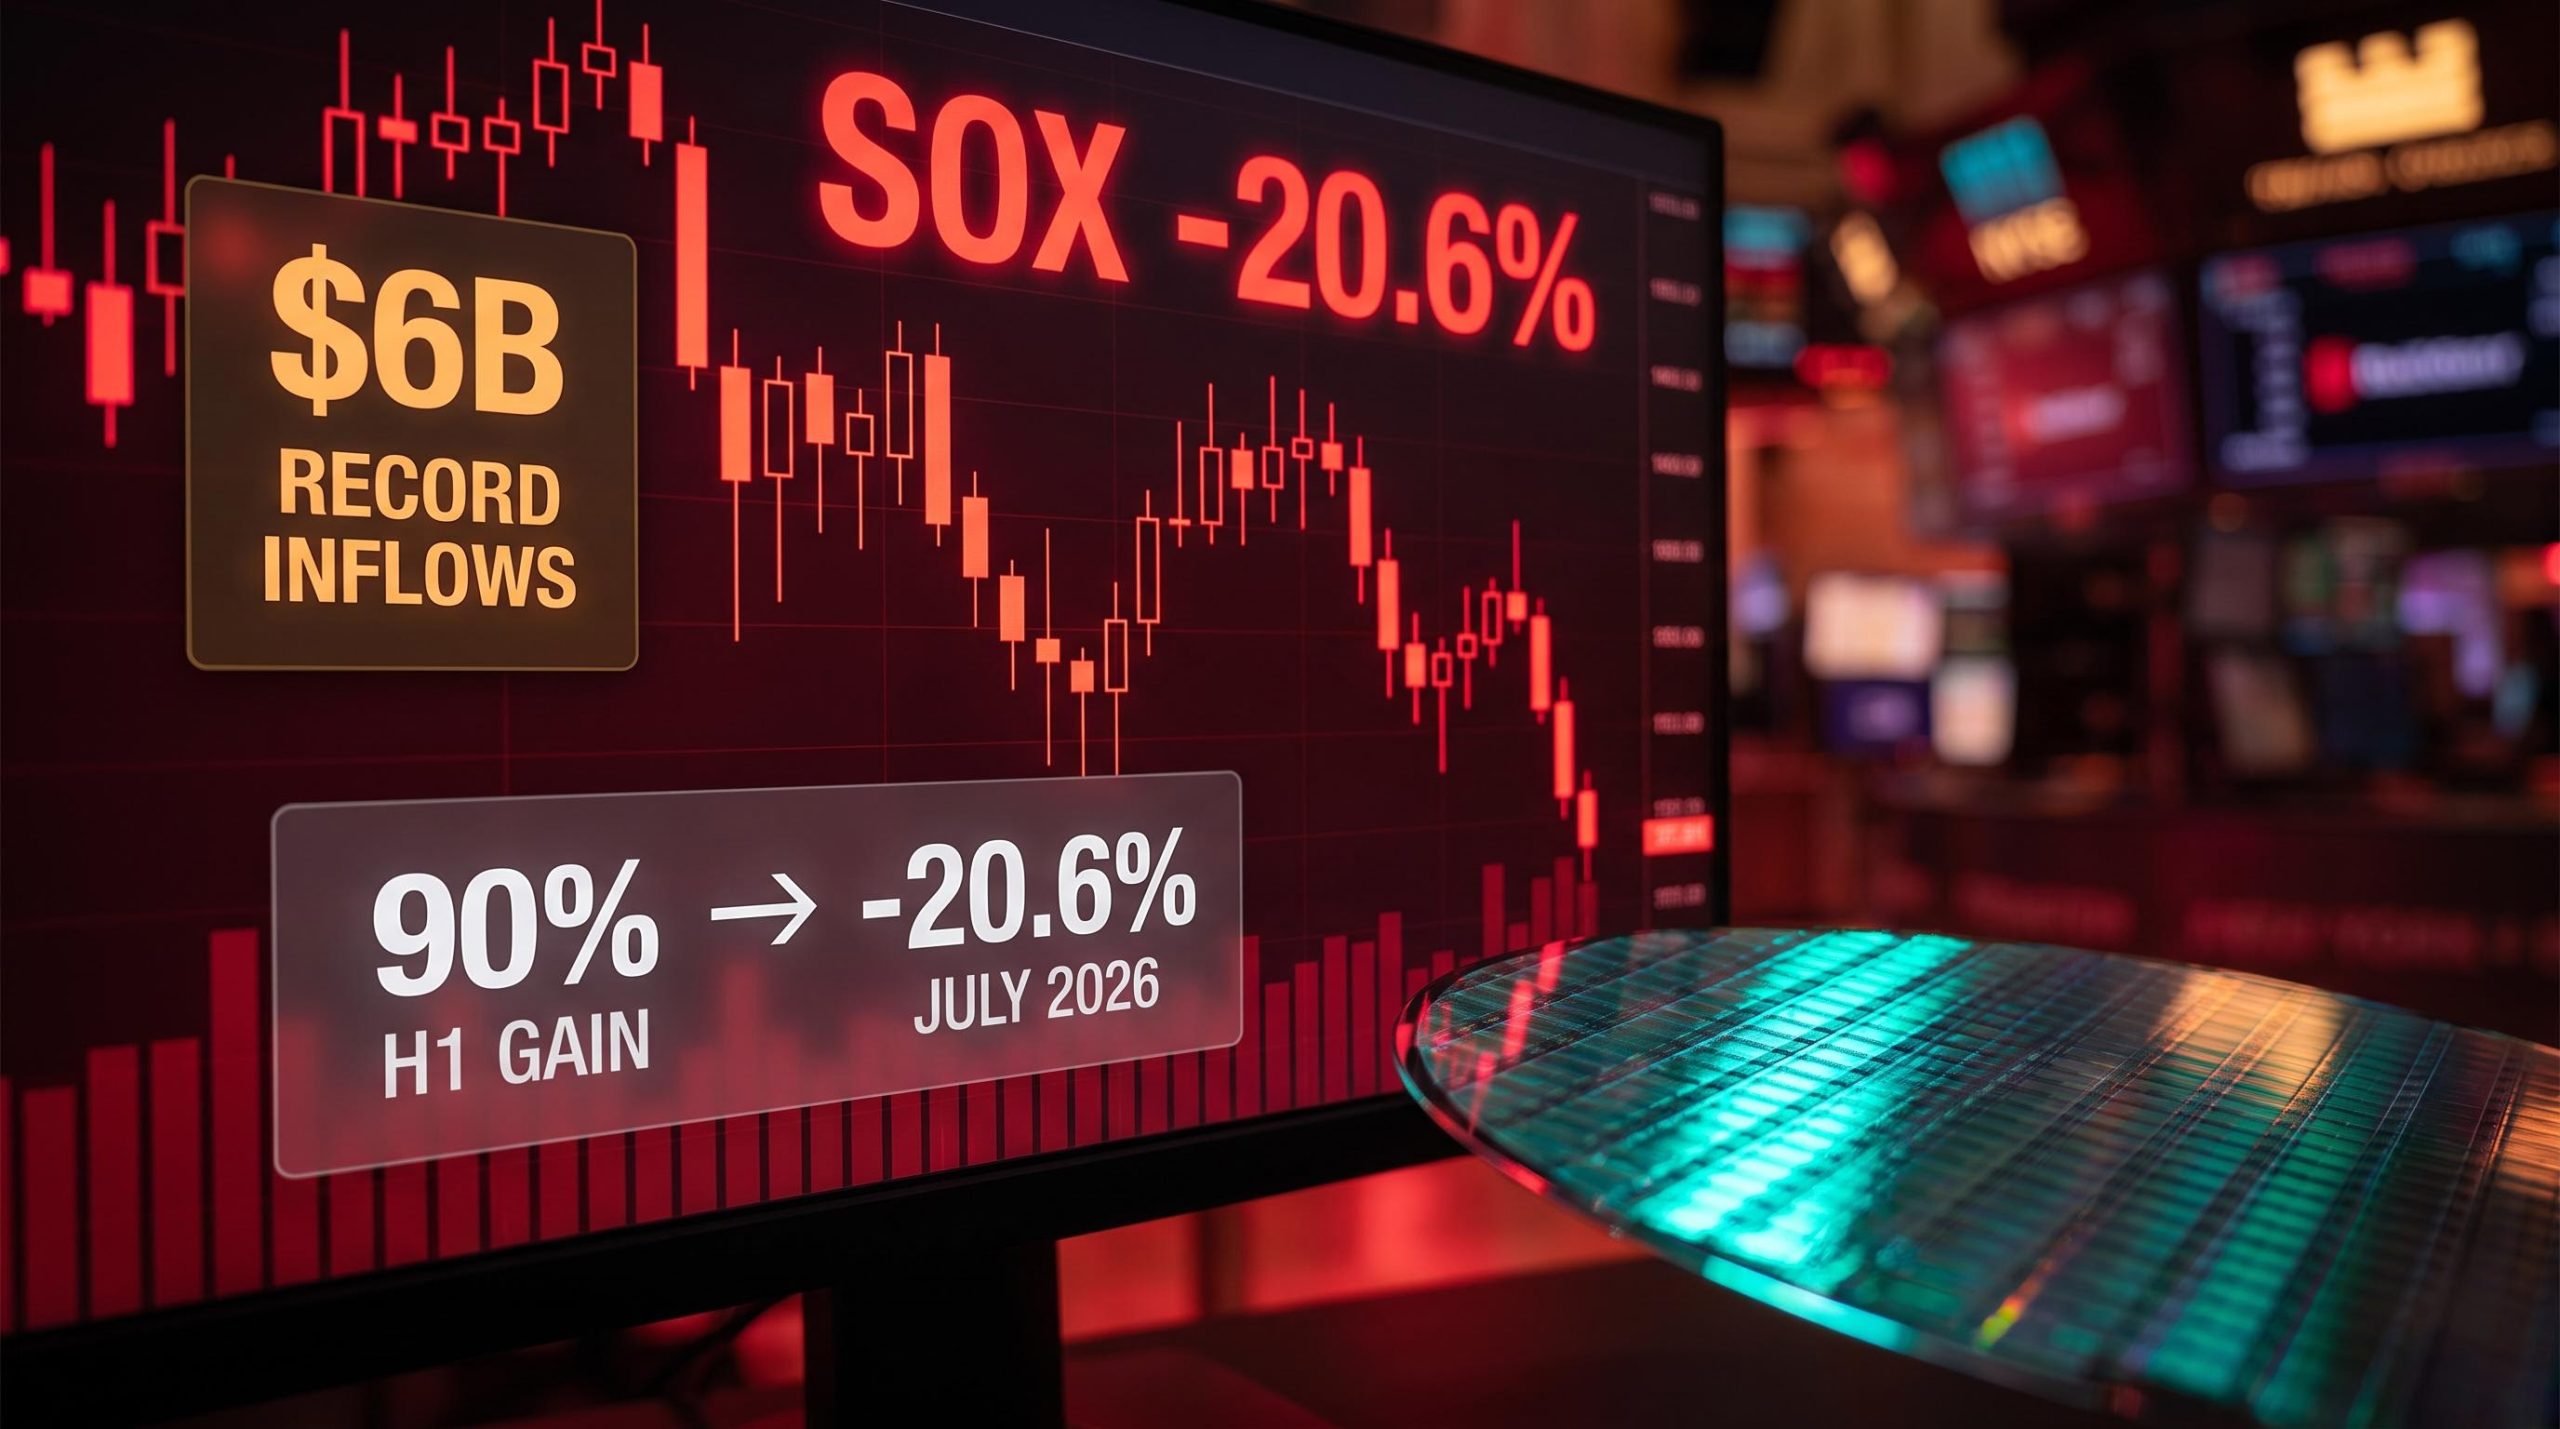
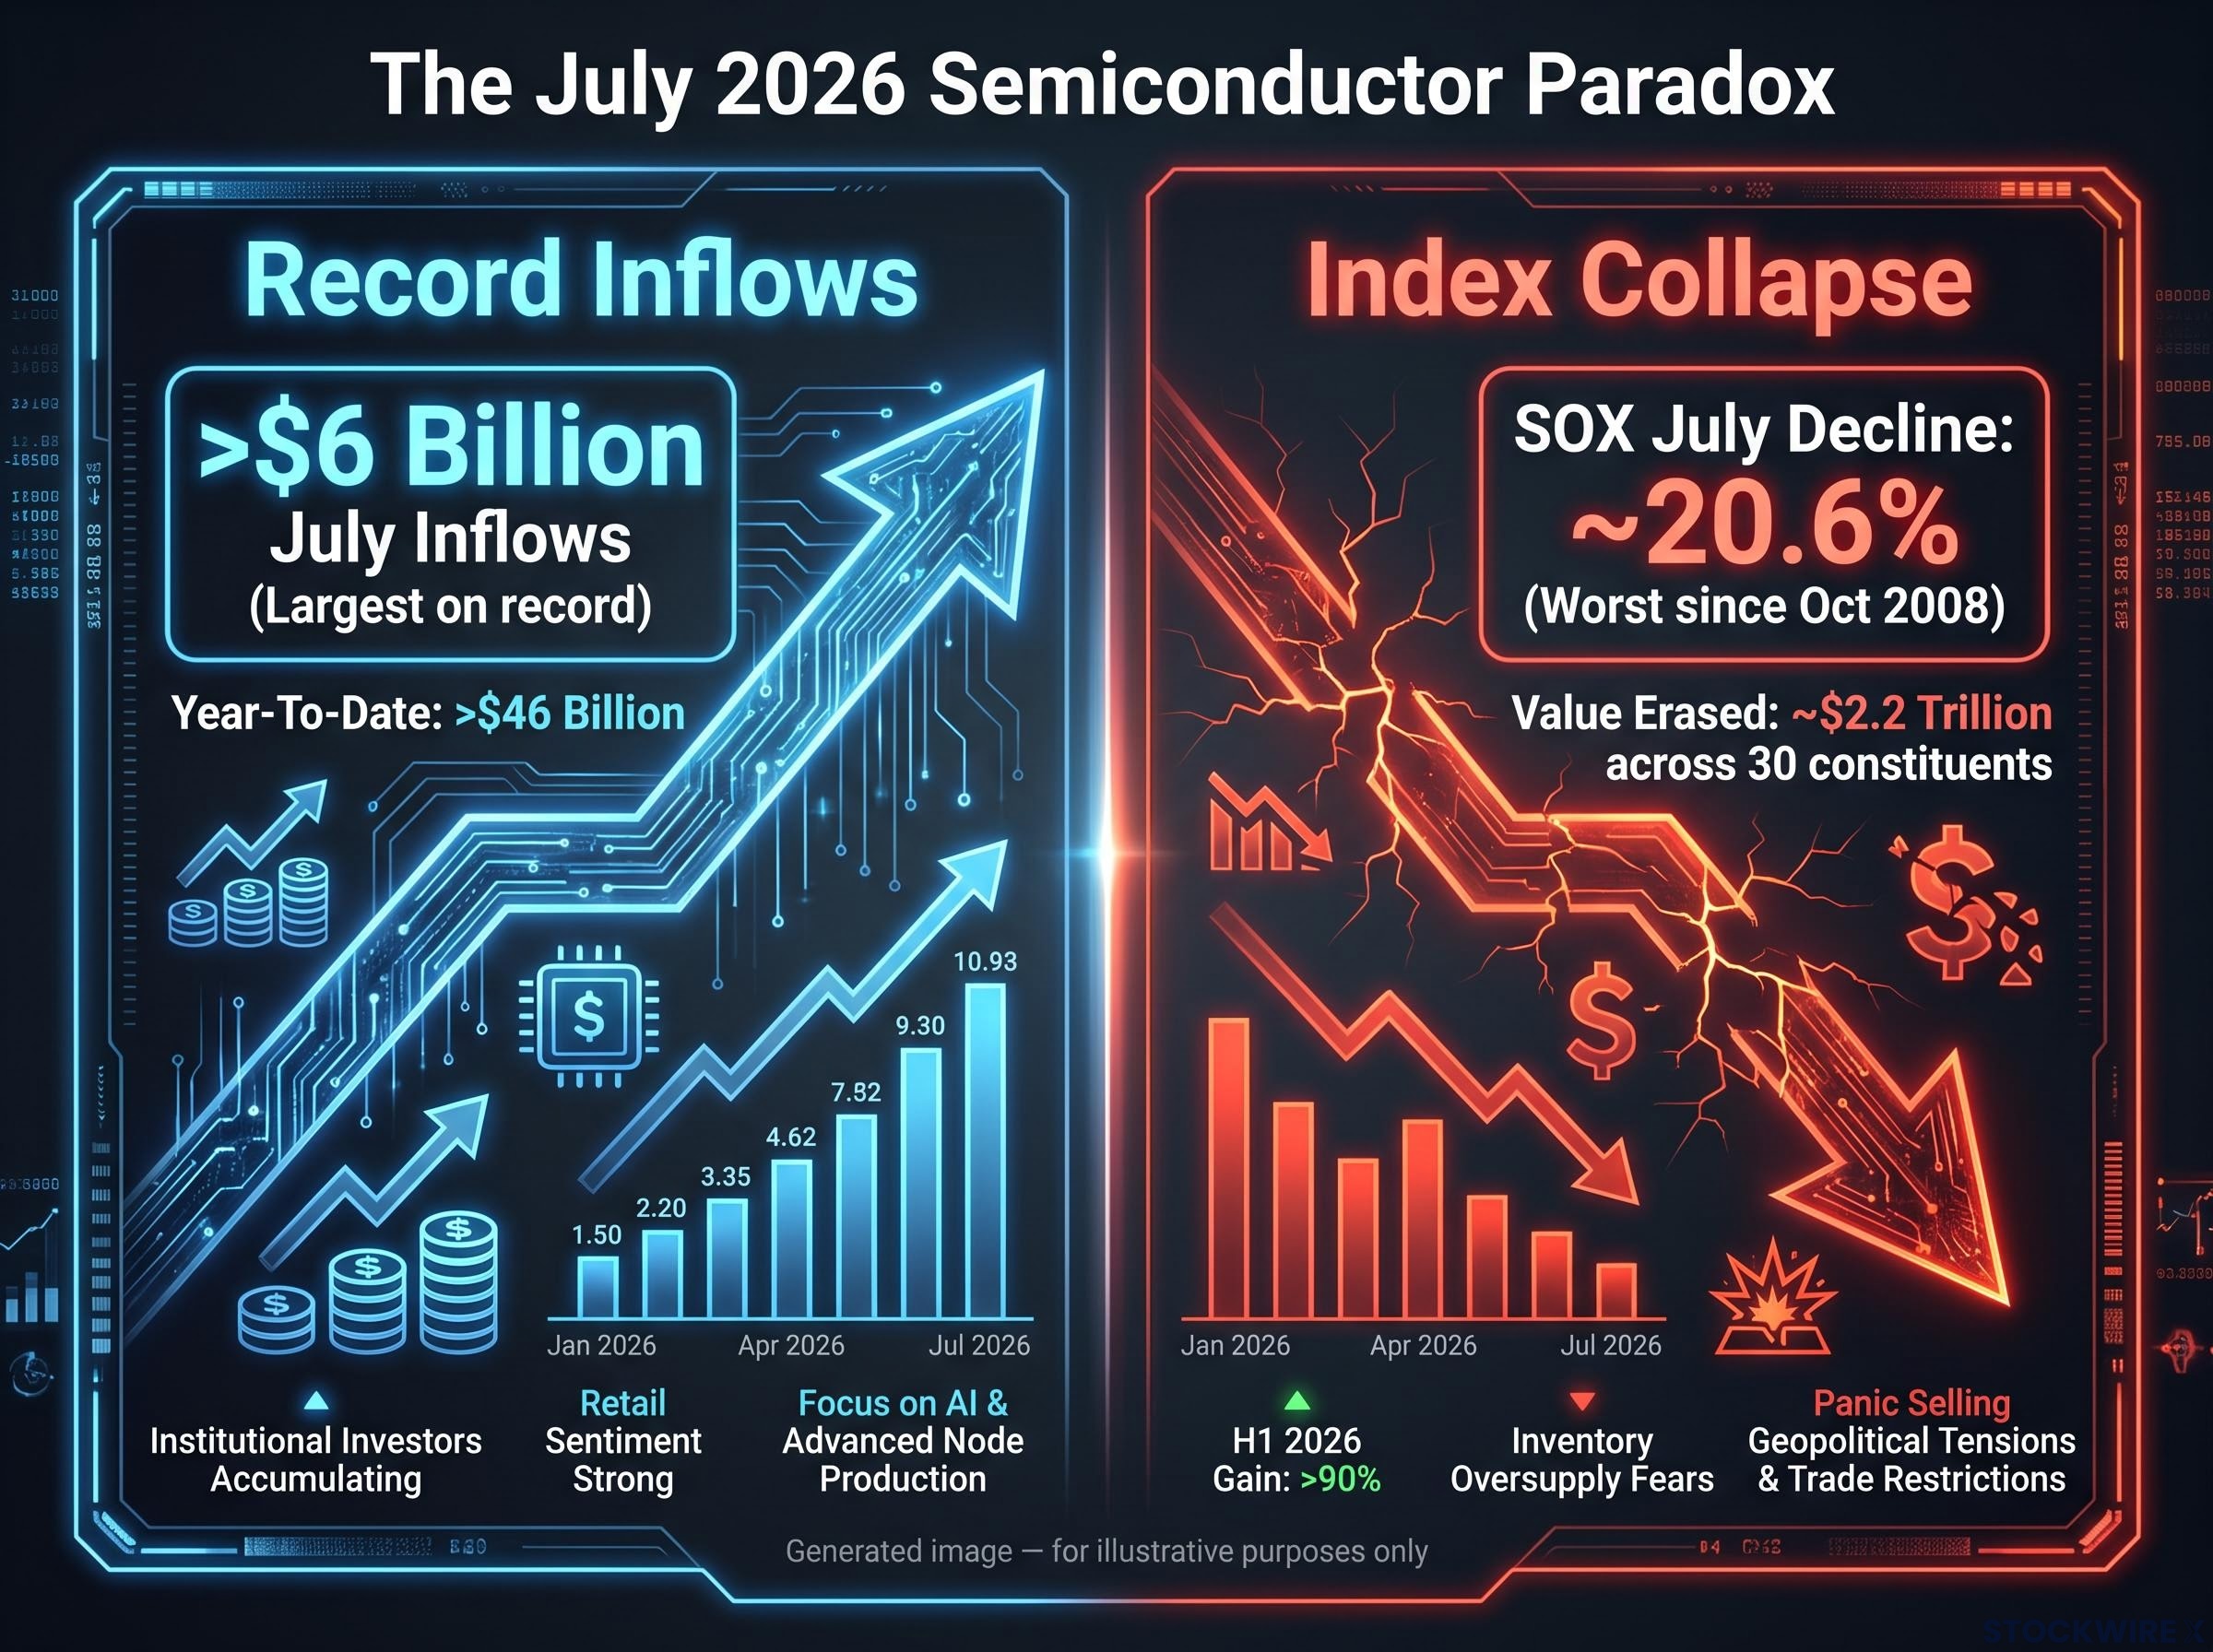
Semiconductor funds took in record inflows in July. More than $6 billion poured into chip ETFs, reportedly the largest single-month haul on record, according to industry flow data. At the same time, the Philadelphia Semiconductor Index (SOX) was logging its worst monthly performance since October 2008. That paradox, record buying into a collapsing price, is not a footnote. It is the story.
The SOX entered July having gained more than 90% in the first half of 2026, carrying the weight of Wall Street’s favourite artificial intelligence bet. By month end, the index had shed approximately 20.6%, erasing roughly $2.2 trillion in market value across its 30 constituents, according to data reported by Investing.com. The broader market barely flinched: the S&P 500 finished roughly flat, while the Nasdaq 100 declined approximately 5%.
Here is a framework for separating the durable AI infrastructure story from the crowded, valuation-stretched trade that just cracked, and for identifying the specific structural risks the selloff made visible in real time.
Ninety percent up, then twenty percent down: what July 2026 actually looked like
Before the analysis, the numbers deserve room.
The SOX gained more than 90% across the first six months of 2026, making semiconductors the dominant equity leadership theme and the primary vehicle for AI infrastructure exposure. That rally priced in a future where hyperscaler capital expenditure flowed seamlessly into chipmaker revenue, margin expansion, and competitive insulation. Then July arrived.
The SOX’s 67% premium above its 200-day moving average heading into July was one of the largest dislocations on record for the sector; SOX overextension signals of that magnitude leave almost no margin for disappointment on earnings, capex, or AI adoption timelines before compression becomes mechanically inevitable.
The index declined approximately 20.6% over the month, its worst performance since October 2008. (An alternate range of 18.2-18.9% appears in some audit sources, while Bloomberg-cited figures sit closer to 21%; the discrepancy remains unresolved, but the pre-verified figure of 20.6% is used here as authoritative.) Every single one of the index’s 30 constituents finished the month lower. By late July, all 30 were trading below their 50-day moving averages, a unanimous short-term downtrend.
The volatility was not just directional. All 22 trading sessions saw intraday swings of 2% or greater, a pattern last observed during the 2020 pandemic and the 2008 financial crisis.
Key scale metrics:
- SOX monthly decline: approximately 20.6%, the worst since October 2008
- Market value erased across constituents: approximately $2.2 trillion (unverified)
- All 30 SOX constituents finished lower; more than half declined 25% or more (unverified)
- Peak-to-trough drawdown from the 22 June record high: approximately 23% (unverified)
According to data reported by Investing.com, the SOX posted an approximately 20.6% loss in July, a monthly decline not seen since October 2008.
The contrast with the broader market’s near-flat performance tells you this was not systemic panic. It was a targeted repricing of a specific, crowded thesis, and that distinction matters for how you interpret the signal.
When big ASX news breaks, our subscribers know first
Why the AI chip trade became its own worst enemy
A genuinely strong fundamental story can become a structural fragility. The mechanism is straightforward: momentum capital, thematic ETFs, and options activity concentrate into the same handful of mega-cap AI and data-centre names. A “diversified” semiconductor ETF begins to behave like a single concentrated macro trade, because effectively everyone holding it is long the same AI-infrastructure narrative via different vehicles.
When the consensus reverses, forced selling in one vehicle propagates across all of them simultaneously. That is why all 30 SOX constituents finished July lower. It was not 30 separate company-specific problems. It was one crowded trade unwinding through 30 tickers at once.
Record inflows into a falling market
The clearest evidence of crowding arrived in the flow data itself. Semiconductor funds reportedly took in more than $6 billion in July (unverified), their largest monthly inflow on record, even as the SOX was posting its worst month in nearly two decades. Year-to-date semiconductor fund inflows exceeded $46 billion.
More than $6 billion reportedly flowed into semiconductor funds in July 2026, their largest monthly inflow on record, even as the SOX declined approximately 20.6%.
Those record inflows during the drawdown are the clearest signal that this was a crowded consensus trade unwinding, not a rational reappraisal by diverse investors arriving at independent conclusions. For anyone holding semiconductor ETFs as AI exposure, this reframes what you actually own: a product that can behave like a highly concentrated, correlated single-theme bet when the consensus reverses, regardless of how many tickers the fund contains.
Benzinga’s July 2026 ETF flow report confirmed semiconductor funds drew $6.13 billion in net inflows that month, the largest single-month haul on record, even as SOXX posted its worst monthly performance since November 2008, making the divergence between price action and capital allocation one of the most striking positioning signals of the AI trade era.
What the market was actually repricing: AI capex, margins, and the payback chain
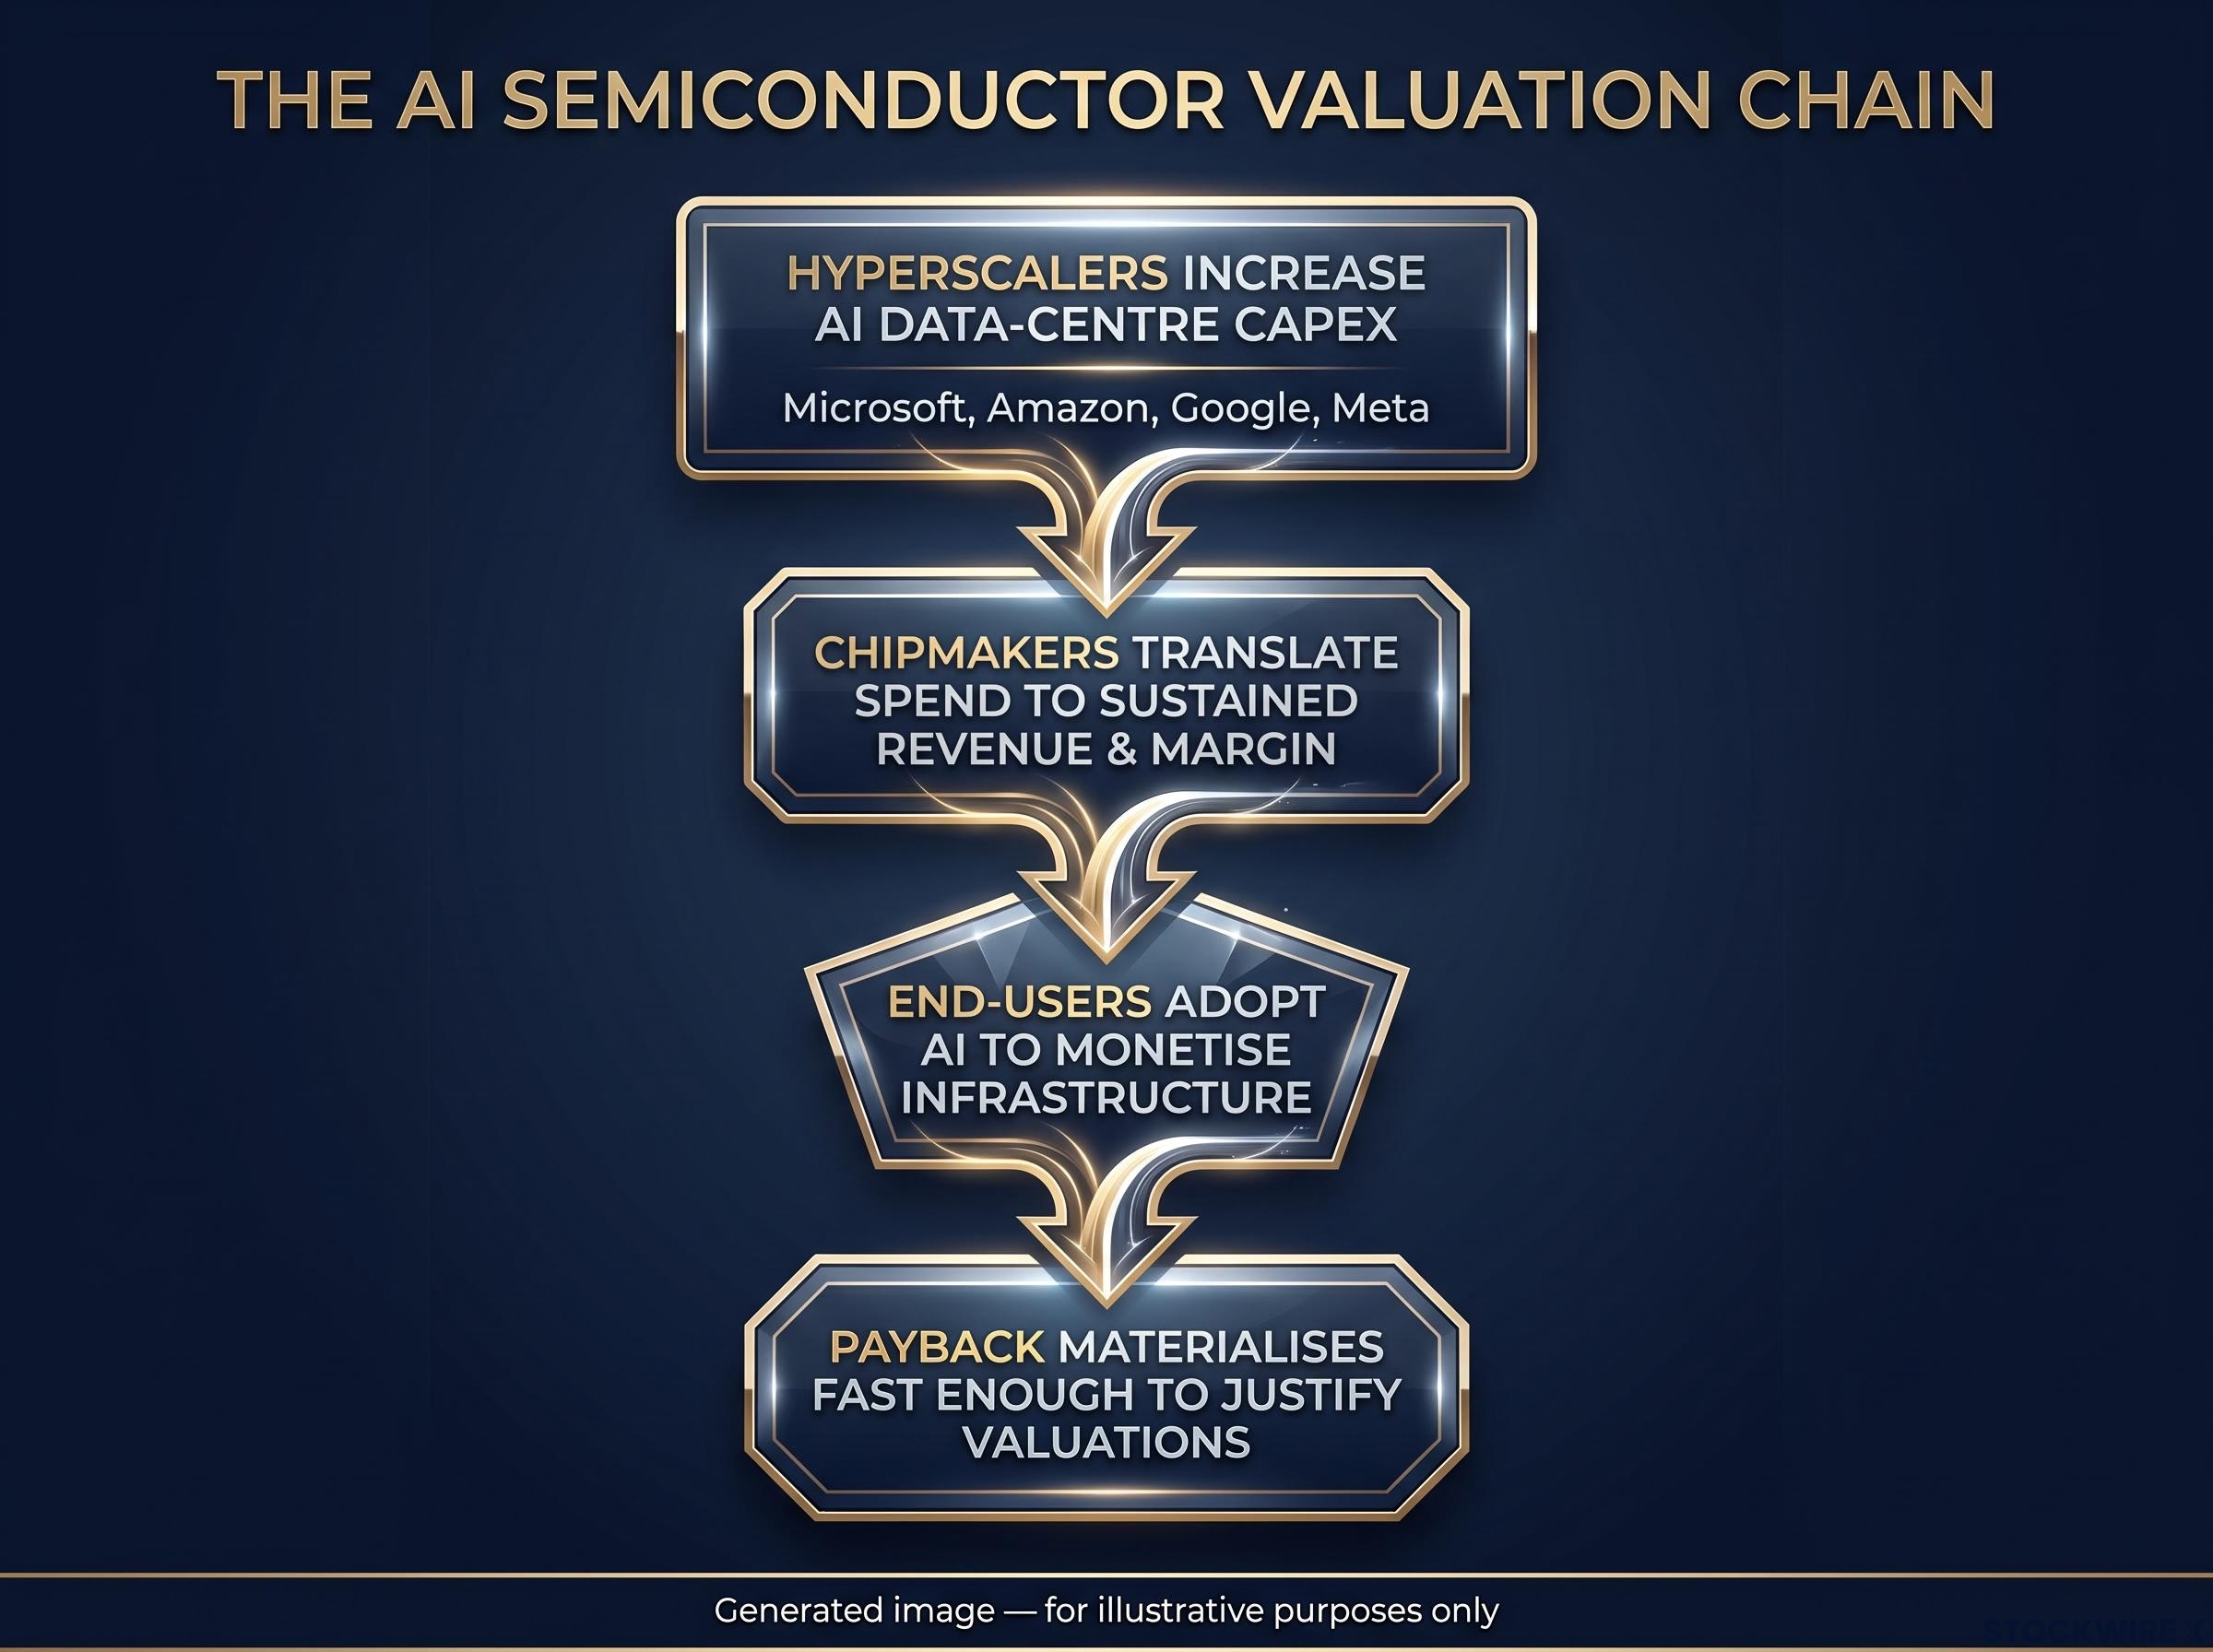
The selloff was not a rejection of AI as a technology. It was a repricing of the timing and smoothness of a specific chain of assumptions that underpins current semiconductor valuations. That chain has four links, each dependent on the one before it:
- Hyperscalers continue increasing AI data-centre capital expenditure
- Chipmakers translate that spend into sustained revenue and margin growth
- End-users adopt AI at a pace that monetises the infrastructure being built
- These dynamics materialise fast enough to justify the valuation multiples established in late 2025 through mid-2026
When the SOX gains more than 90% in six months, the chain needs to execute near-perfectly to hold those valuations. July inserted doubt at multiple links simultaneously.
AI valuation reset mechanics were visible before July: Broadcom fell approximately 15% in early July after reiterating, not cutting, its guidance, demonstrating that at current multiples even unchanged fundamentals can trigger sharp corrections when the market has priced in acceleration rather than continuity.
| Assumption | What it requires | Where July doubt was inserted |
|---|---|---|
| Hyperscaler capex continues rising | Sustained increases in AI data-centre spending by Microsoft, Amazon, Google, Meta | Questions emerged about whether current capex levels are sustainable at this pace |
| Chipmakers capture revenue and margin | Volume growth translating into profit, not just sales | Cost inflation in memory and supply-chain pressures squeezed expected margins |
| End-users adopt AI fast enough | Enterprise and consumer adoption monetising the infrastructure | Investor scepticism about the pace of AI monetisation downstream |
| Payback arrives within priced timeframe | All three prior links materialising before multiples compress | A 90% H1 gain priced in near-perfect execution; any delay triggers multiple compression |
A Bank of America semiconductor strategist described the drawdown as a correction rather than the end of the AI cycle, while acknowledging the sector had run ahead of near-term fundamentals. AMD‘s July 2026 investor event offered a counterpoint to the pessimism: the company revised its CPU market size estimate upward to more than $200 billion by 2030 and set an internal target of more than 50% market share in the CPU server segment, evidence that the infrastructure buildout was already broadening beyond GPUs before the selloff.
The distinction between doubting the timing of the payback chain and doubting the long-term AI story is the single most important judgement you need to make before deciding what the selloff means for your own positions.
This article is for informational purposes only and should not be considered financial advice. Investors should conduct their own research and consult with financial professionals before making investment decisions.
The China variable: how competitive disruption reprices an entire sector thesis
The single-day shock made it concrete. Reports that a state-backed Chinese company had begun mass-producing DUV lithography machines (a critical tool in chip fabrication) triggered an approximately 4.5% single-day decline in the SOX complex and sent shockwaves through Asian semiconductor markets, according to reports sourced via Perplexity (not independently confirmed).
That was one session. The structural point runs deeper.
Why incremental progress is enough to matter
Export controls designed to constrain China’s chip development have instead accelerated domestic investment in alternatives. The general trajectory of accelerating Chinese domestic chip development is established context confirmed across multiple sources. A Chinese competitor does not need to match the most advanced manufacturing nodes to matter. Even incremental progress compresses expected future margins for Western leaders by introducing credible pricing pressure and redirecting some AI infrastructure spending to non-Western supply chains.
China’s domestic DUV capability, currently targeting 28nm natively with approximately five qualification-phase tools rather than commercially scaled production, represents a sentiment risk that the 27 July selloff demonstrated can move the entire SOX complex before the underlying data justify the magnitude of the price reaction.
Export controls designed to contain China’s chip capabilities have instead accelerated domestic investment in alternatives.
For you as an investor in Western semiconductor names or toolmakers, the China variable means that the assumed pricing power and market-share ceiling embedded in current valuations carries a non-trivial probability of being revised downward, independent of whether AI demand itself remains strong. The July events demonstrated that this is not a tail risk to note and ignore. It is a recurring valuation input that can move an entire sector index in a single session.
Five structural risks the selloff made visible
July did not create these risks. It revealed them. Each was present and measurable before the decline, which means the selloff was not unforeseeable randomness but the predictable consequence of ignoring structural vulnerabilities in a crowded, momentum-driven trade.
- Momentum-crowding risk: Sector ETFs behave like concentrated single-theme positions when consensus reverses. July’s record inflows into a falling market quantified this exactly.
- Capex payback-duration risk: The four-link assumption chain from hyperscaler spending to chipmaker margins requires near-perfect execution at current valuations. Any delay triggers multiple compression.
- Geopolitical margin-compression risk: Chinese domestic chip development introduces credible pricing pressure that caps future margins for Western leaders, regardless of AI demand trajectory.
- Volatility-regime risk: Realised SOX volatility reportedly exceeded 60% during July (unverified), matching pandemic-era levels. Crisis-level volatility can arrive without a systemic macro shock.
- Data-verification risk: The unresolved discrepancy in the SOX decline figure itself (20.6% versus 18.2-18.9% in alternate audits) illustrates why investors need independent data sourcing rather than single-outlet reliance.
AMD‘s broadening CPU market ambitions (more than $200 billion addressable market by 2030, more than 50% share target) illustrate how rapidly the infrastructure investment thesis is expanding its surface area, increasing exposure to new competitive and capex-risk vectors that did not exist when the AI trade was purely a GPU story.
| Risk | July evidence | Portfolio implication |
|---|---|---|
| Momentum-crowding | Record $6B+ ETF inflows during worst month since 2008 | Semiconductor ETFs may deliver concentrated single-theme drawdowns, not diversified exposure |
| Capex payback duration | 90% H1 gain required near-perfect execution; doubt at multiple chain links triggered compression | Assess whether your investment horizon matches the realistic payback timeline, not the priced-in one |
| Geopolitical margin compression | ~4.5% single-day drop on China lithography reports | Scenario-analyse export-control escalation and domestic Chinese substitution into valuation models |
| Volatility regime | Realised volatility reportedly exceeded 60%; 2%+ intraday swings across all 22 sessions | Position sizing and leverage management matter more than conviction in high-volatility regimes |
| Data-verification | SOX decline figures range from 18.2% to 21% across sources | Cross-reference data across multiple outlets before making allocation decisions |
Past performance does not guarantee future results. Financial projections are subject to market conditions and various risk factors.
Separating the long-term AI story from the trade that just cracked
No major analyst or market commentary argues AI infrastructure demand is structurally impaired. The partial recovery at month end, partly catalysed by strong quarterly results from Microsoft and Amazon and the closure of Situational Awareness (a hedge fund founded by former OpenAI researcher Leopold Aschenbrenner), illustrates that the underlying narrative remained intact even as the trade compressed.
The Bank of America strategist framing bears repeating: correction, not the end of the AI cycle. The SOX’s more than 90% H1 2026 gain makes the current reset a valuation recalibration rather than a structural collapse. But the partial recovery does not invalidate the selloff’s signal. It confirms that the AI thesis is durable at the technology level while remaining fragile at the current valuation and positioning level. You need to hold both truths simultaneously.
The investor’s task is not deciding whether AI is real. It is assessing whether current valuations reflect a realistic payback timeline within your own investment horizon. Three variables are worth monitoring as leading indicators:
- AI capex guidance in hyperscaler earnings: Watch Microsoft, Amazon, Google, and Meta quarterly commentary for any moderation in data-centre spending commitments. This is the first link in the assumption chain.
- Chinese domestic chip development disclosures: Track government announcements, industry reporting, and toolmaker commentary for signals of accelerating capability that compress Western pricing power.
- Semiconductor ETF positioning and flow data: Record inflows during drawdowns are a crowding gauge. When flows and prices diverge sharply, the trade is more fragile than it appears.
These statements are speculative and subject to change based on market developments and company performance.
The July 2026 chip sector selloff stripped away a comfortable illusion: that owning the AI infrastructure theme through semiconductor ETFs was a low-risk way to capture a structural trend. The trend may well be structural. The trade around it is not. Sizing your position to reflect that distinction is the practical takeaway from the worst month in semiconductor markets since the financial crisis.
Investors tracking the three leading indicators identified in this article will also want our comprehensive walkthrough of semiconductor cycle risk indicators, which covers the five-signal framework for identifying peak-cycle timing before TSMC’s and Samsung’s locked-in 2027-2029 supply wave arrives and compresses multiples further.