Oracle closed July 2026 with a contracted revenue backlog of approximately $638 billion, the largest in its history, and a credit rating from S&P of BBB-, the lowest investment-grade notch it has ever held. More revenue locked in than ever before, and a rating agency simultaneously signalling that the balance sheet is deteriorating. Those two facts should not sit comfortably together, and they do not.
The AI infrastructure trade has been sold to equity investors as a compounding growth machine: build capacity, sign cloud contracts, harvest margins. The credit market is now telling a different story, one centred on negative free cash flow, rising leverage, and a backlog that depends heavily on a single private company with an unproven path to profitability. The gap between the equity narrative and the credit reality is where the risk lives.
Here is the framework for understanding which balance sheet signals to track, why credit market moves now function as early warnings for AI-exposed equities, and what Oracle’s downgrade reveals about the structural risk building across the hyperscaler sector.
The downgrade that reframed the AI infrastructure story
S&P’s decision to cut Oracle’s long-term issuer rating to BBB- in July 2026 rested on four explicit factors, and each one compounds the others. The agency cited exploding AI capital expenditure, deep negative free cash flow, rising leverage, and extreme customer concentration in a single counterparty: OpenAI.
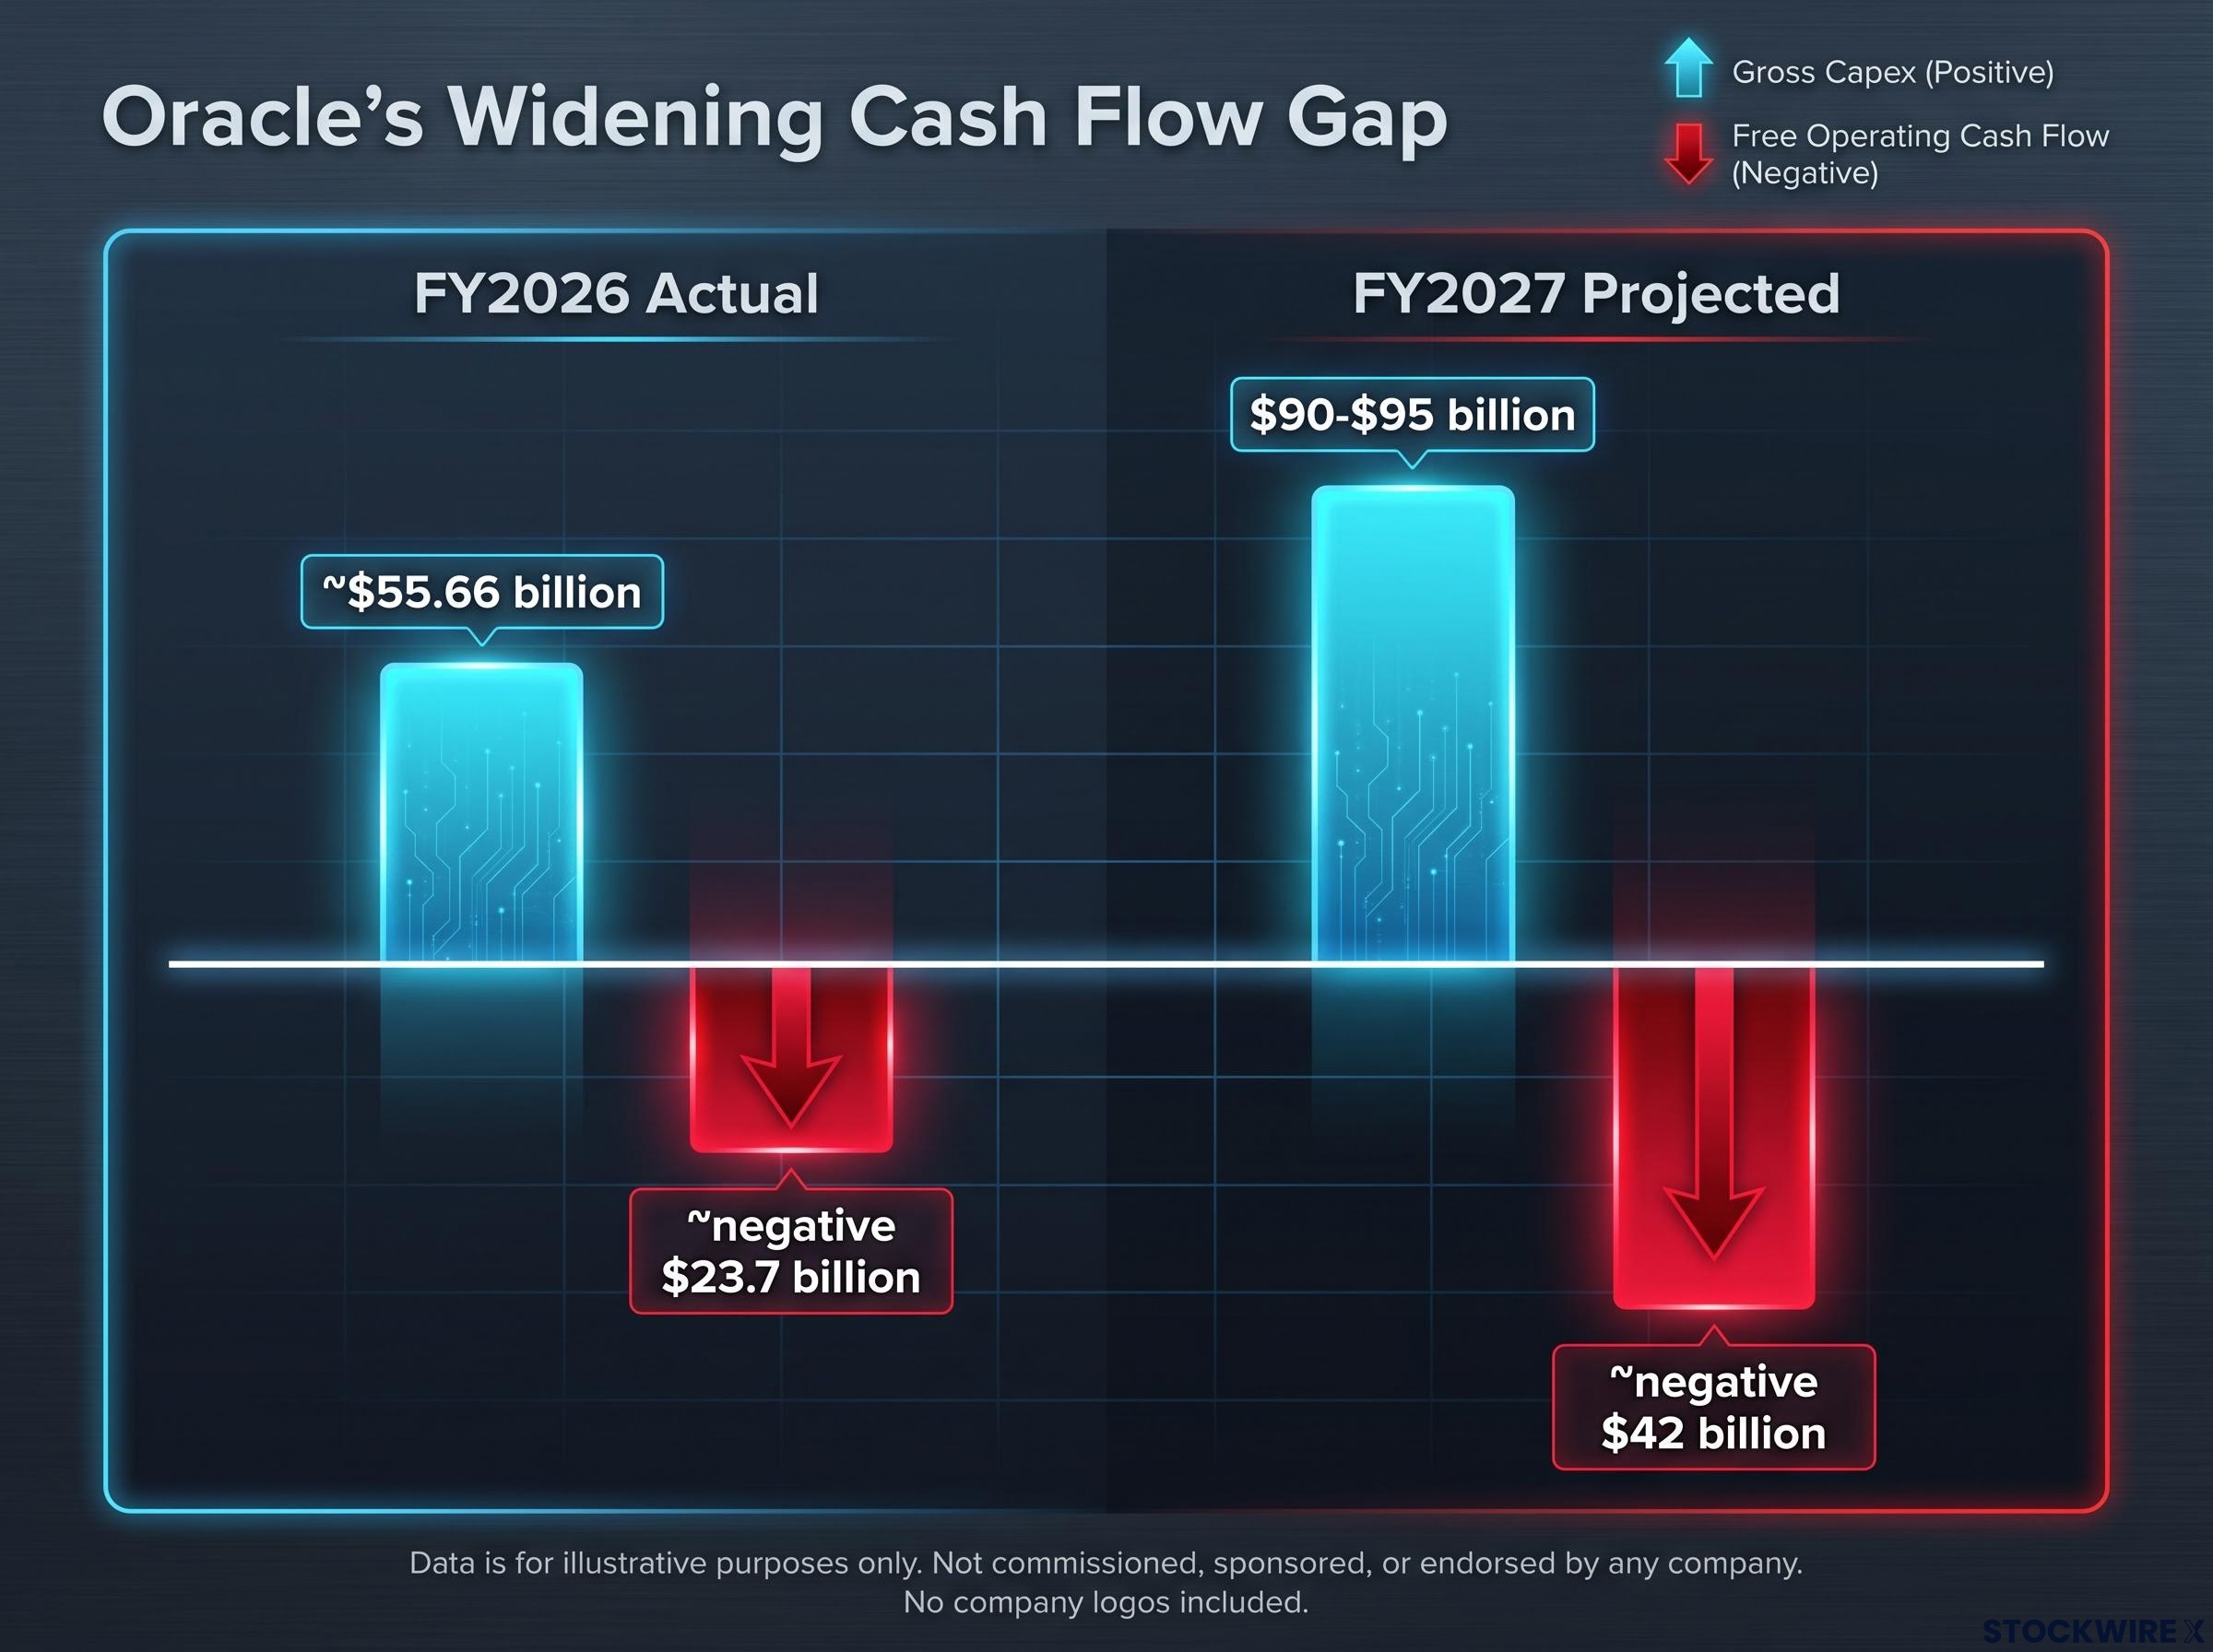
The financial trajectory underneath those four factors makes the downgrade feel earned rather than arbitrary. Oracle spent approximately $55.66 billion on capital expenditure in fiscal 2026, contributing to negative free cash flow of roughly negative $23.7 billion. The fiscal 2027 outlook is steeper still.
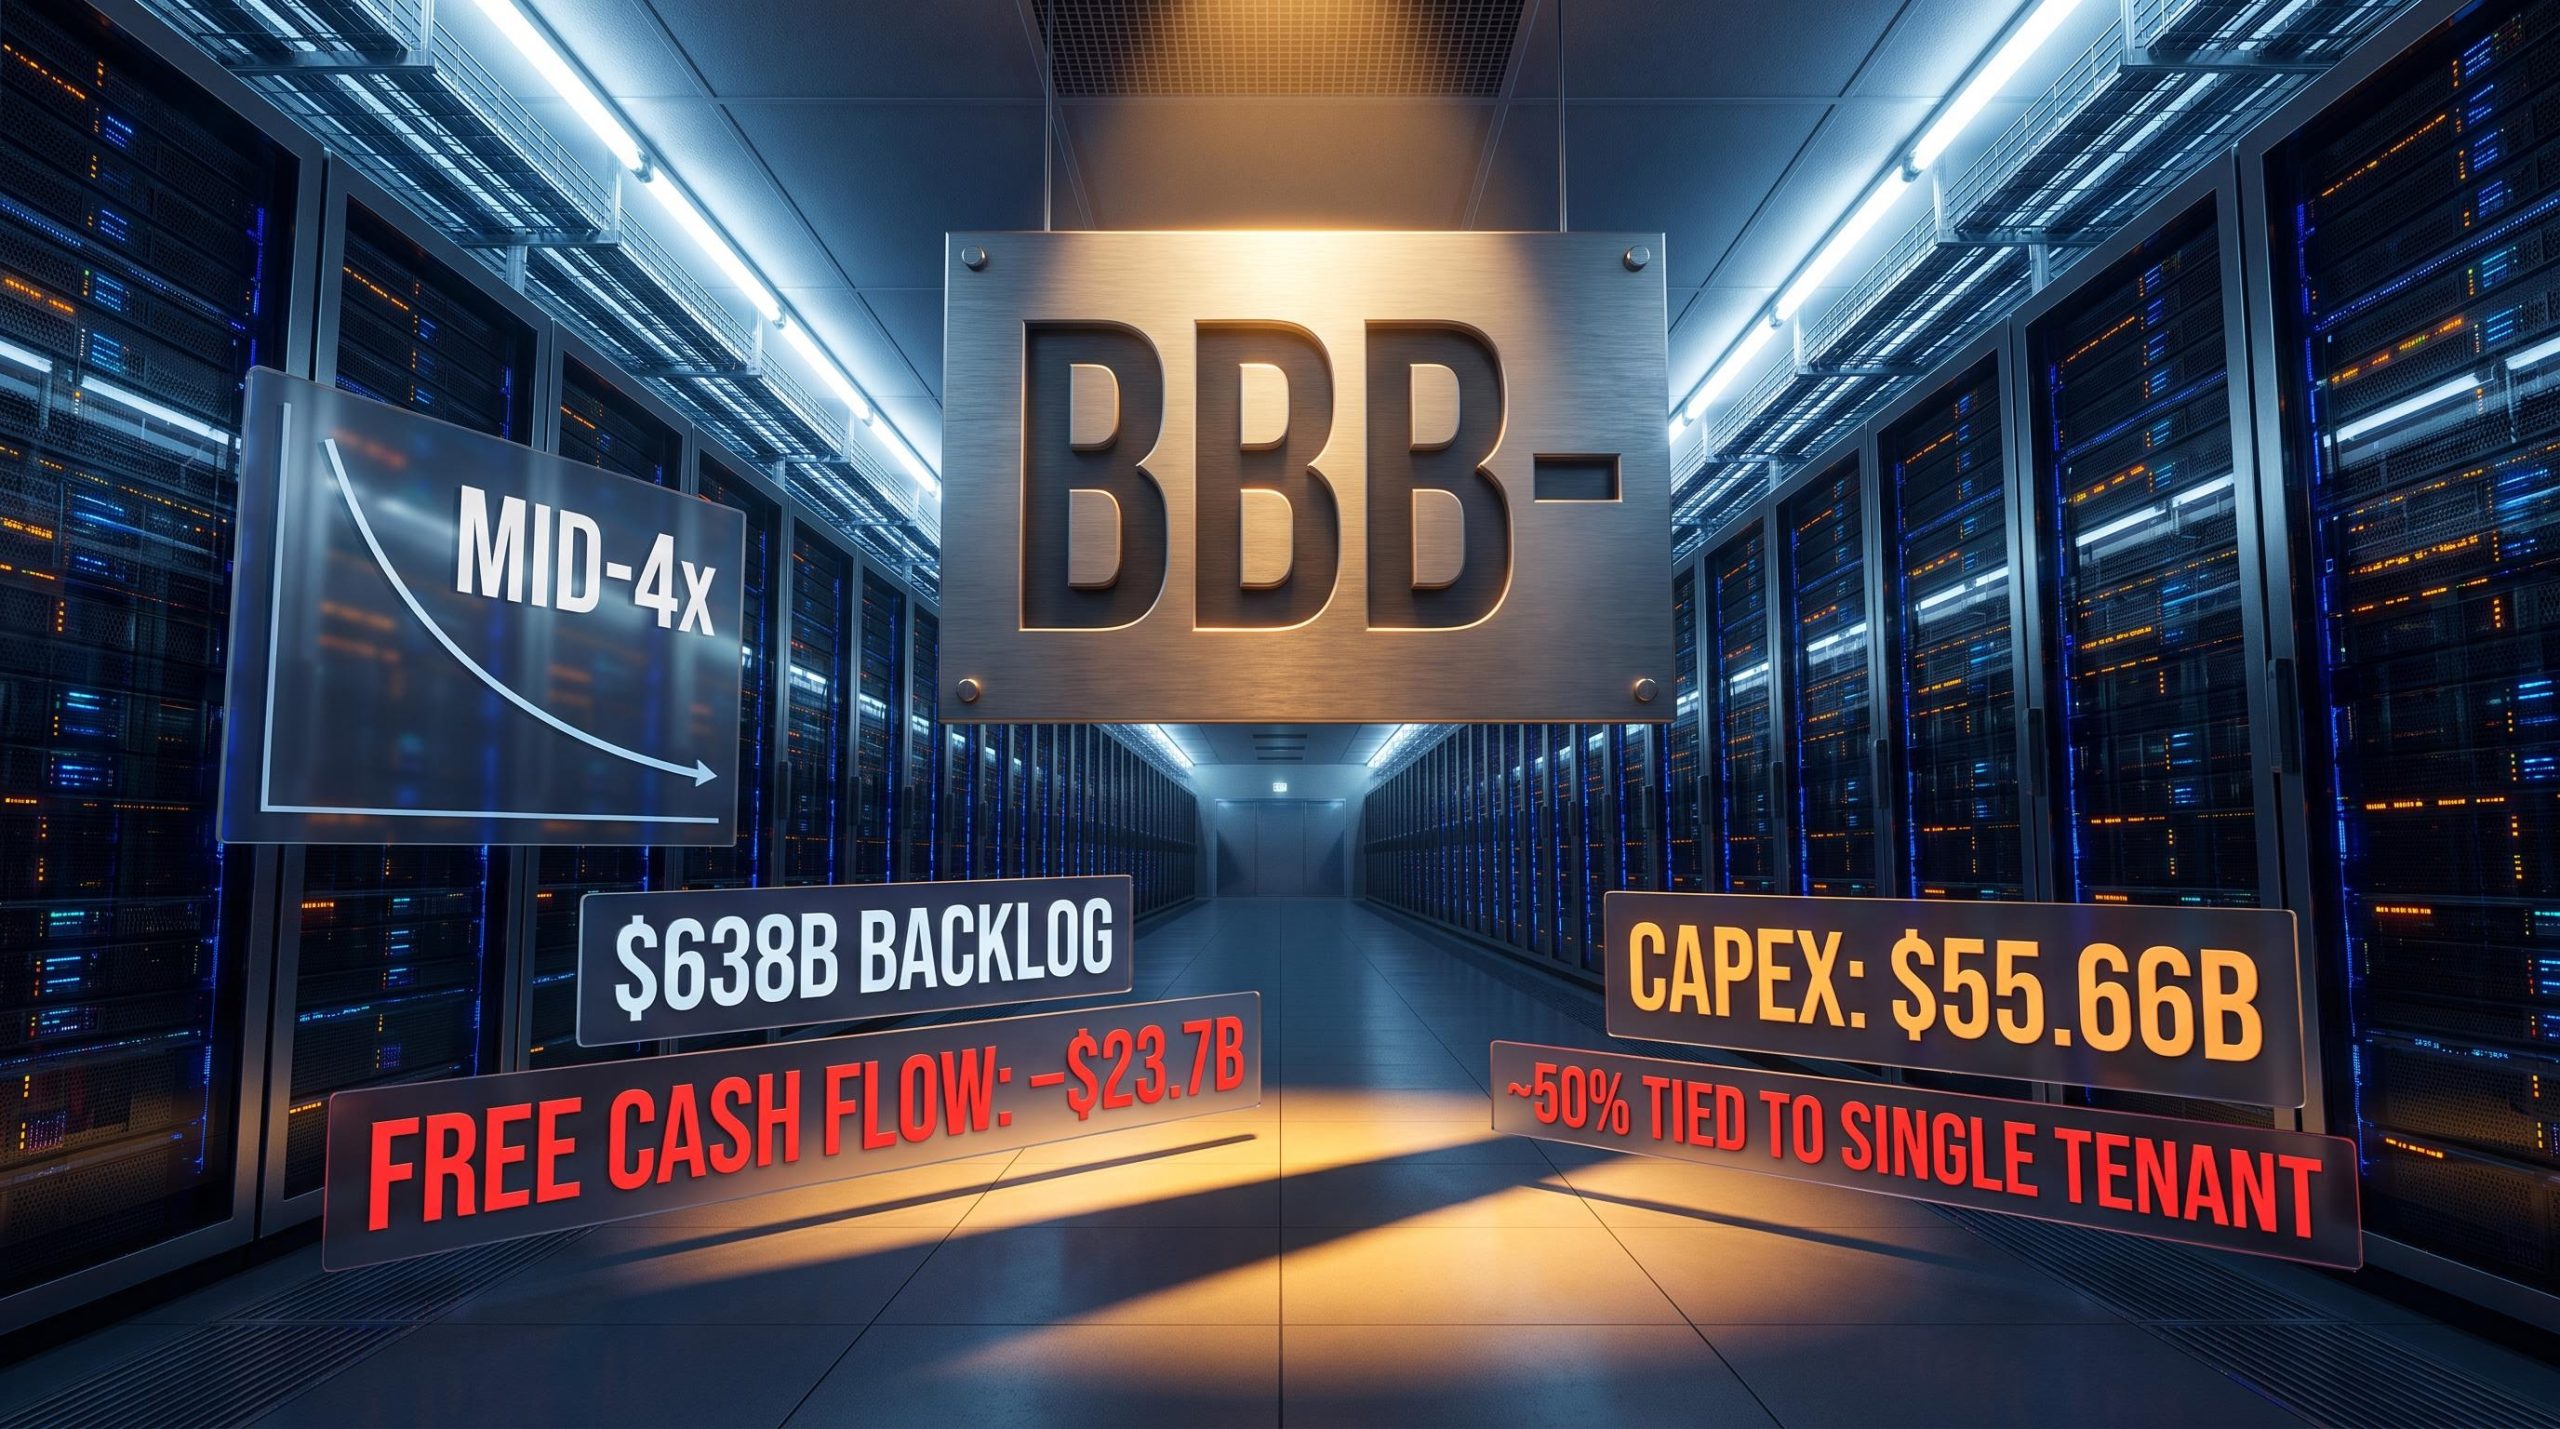
S&P’s downgrade rationale in one frame: AI capex is accelerating faster than revenue can fund it, free cash flow is deeply negative and worsening, leverage is rising toward the mid-4x range, and roughly half the contracted backlog depends on a single private-company tenant.
| Metric | FY2026 Actual | FY2027 Projected |
|---|---|---|
| Gross capex | ~$55.66 billion | $90-$95 billion |
| Net capex (after customer prepayments) | N/A | ~$70 billion |
| Free operating cash flow | ~negative $23.7 billion | ~negative $42 billion |
| Adjusted debt-to-EBITDA | Elevated | Mid-4x area |
BBB- is one notch above high-yield territory, which means junk-rated debt. That boundary matters practically: many institutional mandates prohibit holding sub-investment-grade bonds, so a further downgrade could trigger forced selling across fixed-income portfolios. It also raises borrowing costs at the exact moment Oracle needs capital markets most.
That is why Oracle has announced plans to raise approximately $20 billion in equity as part of a broader $40 billion debt-and-equity effort, not to fund growth, but to defend its investment-grade status. A mid-4x leverage trajectory combined with negative $42 billion in projected free cash flow means the company is no longer in an investment phase with a self-funding path back to positive cash flow. It is dependent on external capital markets remaining open and willing, and that is a categorically different risk than the cash-rich tech growth story equity investors bought into.
When big ASX news breaks, our subscribers know first
Why AI infrastructure is no longer a self-funding machine
Oracle is not an outlier. It is the leading edge of a financing shift that now runs through the entire hyperscaler sector.
The hyperscaler capex trajectory across Amazon, Microsoft, Alphabet, and Meta reached $130 billion in Q1 2026 alone, with full-year 2026 combined guidance approaching $725 billion and a $1 trillion annual run rate projected for 2027, figures that contextualise Oracle’s own spending ramp as one node in a sector-wide financing shift rather than a company-specific outlier.
Goldman Sachs estimates, cited in a Yardeni Research note, show that debt and other external sources covered roughly 26% of hyperscaler capital spending in 2025, a share the same research projects climbing to around 33% in 2026 and approximately 35% in 2027. Those specific figures are sourced to Goldman Sachs via Yardeni Research and should be verified through direct sourcing before being treated as confirmed.
The financing-share shift: External capital funded an estimated 26% of hyperscaler capex in 2025, with projections pointing toward approximately 33% in 2026 and 35% by 2027, according to Goldman Sachs estimates cited in a Yardeni Research note.
The corroborating signals from individual companies point in the same direction. In Q2 2026, Alphabet reported a negative free cash flow quarter for the first time in its history, according to Yardeni Research. Over the twelve months to mid-2026, Amazon’s free cash flow also moved into negative territory, with the trailing figure showing a negative $7.6 billion outflow, per the same source.
Reporting on hyperscaler bond issuance for AI infrastructure shows Amazon, Alphabet, Meta, and Oracle all tapping debt markets in 2025 and 2026 at scale, with Goldman Sachs projecting continued heavy issuance into 2027, making the external financing shift a documented sector-wide pattern rather than an Oracle-specific anomaly.
When the largest, most cash-generative technology companies in the world start showing negative free cash flow quarters and rising external debt ratios simultaneously, the “AI is a self-funding growth story” framing requires revision. Every company now faces the same structural constraint:
- Slow the pace of AI investment
- Cut shareholder returns to redirect cash internally
- Borrow
Oracle has chosen to borrow and issue equity. The broader question for any investor holding a hyperscaler-exposed position is whether the others can avoid the same sequence, or whether they are simply a few quarters behind on the same path.
What credit risk means when your anchor tenant is a startup
The backlog number looks like strength. The composition tells you something different.
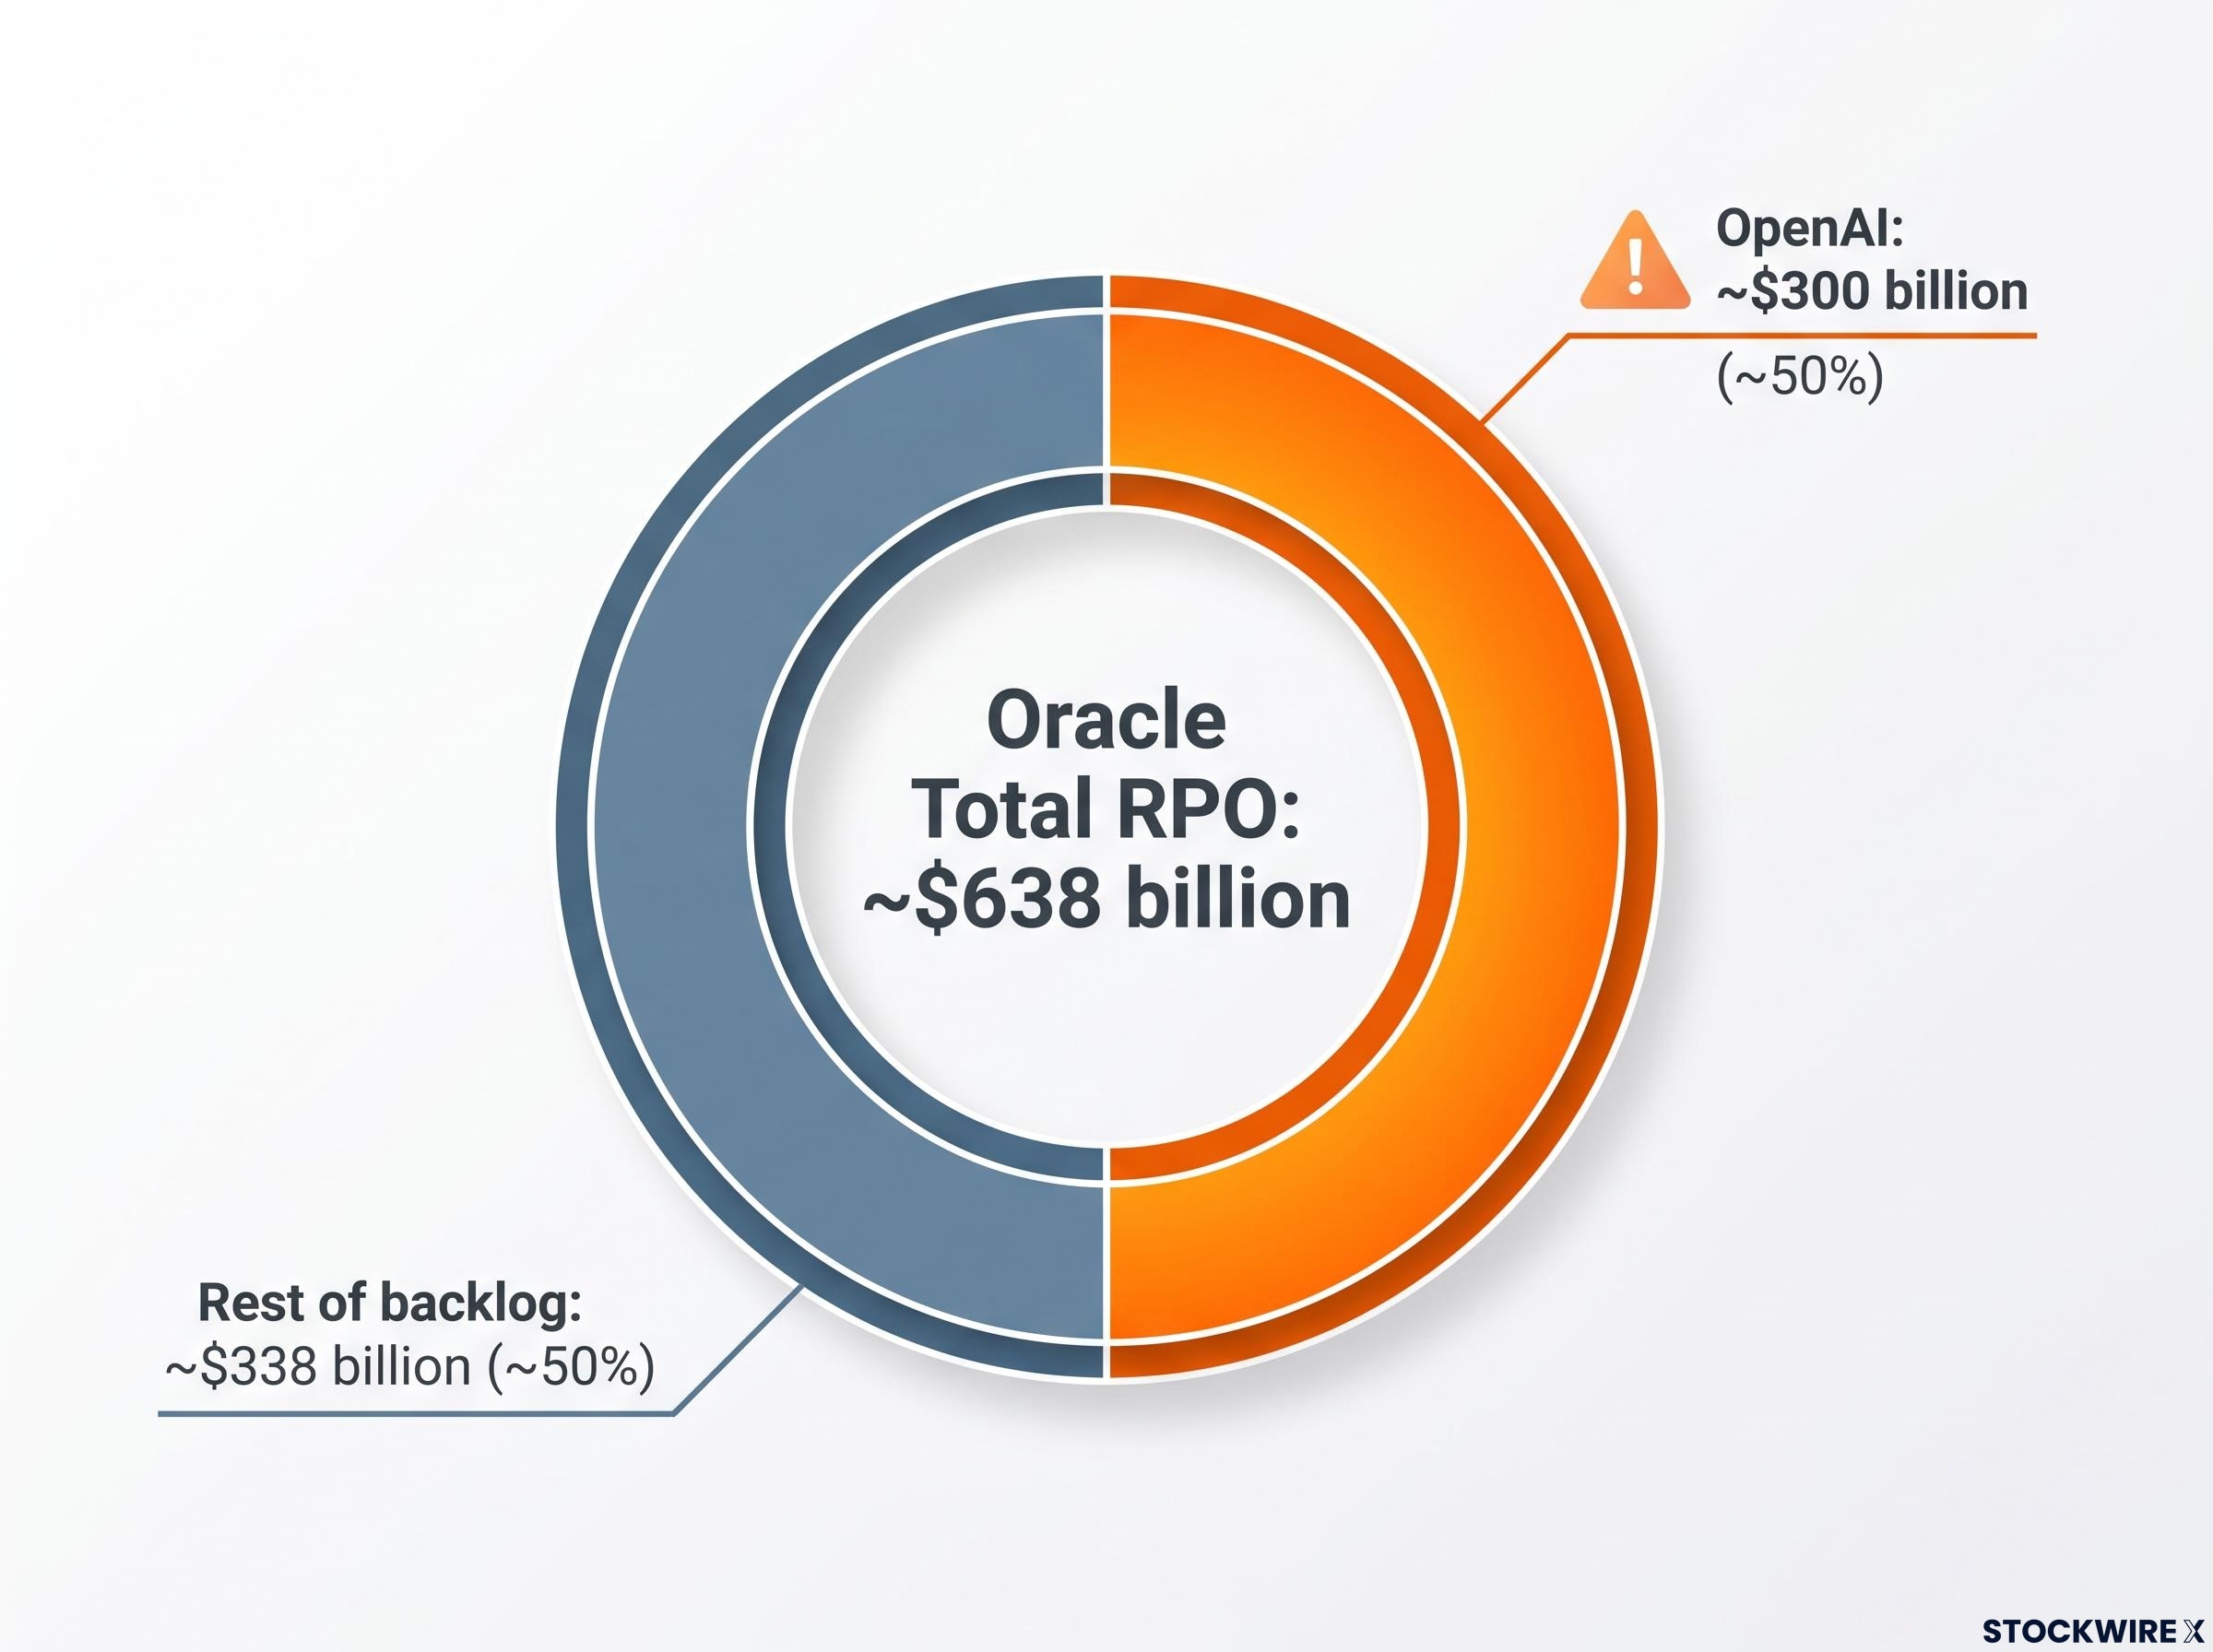
Oracle’s remaining performance obligations (RPO), its contracted revenue backlog, sit at approximately $638 billion. Roughly $300 billion of that total, approximately 50%, is tied to a single counterparty: OpenAI.
| Customer / Category | Approximate RPO Value | Share of Total |
|---|---|---|
| OpenAI | ~$300 billion | ~50% |
| Rest of backlog | ~$338 billion | ~50% |
| Total RPO | ~$638 billion | 100% |
Half of Oracle’s contracted revenue backlog resting on a single private company with high cash burn and an unproven path to durable profitability means Oracle’s credit profile is partially a derivative of OpenAI’s financial viability. Most equity-focused investors are not modelling that linkage explicitly. The credit market is.
OpenAI’s financial viability is not an abstract concern: the company reported approximately $1.8 billion in operating losses for 2024 and expects to remain loss-making through at least 2026, with compute commitments analysts believe exceed near-term revenue, meaning the counterparty risk embedded in Oracle’s $300 billion RPO concentration is backed by a company whose own path to profitability remains unresolved.
Oracle’s CDS spreads (the cost of insuring against default, essentially the price the market charges to guarantee Oracle’s debt) widened after the $300 billion OpenAI deal was announced. Professional credit investors priced this concentration risk in real time.
The stranded-asset scenario S&P named explicitly
S&P did not leave the downside case to speculation. The agency’s downgrade rationale names a specific scenario: if OpenAI fails to meet its multiyear compute payment obligations, Oracle could be left with massive data centre leases it cannot exit or re-lease to new tenants under favourable terms.
In practice, that means long-term fixed costs on infrastructure purpose-built for a single tenant, assets that are illiquid by nature, and replacement tenants unlikely to offer equivalent pricing. This is not an analyst thought experiment. It is a rated agency’s published downside scenario for a company that carries nearly $130 billion in total debt.
Columbia University research on data center concentration risk and stranded asset exposure identifies single-tenant dependency as a key vulnerability for lenders and shareholders in capital-intensive infrastructure, providing independent academic framing for the scenario S&P named explicitly in its Oracle downgrade rationale.
Backlog volume and backlog quality are not the same variable. Conflating them is one of the core analytical errors the downgrade exposes.
How credit markets see this trade differently than equity markets
Equity and credit analysts are not disagreeing about the facts. They are asking structurally different questions, which is why credit can surface risks before equity consensus catches up.
The equity narrative that has dominated AI infrastructure coverage centres on backlog growth, cloud revenue acceleration (Oracle reported 77% year-over-year cloud revenue growth in fiscal 2026 in some metrics), and the long-term AI demand story. These are real numbers. They are also incomplete.
The credit framework starts from a different set of questions: what is the free cash flow trajectory, how is leverage progressing, how concentrated and volatile is the underlying revenue, and what are the cost and availability of funding? When S&P projects mid-4x leverage and negative $42 billion in free cash flow, that is the credit lens at work.
| Analytical Dimension | Equity Lens Focus | Credit Lens Focus |
|---|---|---|
| Revenue / backlog | Growth rate, total size | Concentration, counterparty quality |
| Cash flow | Future margin expansion | Current FCF trajectory, cash burn rate |
| Customer profile | Contract wins, market share | Tenant financial viability, default risk |
| Funding structure | Growth optionality | Leverage ratio, borrowing cost, dilution risk |
The timing asymmetry matters. Credit ratings and CDS spreads are structured to detect balance sheet deterioration as it happens. Equity consensus tends to lag because it weights revenue growth and forward optionality more heavily than funding risk.
If you are evaluating Oracle or any AI infrastructure stock purely through revenue growth and backlog metrics, you are using a one-lens analysis on a two-lens problem. The missing lens is now telling a materially different story. Bond spreads and rating actions are not just fixed-income concerns; they are early-warning instruments for balance sheet risk in equity holdings.
AI infrastructure accounting compounds the credit risk picture: hyperscalers assign five-to-six-year depreciation lives to GPU hardware with an estimated two-to-three-year economic life, systematically flattering current-period margins and deferring the true capital cost into future income statements where it remains invisible to investors tracking headline earnings.
Five metrics that now belong in every AI infrastructure analysis
The Oracle downgrade translates into a working toolkit. Each metric below is anchored in the specific data point that made it visible, then generalised to the broader hyperscaler context.
- Net debt-to-EBITDA and interest coverage. Track the trajectory, not just the current level. Oracle’s adjusted leverage moving toward mid-4x while capex is still ramping tells you the direction matters more than a snapshot. Apply the same logic to any AI infrastructure name where capex is accelerating.
- RPO concentration ratio. How much of the contracted backlog depends on a small number of tenants, and what is the financial profile of those tenants? Oracle’s 50% exposure to OpenAI is the benchmark case. A backlog dominated by a single private, cash-burning counterparty carries a different risk profile than one spread across diversified enterprise clients.
- Free cash flow normalisation timeline versus capex plan. Compare management’s stated investment trajectory with a realistic path back to positive free cash flow. Oracle’s projected negative $42 billion in fiscal 2027 with no clear inflection point visible in the current capex plan is the reference. Treat multi-year negative FCF as a risk variable tied to funding conditions and tenant performance, not as a guaranteed investment phase.
- Credit rating trajectory and CDS spread movement. Rating changes and CDS widening are early warning signals. By the time S&P acted on Oracle, the balance sheet had already moved to a place requiring dilutive equity issuance and higher borrowing costs to stabilise. These signals are actionable before a downgrade, not after.
- External financing share of capex. Monitor what proportion of capital expenditure is being funded by external capital versus internally generated cash flow.
Sector benchmark: Goldman Sachs estimates, as cited in a Yardeni Research note, indicate that debt and other outside sources funded roughly 26% of hyperscaler capex in 2025, with that proportion forecast to reach 33-35% across 2026-2027. These figures require direct sourcing verification before being treated as confirmed, but provide a directional benchmark for industry-wide tracking.
What Oracle’s downgrade changes for the AI infrastructure investment case
The downgrade does not invalidate AI infrastructure demand. It establishes that execution risk, funding conditions, and tenant quality are now first-order variables, not background noise the equity narrative can smooth over.
Three variables need monitoring from here:
- Leverage trajectory as capex ramps: whether debt-to-EBITDA continues rising or stabilises as revenue from contracted backlog begins to convert
- Tenant financial health: specifically whether OpenAI, Anthropic, and similar counterparties can fulfil their multiyear compute commitments, given their own cash burn profiles
- The evolving share of capex funded by external debt across the sector: the financing mix is now a structural indicator, not a temporary feature
Oracle’s BBB- rating is not the end of the story. The $20 billion equity raise plan tells you that even a company of Oracle’s scale is now balance-sheet constrained in the AI capex race. The sector-wide financing shift tells you the pressure extends beyond one company.
The practical implication is not to avoid AI infrastructure positions but to add a second analytical pass. Ask: how is the spending being funded, who are the tenants, and what happens to the balance sheet if either funding conditions tighten or key tenants underperform? Investors who update their frameworks now, applying both an equity and a credit lens, are better positioned than those who wait for the next rating action.
The binding constraints on AI deployment, particularly power availability and cooling density, are where some analysts argue durable value concentrates, but that structural thesis depends on the same capital-intensive build programmes that are now generating the negative free cash flow and rising leverage the credit market is penalising.
This article is for informational purposes only and should not be considered financial advice. Investors should conduct their own research and consult with financial professionals before making investment decisions. Past performance does not guarantee future results. Financial projections cited are subject to market conditions and various risk factors.