
On 5 November 2026, the Philadelphia Semiconductor Index fell about 12% in a single session, and roughly $3 trillion disappeared from the market value of S&P 500 companies. The next day, chip stocks bounced more than 4%. For anyone weighing AI sell-off investing decisions, the real question is whether that drop was a panic worth buying or a warning worth heeding.
The answer matters more than the bounce. Michelle Connell, CFA, founder and chief investment officer of Portia Capital Management, began analysing semiconductors in 1998 and later led a large bank’s technology coverage through the dot-com collapse.
Speaking with host Ilya Spivak on tastylive’s Trading Trends in early November, she offered a framework for reading moments like this one. It is one experienced investor’s lens, not a forecast.
Her approach gives you two things to carry into your own portfolio. The first is a way to separate technical selling from genuine deterioration. The second is a short list of debt and interest rate pressures to check in every holding you own.
What actually broke on 5 November, and was it technical or fundamental?
Start with the damage. According to Reuters, the Nasdaq Composite fell 5.5% on 5 November and closed nearly 12% below its 6 October record, which put it in correction territory. A correction is a fall of 10% or more from a recent peak.
| Index or security | 5 November move | Source |
|---|---|---|
| Nasdaq Composite | -5.5% | Reuters |
| Philadelphia Semiconductor Index | about -12% | Reuters |
| iShares Semiconductor ETF | -11% (largest one-day fall since March 2020) | CNBC |
| AMD | -17.3% | CNBC |
| Micron | -17.5% | CNBC |
| Broadcom | -10.4% | CNBC |
| Nvidia | -9.3% (CNBC) vs about -7.7% in session (Reuters) | CNBC, Reuters |
The gap between the two Nvidia figures most likely reflects a closing price measured against an intraday reading, although neither outlet has confirmed this.
The fundamental triggers
Doubt was building well before the sell-off began. Investors had been questioning whether the hyperscalers, the giant cloud operators that buy most AI hardware, would earn adequate returns on their capital spending. Reuters and CNBC then linked the 5 November drop to fears that the Democratic midterm win could bring tougher AI regulation.
Texas added to the pressure. On 21 September, Governor Greg Abbott directed state regulators to halt data-centre permits until an audit of the power grid was complete. Governor-elect Gina Hinojosa has since proposed a moratorium on new approvals, although reporting suggests it probably could not stop projects that already hold permits.
Permits are only one brake on the buildout; data centre financing and power availability are increasingly the binding limits, with grid interconnection queues stretching for years in some regions.
The technical amplifiers
Connell read the move as more technical than fundamental. She pointed to breached support levels, the price floors where buyers had previously stepped in, and to exits by programme-trading and factor funds that sell automatically when signals flip.
Broad index ownership spread the selling further. Connell cited a study finding that about 90% of S&P 500 companies have some AI affiliation, so anyone holding a cap-weighted index fund already carries AI exposure.
No source quantifies how much of the fall came from forced selling. The split between fundamental and technical causes is therefore a matter of judgement, not measurement. The most defensible reading is that fundamental doubt lit the fuse and technical selling fed the fire.
Commentators reached different conclusions from the same day. Michael Lerner of UBS told Reuters he saw a potential longer-term buying opportunity, while CNBC’s Jim Cramer said uncertainty over data-centre construction had made AI stocks hard to value.
If the selling in one of your holdings was mostly technical, the business may be intact and only the price has changed. If the cause was fundamental, the investment case has changed. You need to test each holding to find out which applies, rather than assume.
When big ASX news breaks, our subscribers know first
Why Connell exited CoreWeave: reading debt as a warning signal
Connell was a private investor in CoreWeave, the AI cloud provider, and made money on it. She trimmed the position gradually and was fully out by the autumn. Her reason was not a hunch about AI demand but the company’s repeated trips to debt markets.
The numbers behind the exit
Comparing CoreWeave’s debt totals requires care, because different reports measure different things. At 30 June, Money.it put financial debt at about $35.1 billion, with a further $16.3 billion in operating-lease liabilities. Trefis cited a broader total of about $51.6 billion.
The repayment schedule is heavy. Roughly $4.413 billion falls due by the end of 2026 and $6.184 billion in 2027, about $10.6 billion through 2027.
The company raised about $18 billion in Q2 alone across debt, convertible notes and equity. In September it proposed a $3 billion convertible offering; reports after pricing put the deal at about $4.2 billion, with a 2.875% coupon and a 2033 maturity. The reason for the larger figure has not been confirmed.
Spending guidance for 2026 sits at $35-$39 billion. Bond investors have responded accordingly.
Lenders are pricing real risk CoreWeave’s 2032 bonds yielded more than 16%, with some reports above 17% (Yahoo Finance).
That yield tells you that lenders, not just equity traders, are demanding a steep premium. The shares fell roughly 45% over the month before results, which are due after the close on Tuesday 10 November.
Credit markets rank AI spenders by balance sheet strength, with Oracle bonds yielding well above Alphabet and Amazon paper, which suggests lenders already discriminate between cash-generative builders and those reliant on external funding.
Connell’s exit reflects four distinct pressures in debt-funded AI infrastructure:
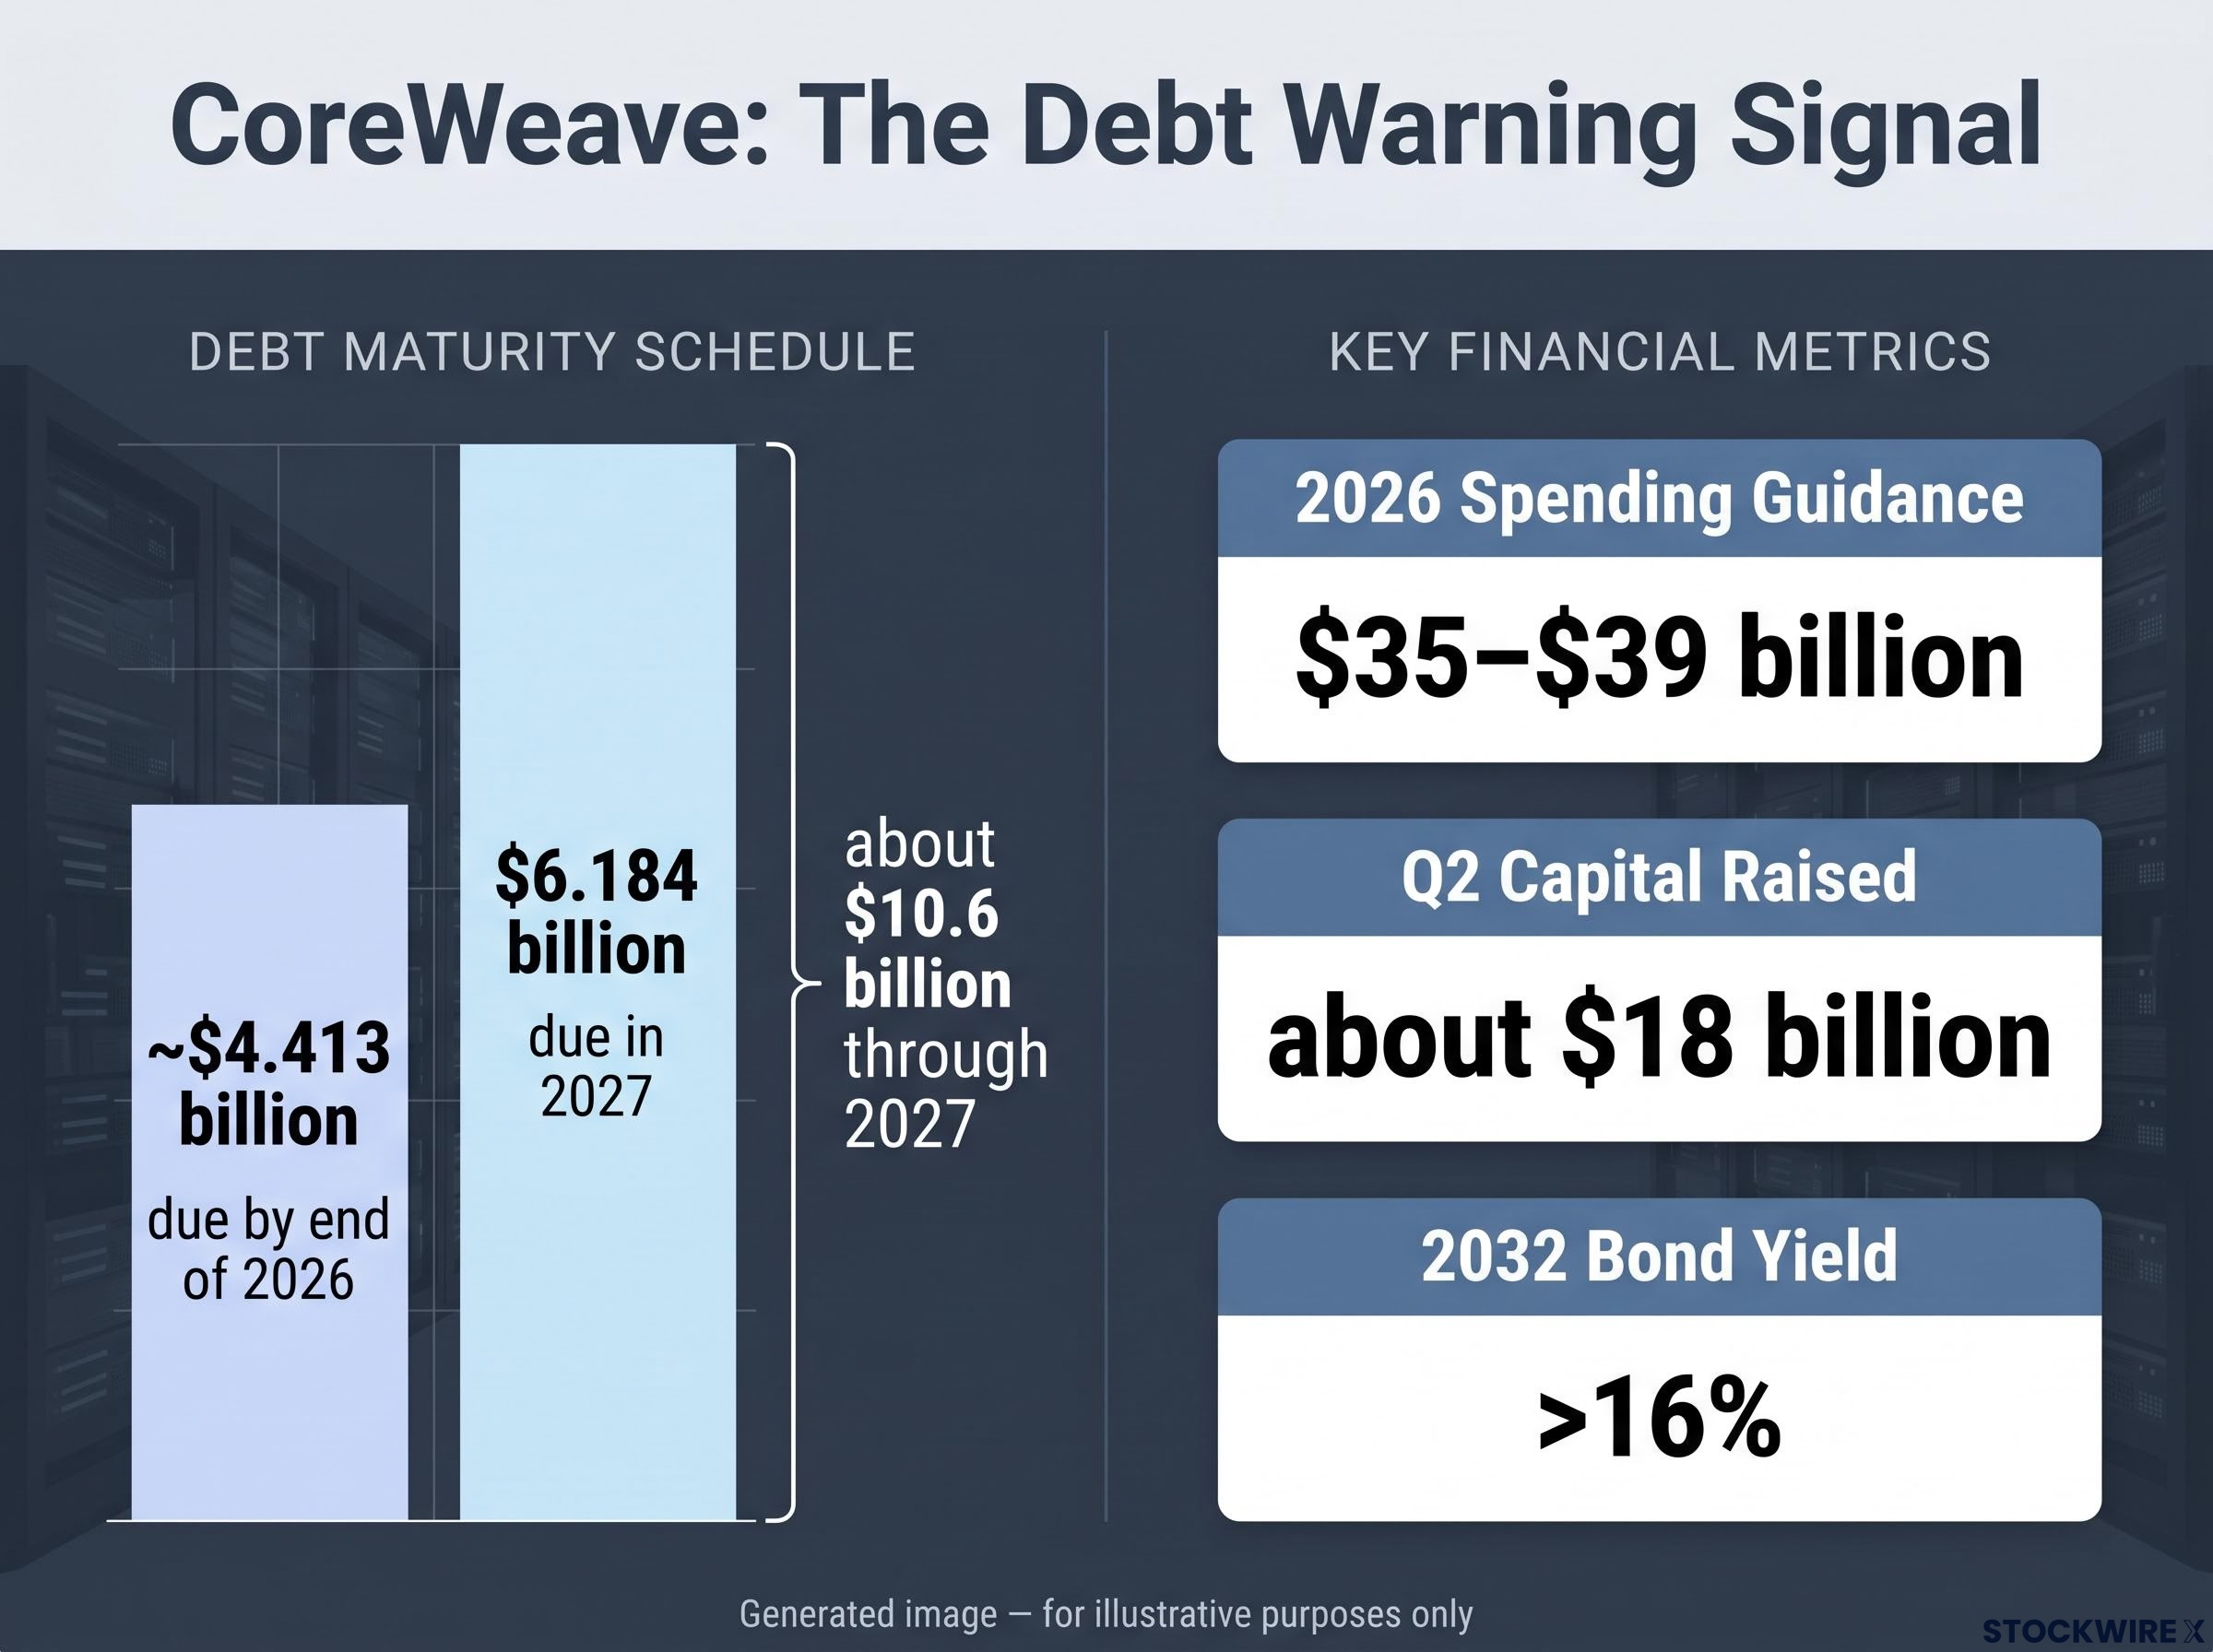
CoreWeave faces about $10.6 billion in repayments through 2027 while maintaining a 2026 spending guidance of $35-$39 billion.
- Refinancing risk: rolling over debt becomes expensive when bond yields sit in double digits.
- Maturity concentration: large repayments fall due within a short window.
- Capital intensity: heavy spending can force new share issues, slower growth or costly borrowing.
- Customer concentration: if hyperscalers slow their builds, providers can be left holding expensive chips and commitments.
The counter-view is that cash-rich hyperscalers can fund AI spending from their own cash flow. That distinction is the point of the exercise. Any holding that depends on continual capital raising deserves a harder look than one that pays its own way.
How AI borrowing and government deficits could keep long-term rates high
Debt pressure does not stop at individual companies. It runs through the bond market too, and the latest data shows why.
| Data point | Figure | Source |
|---|---|---|
| October payrolls | 165,000 (September revised up to 60,000) | Reuters, 6 November |
| Unemployment rate | 4.1% vs about 4.2% expected | Reuters, CNBC |
| 2-year Treasury yield | about 4.52% | Reuters |
| 10-year Treasury yield | about 4.86%-4.88% | CNBC, Reuters |
| 30-year Treasury yield | about 5.26%-5.29% | CNBC, Reuters |
| December 25 bp hike odds | about 77%-80% (CME FedWatch); about 79% (prediction markets) | CNBC, Reuters, 247WallSt |
During the interview, Connell cited prediction-market odds above 85%, although she expects a hike is more likely to come next year. She also stressed that the economy is not broken, pointing to the upward revisions in the jobs data.
Her argument about rates runs like this. AI infrastructure demands enormous borrowing, while large government deficits require heavy Treasury issuance. Both compete for the same pool of capital, which she believes lifts risk-free rates (the yields on government bonds that every other investment is measured against).
Higher long-term yields affect tech stocks in two ways. They raise the discount rate, the rate used to convert future profits into today’s value, which hits companies whose earnings sit far in the future hardest. They also make long-dated projects more expensive to finance.
No source measures how much of the move in yields comes from AI borrowing. The dissenting view holds that AI productivity could lift growth, tax receipts and corporate cash flow, which would ease debt pressure.
The practical lesson is uncomfortable. If you hold long-duration growth stocks or heavily leveraged names, strong jobs data can hurt you through rates, so good economic news is not automatically good for your portfolio. Market probabilities are speculative and subject to change as new data arrives.
Is this the dot-com bubble again? What a 1998 veteran sees
Connell has seen this pattern before, and the parallels are real. Then as now, enthusiasm for a world-changing technology drove spending ahead of proven returns, and tightening finance exposed companies with weak cash flow.
The differences complicate the comparison:
| Attribute | Dot-com era | Current AI buildout |
|---|---|---|
| Leading companies | Many lacked profits | Substantial revenue, profits and customers |
| What spending buys | Often speculative | Tangible data centres, networking and compute |
| Main buyers | Weaker balance sheets | Cash-rich cloud giants |
| Market damage | 2000-2002 collapse | Nasdaq correction of about 10%-12% |
No commentary from November 2026 has compared the current sell-off to the full 2000-2002 collapse. Connell’s own view is more nuanced: hype is mixed with real demand.
The sharper bubble worry centres on debt-funded, circular financing among AI suppliers and their customers, where the same capital loops between investors, cloud providers and chip buyers, a structure that valuation multiples alone do not capture.
She believes it is too early to name the long-term winners and that there is likely “fluff”, as in past cycles. In her view, the sector remains fluid and cyclical.
Competitive shifts are part of what keeps it fluid. She points to AMD’s push to challenge Nvidia, and to a chip company whose planned optics acquisition sent its shares sharply lower that week. She also trimmed Dell after a gain of about 300%, while still liking the company.
The lesson from 2000 is not “sell everything”. It is “understand each company”, because competitive moves and acquisition decisions can punish even good businesses.
How to screen for resilience: cash flow, leverage and where Connell is positioned
Understanding each company needs a method. For Connell, cash flow is the critical screen.
A five-point cash-flow screen
A few definitions first. Free cash flow is the cash a business generates after paying for its operations and investment spending. Net debt is total borrowing minus cash on hand. Refinancing need is the amount of debt that must be repaid or rolled over soon.
- Positive, recurring free cash flow: the business funds itself.
- Low net debt or manageable refinancing: upcoming maturities do not threaten it.
- Limited reliance on continual issuance: it is not repeatedly selling new debt or shares.
- Valuation supported by current earnings: the price does not depend on distant assumptions.
- Customers able to support capex through a downturn: its revenue holds up if buyers cut back.
CoreWeave, as described above, fails most of these tests. A cash-rich hyperscaler passes most of them.
Checking customer capacity means reading hyperscaler filing footnotes, where non-cancellable purchase commitments and uncommenced leases can far exceed the debt shown on the balance sheet.
Why leveraged ETFs are off her list
Connell will not buy double- or triple-leveraged semiconductor or cybersecurity ETFs. These funds reset their exposure daily, which magnifies losses in volatile markets, and many of their underlying stocks face order shortfalls and margin pressure. No source has quantified the role these funds played in this sell-off.
Even an unleveraged fund felt the pain. The Global X Artificial Intelligence & Technology ETF fell 6% on 5 November and 15% over the prior month.
Where she is leaning now
- Trimming winners, including Dell
- Buying beaten-down hyperscalers and about four semiconductor names
- Adding to health care
- Eyeing BlackRock, Nasdaq and regional banks
- Using individual stocks as satellites around core ETF holdings
None of these areas is an automatic safe haven. Health care faces policy, reimbursement and drug-pricing pressure. Asset managers lose fee revenue when asset prices fall, exchange operators can benefit from higher trading volumes, and regional banks face commercial real-estate and deposit pressure.
This is one professional’s positioning, not a template. The screen matters more than the tickers.
What to check in your own portfolio before the next shock
The evidence suggests that fundamental doubt about AI returns triggered the sell-off and that technical selling amplified it. Debt and rates are the two channels most worth checking in your own holdings.
Several dates come up quickly. CoreWeave reports on 10 November, the December Fed meeting will test those hike odds, and the 10-year and 30-year yields will show whether borrowing costs keep climbing. Texas permitting policy under Hinojosa will shape the pace of the data-centre buildout.
Before deciding whether the drop was a panic or a warning, run each of your holdings through the five-point cash-flow screen. The names that pass are likely to hold up best when the next shock arrives.
This article is for informational purposes only and should not be considered financial advice. Investors should conduct their own research and consult with financial professionals before making investment decisions.