The S&P 500 slipped just 1.09% on 16 October, which looks like an ordinary down day. Underneath, the Nasdaq 100 lost 2.50%, semiconductors dropped roughly 10% for the week, and the equal-weight S&P 500 fell only 0.42%. So how do you tell a contained tech correction from the start of something worse?
The headline index level hides where the stress actually sits. Options market volatility data fills that gap. It shows what investors are paying to protect against, and which parts of the market they are worried about.
The timing makes this reading urgent. Mega-cap earnings begin next week, the Federal Reserve announces its decision on 28 October, and the US midterm elections follow on 3 November.
Here is how to read the options signals that separate orderly rotation from broad de-risking, and which of them deserve your attention over the next three weeks.
What the October 16 selloff looked like beneath the index level
At first glance, the damage looked modest. The S&P 500 closed at 7,659.44, and the Dow held up better than tech-heavy benchmarks.
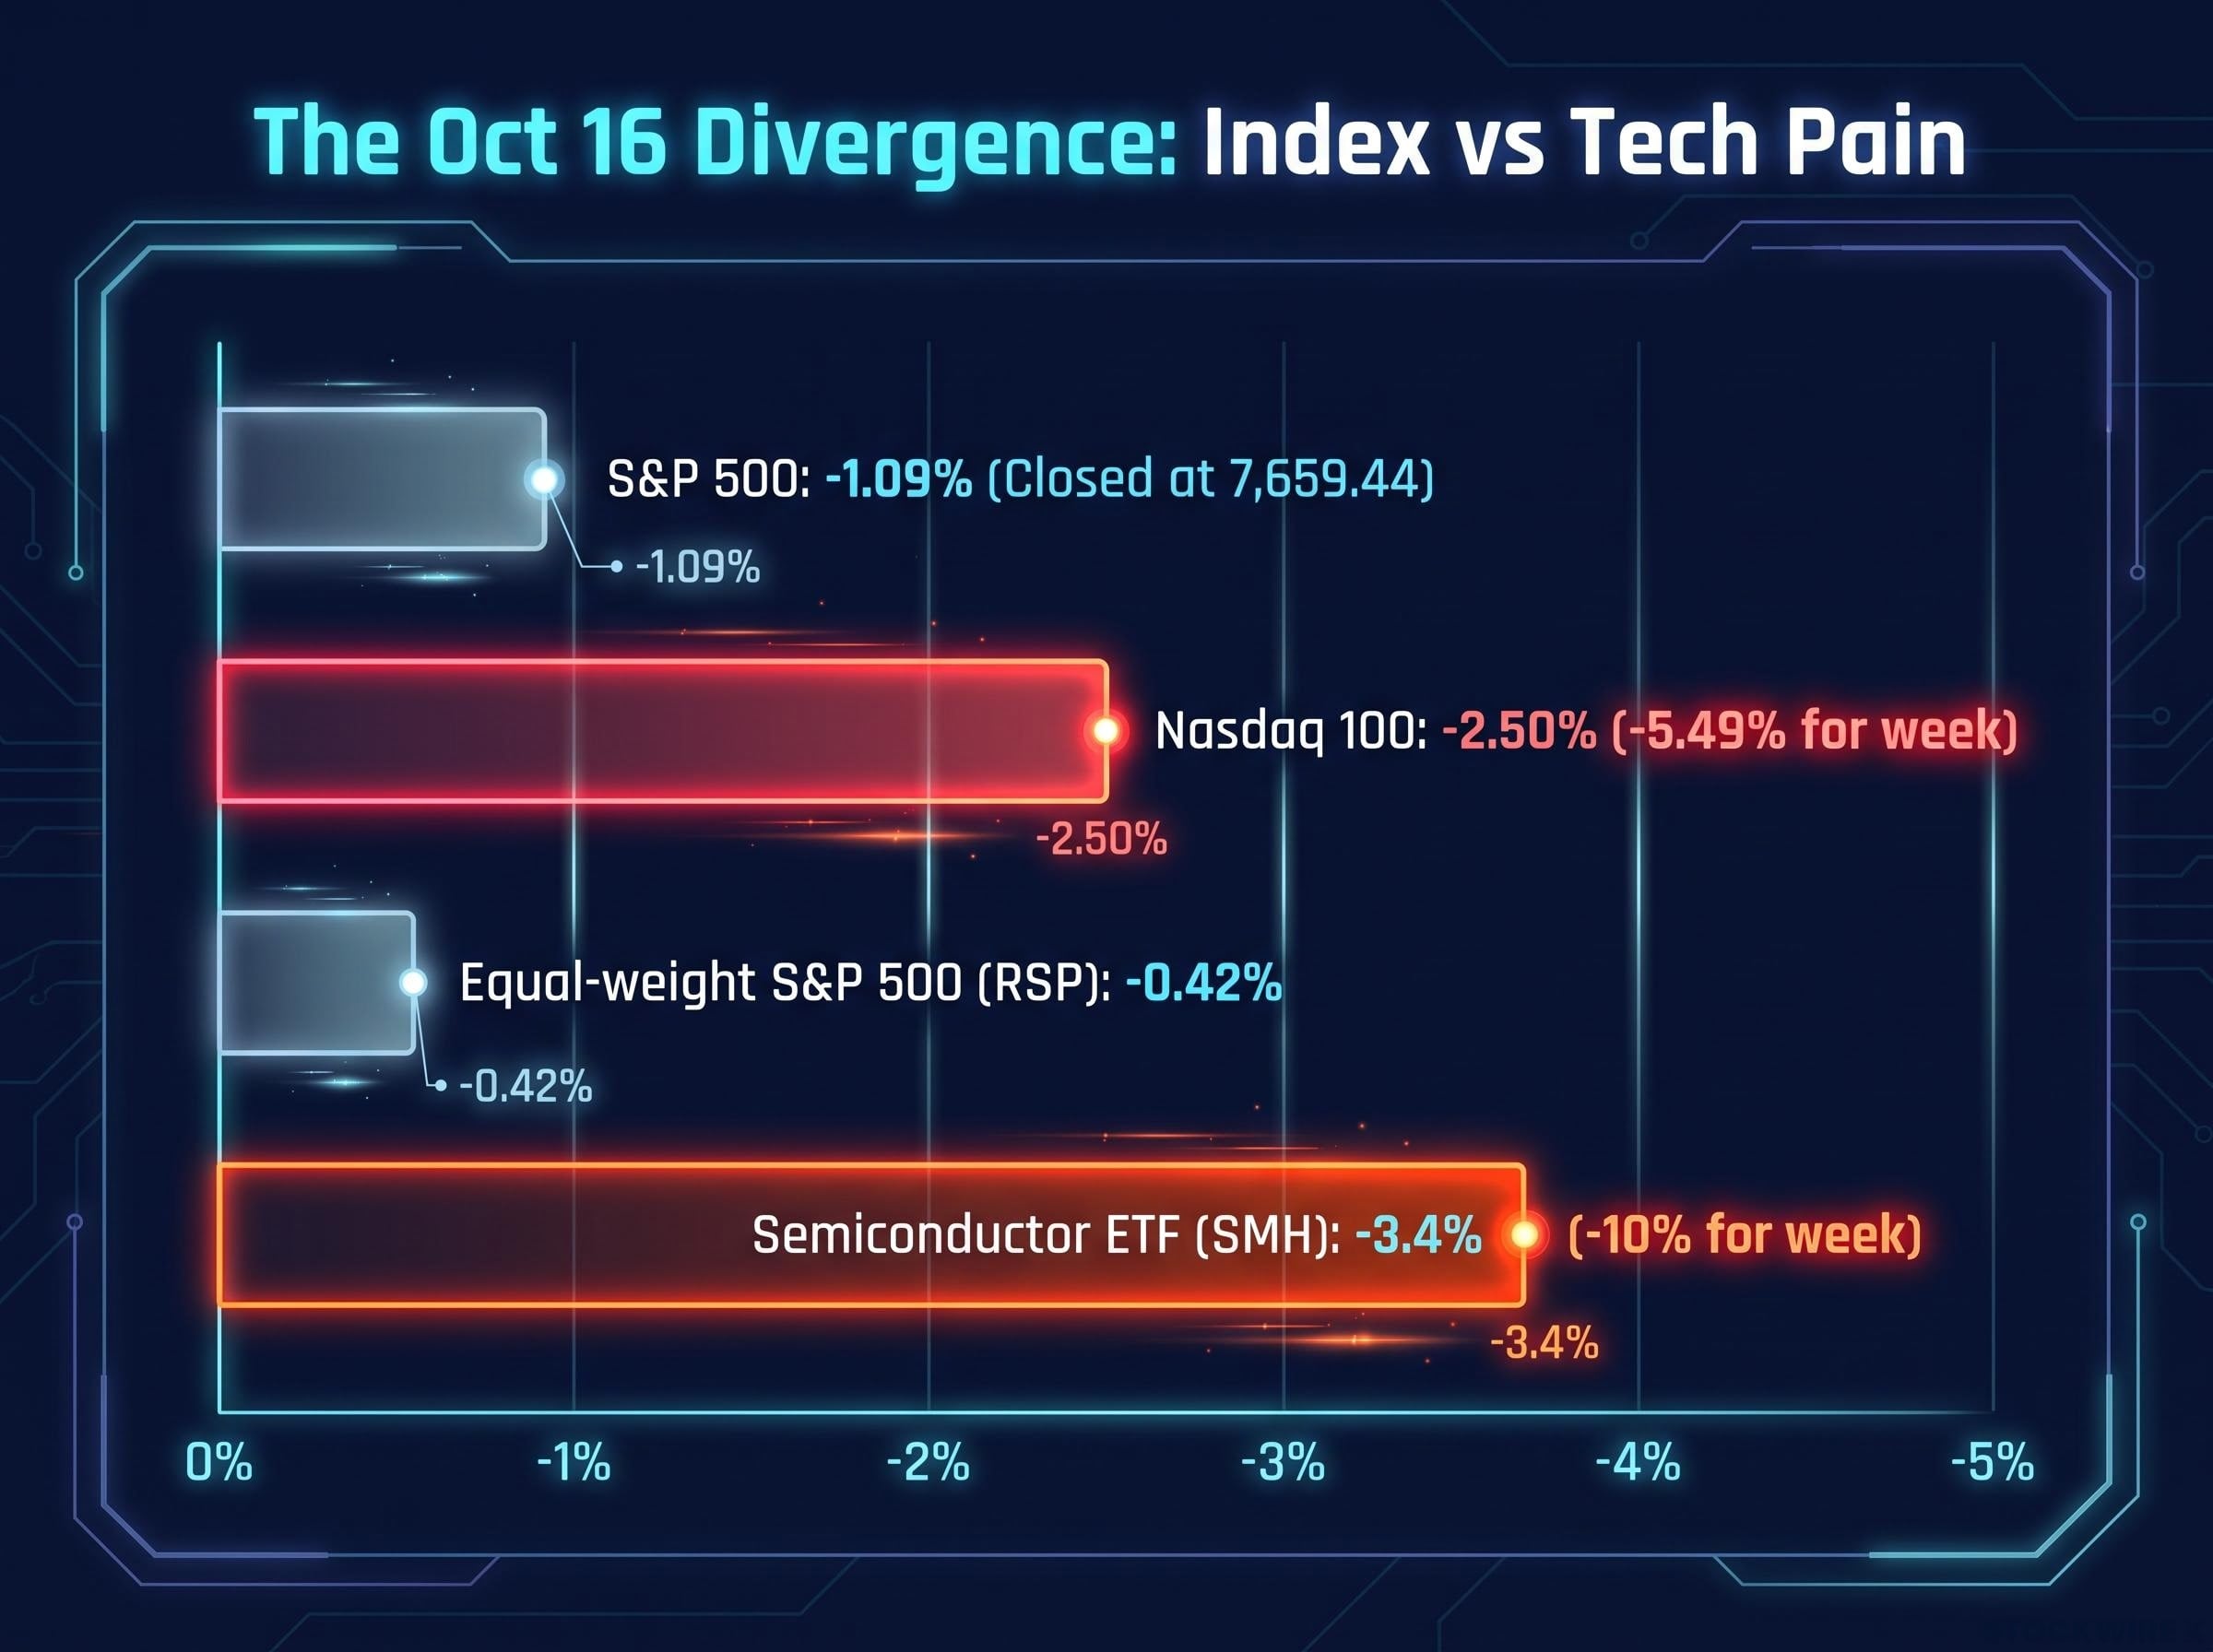
Look one layer down and the picture changes. The pain was concentrated in chipmakers and large technology names, and the rest of the market barely flinched.
| Measure | Oct 16 move | Context |
|---|---|---|
| S&P 500 | -1.09% | Closed at 7,659.44 |
| Nasdaq 100 | -2.50% | Down 5.49% for the week |
| Equal-weight S&P 500 (RSP) | -0.42% | Far milder than the cap-weighted index |
| Semiconductor ETF (SMH) | About -3.4% | About -10% for the week, its largest weekly fall since April 2025 |
AMD, Intel, Micron and Broadcom were among the decliners. Saxo Bank tracked money moving from chipmakers into healthcare, banks and smaller companies, which is a reshuffle rather than a stampede for the exit.
A single news item helped set this off. The chain ran like this:
- On 6 October, reports emerged that Chinese memory maker ChangXin Memory Technologies (CXMT) had advanced a higher-density 4F² DRAM design, with separate reporting citing a 30%-50% increase in chip density.
- CXMT reportedly targeted next-generation server-memory products for year end.
- SMH and a Korean index ETF peaked that day and fell about 15%, while RSP rose about 10% over the same stretch.
Notice what did not happen: no earnings collapse. One development repriced a global chip group on the question of future margins alone. Quarter-end fund reallocation may also have played a part, and Nike jumped about 6% the previous day after a long stretch as a laggard.
The gap between cap-weighted and equal-weight performance tells you the pain sits in a handful of heavily weighted names. Your own exposure to those names matters far more than the S&P headline.
Why the rotation looked healthy
Technicians generally treat broadening participation as a sign of a sturdier rally. Nasdaq 100 participation ran at roughly 45-55% for the week, well short of the 70% or 30% levels that tend to mark washouts.
Rates helped too. A rate measure cited by Brent Kachuba of SpotGamma fell from 5.3 to 5.1 in a week, favouring rate-sensitive laggards such as Deere, Costco, Walmart and the financial (XLF) and utilities (XLU) sector funds. Breadth gives you the first clue; options data gives you the second.
When big ASX news breaks, our subscribers know first
How options market volatility works: expiration, skew, fixed strikes and the Greeks
Most investors watch the VIX. The problem is that the VIX can fall while nervous investors keep buying protection.
The gap between the VIX and single-stock volatility is partly mechanical: dealer gamma hedging and structured product flows can pin the index while individual names swing sharply, which is why your own holdings matter more than the headline.
The VIX measures the 30-day volatility that S&P 500 options prices imply, according to Cboe. It is not realised volatility, which is how much prices actually moved. The VXN applies the same idea to the Nasdaq 100.
Cboe builds the VIX from a strip of out-of-the-money S&P 500 options across two expiries, blended to a constant 30-day horizon. Because implied volatility has historically run above the volatility that follows, the index works as a price tag on protection.
VIX is an insurance price, not a forecast.
Why fixed strikes beat the headline index
Here is the mechanical catch. When markets rally, the strikes feeding the VIX shift to ones that carry lower implied volatility, so the index drops even if hedging demand is unchanged. A falling VIX, on its own, does not prove investors stopped buying insurance.
Kachuba argues that tracking one specific option gives you a cleaner read. A 25-delta one-month put (a put roughly a quarter as sensitive to price moves as the stock itself) or a fixed strike such as 600 in SPY or QQQ isolates genuine changes in demand. Falling fixed-strike volatility is generally supportive, while rising volatility on strikes 5-10% out of the money suggests investors are hedging.
Skew, gamma and vanna in plain English
- Skew: the price of downside puts relative to upside calls; high skew means you are paying up for crash protection.
- Gamma: how fast an option’s price sensitivity changes; dealers who are long gamma dampen moves, while short-gamma dealers can reinforce them.
- Vanna: how an option’s price sensitivity changes when implied volatility moves; falling volatility can push dealer hedging in a way that supports rallies.
These measures describe how flows behave. They do not predict direction.
Expiration adds one more layer. SpotGamma reports that prices have mean-reverted after expiration about two-thirds of the time, and that realised volatility often compresses into expiry and widens afterwards.
What the options signals said about the correction
With those tools in hand, you can read 16 October one signal at a time. Most of the evidence leans benign.
Signals pointing to a contained correction
- Expiration relief. The monthly expiry carried roughly $1 trillion in notional value, with single-stock flows about 66% calls, per SpotGamma. The S&P index expiry was a regular monthly one, while the bigger roll-off sat in Mag 7 single stocks.
- Fixed-strike volatility eased. Kachuba noted lower fixed-strike vols than on Wednesday, and longer-dated Nasdaq 100 skew stayed near 90-day lows. That is no panic bid.
- A moderate Nasdaq premium. VXN sat near 22.9, putting the VXN/VIX ratio at 1.39, up from 1.34.
- Falling correlation. Three-month implied correlation dropped 5.94% to 12.04%, meaning stocks were expected to move separately, not together.
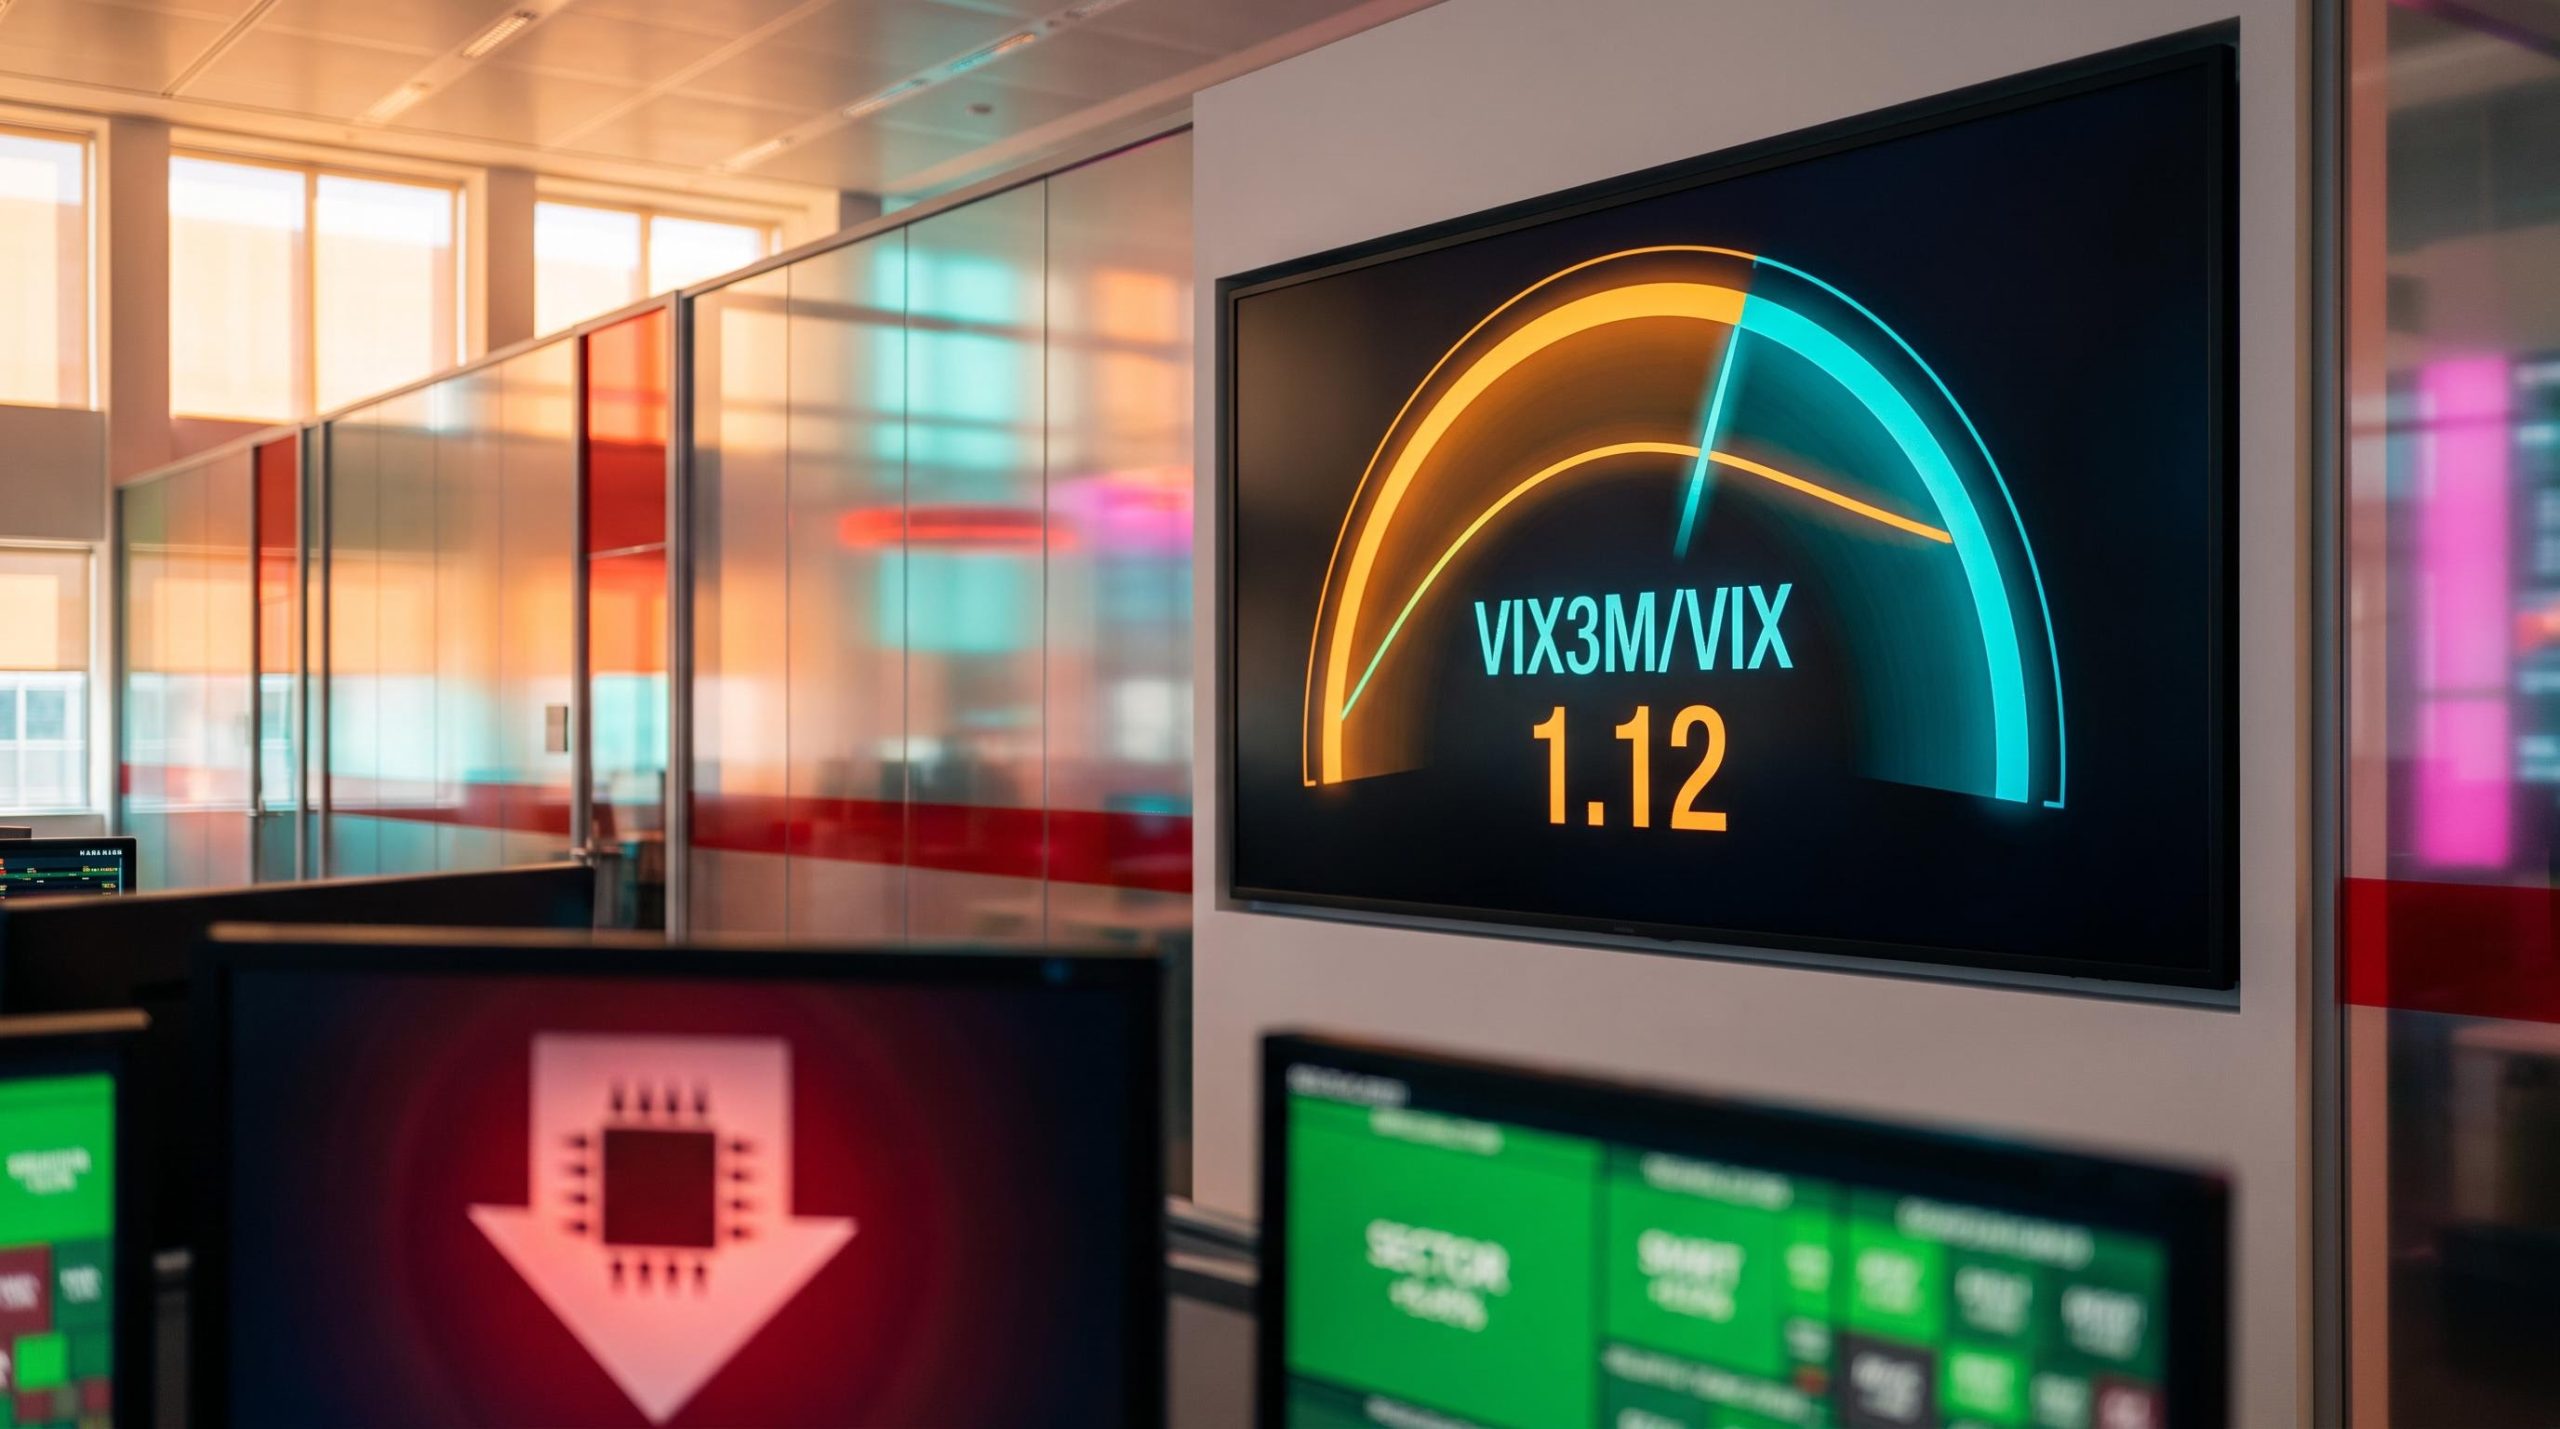
- Contango. VIX3M/VIX held at 1.12 versus 1.11, so longer-dated protection stayed pricier than near-term cover.
The premium in perspective: a 39% VXN premium over VIX looks mild beside the roughly 150% spike about three months earlier, during Q2 earnings.
Kevin David of Nasdaq cited a long-run VXN premium of about 25%, though that figure rests on a single source and could not be independently verified. The premium was about 37% a week earlier. A concentrated premium with low correlation tells you the market is pricing a sector problem, not a systemic one. That reading lapses the moment correlation rises.
Implied correlation has been sitting near record lows for months, a backdrop that explains why sector-specific shocks can hit chipmakers hard without dragging the rest of the market down with them.
Signals that would change the reading
The VIX still traded above 22 intraday, a four-month high, before a later snapshot showed 16.46. Heavy November VIX call buying, including several trades above $1 million, also suggests some investors are extending hedges past expiry.
| Signal | Reading | What it suggests |
|---|---|---|
| Implied correlation (supportive) | 12.04%, down 5.94% | Dispersion, not synchronised selling |
| VIX term structure (supportive) | VIX3M/VIX 1.12 | No near-term panic |
| SKEW index (cautionary) | 155.06 on 13 October | Some tail-protection demand |
| Nasdaq 100 skew (mixed) | Positive 25-delta on 15 October | Calls at a premium; upside speculation |
| Nasdaq 100 trend (cautionary) | Below 50-day moving average | Momentum has weakened |
Mega-cap dominance can also flatter index resilience. Kachuba said losing 7,700 on the S&P 500 or a correlation spike would worry him, and the index already closed below that level. That makes correlation and the VIX curve your decisive tests.
The calendar ahead: earnings, the Fed and the midterms
Interpretation only helps if you know when to check again. Next week brings Tesla, SpaceX and Netflix, and the heaviest mega-cap reports land the week after.
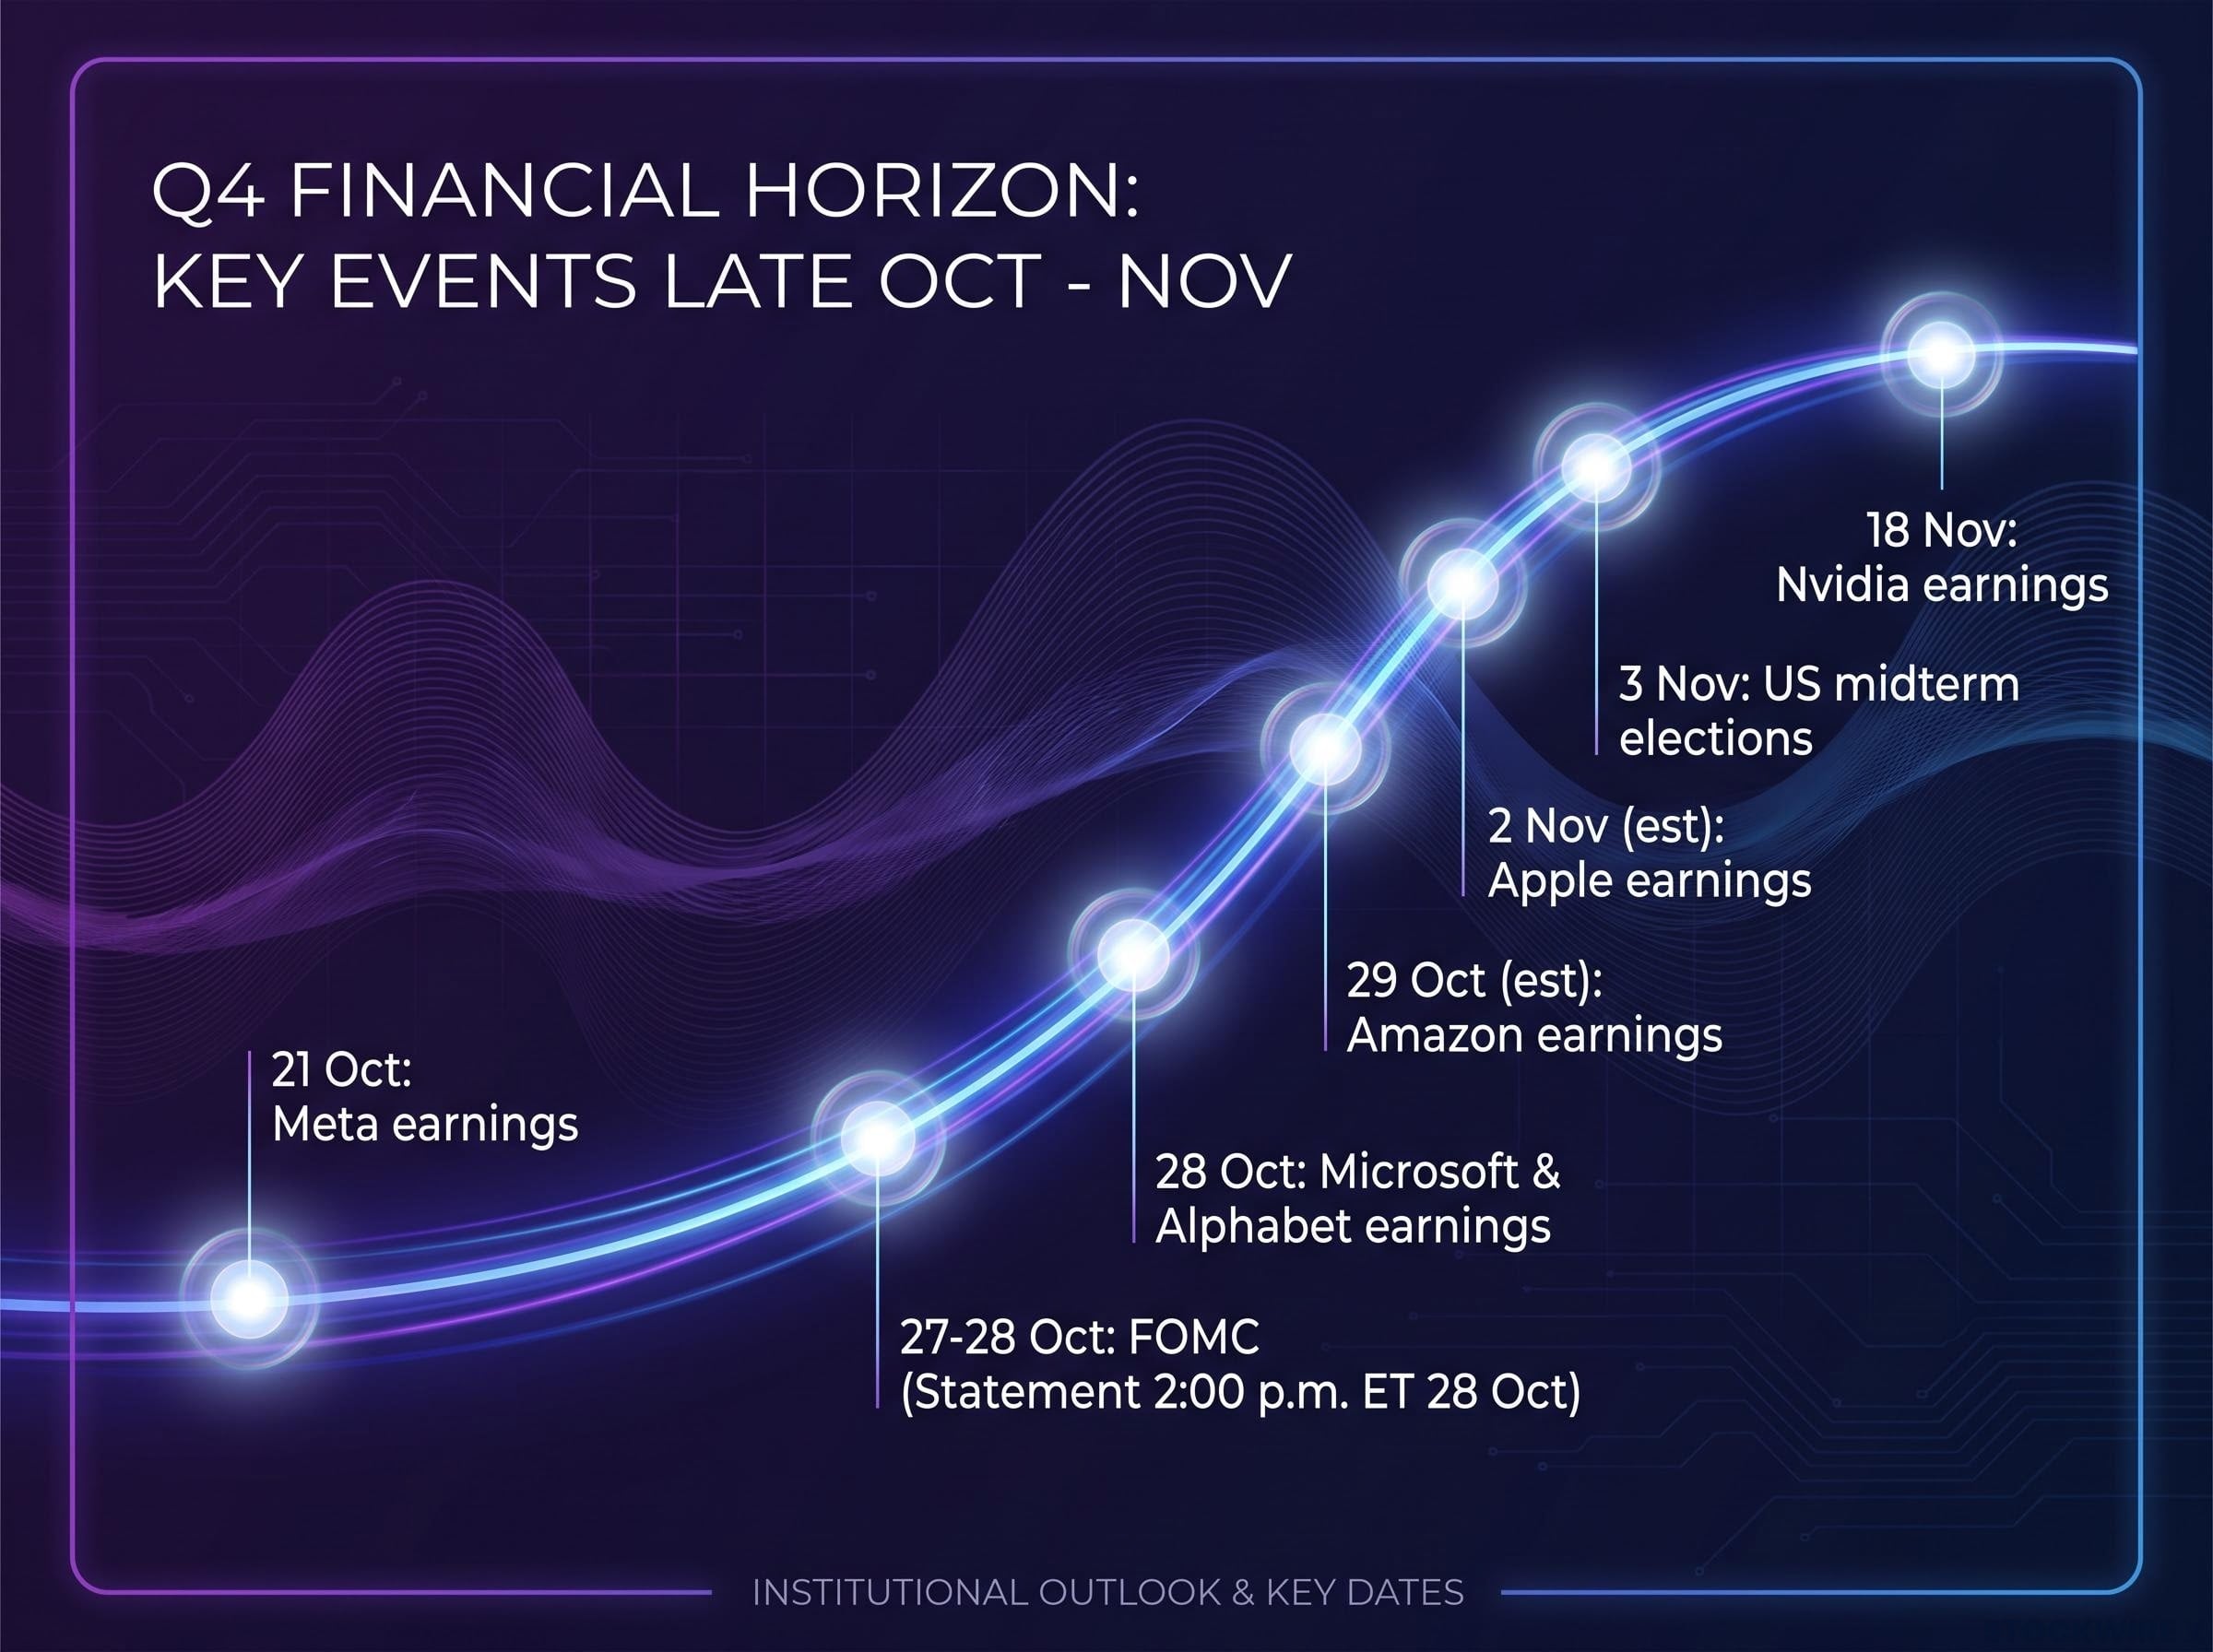
| Date | Event | Indicator to watch |
|---|---|---|
| 21 October | Meta earnings (date moved up) | VXN/VIX premium |
| 27-28 October | FOMC; statement 2:00 p.m. ET on 28 October | VIX term structure |
| 28 October | Microsoft and Alphabet earnings | Implied correlation |
| 29 October (est.) | Amazon earnings | Fixed-strike downside vol |
| 2 November (est.) | Apple earnings | Implied correlation |
| 3 November | US midterm elections | VIX term structure |
| 18 November (not consistently confirmed) | Nvidia earnings | SMH fixed-strike vol |
Options pricing cannot tell you which way the midterms will move markets. It can only show how much protection costs going in.
Gaps can run both ways. The largest recent move came the Monday after Meta’s last report, when the S&P 500 rose 3% and Meta 10%, and upside realised volatility has recently outpaced the downside equivalent. Kachuba favours upside tail exposure, such as calls on Nvidia and SMH, and points to positive seasonality into year end. He is also watching 10-year yields and Anthropic news.
- Upside tail: strong earnings, a dovish Fed, easing yields or renewed AI demand.
- Downside tail: CXMT competition, weaker AI returns, higher rates, disappointing cloud growth or a margin shock.
Six mega-caps report inside a compressed window, so single-stock gaps may matter more than index signals. Treat any correlation spike as the real alarm.
What would turn rotation into de-risking
The benign reading fails if buyers of non-tech sectors disappear. Watch for correlation spiking and the VIX curve flattening or inverting together, which could turn orderly rotation into broad selling quickly.
Reading the next three weeks without over-reading the signals
The frame is simple. Sector-level stress with low correlation reads as a correction and a broadening market. Rising correlation alongside a flat VIX curve reads as that thesis breaking.
Keep four gauges in view:
- Implied correlation
- VIX term structure
- Fixed-strike downside volatility
- The VXN/VIX premium
Remember that implied volatility is the price of protection, not a forecast. No signal replaces your own judgement about how concentrated your portfolio is in the names doing the damage.
Past performance does not guarantee future results. Financial projections are subject to market conditions and various risk factors. These statements are speculative and subject to change based on market developments and company performance.
This article is for informational purposes only and should not be considered financial advice. Investors should conduct their own research and consult with financial professionals before making investment decisions.
—