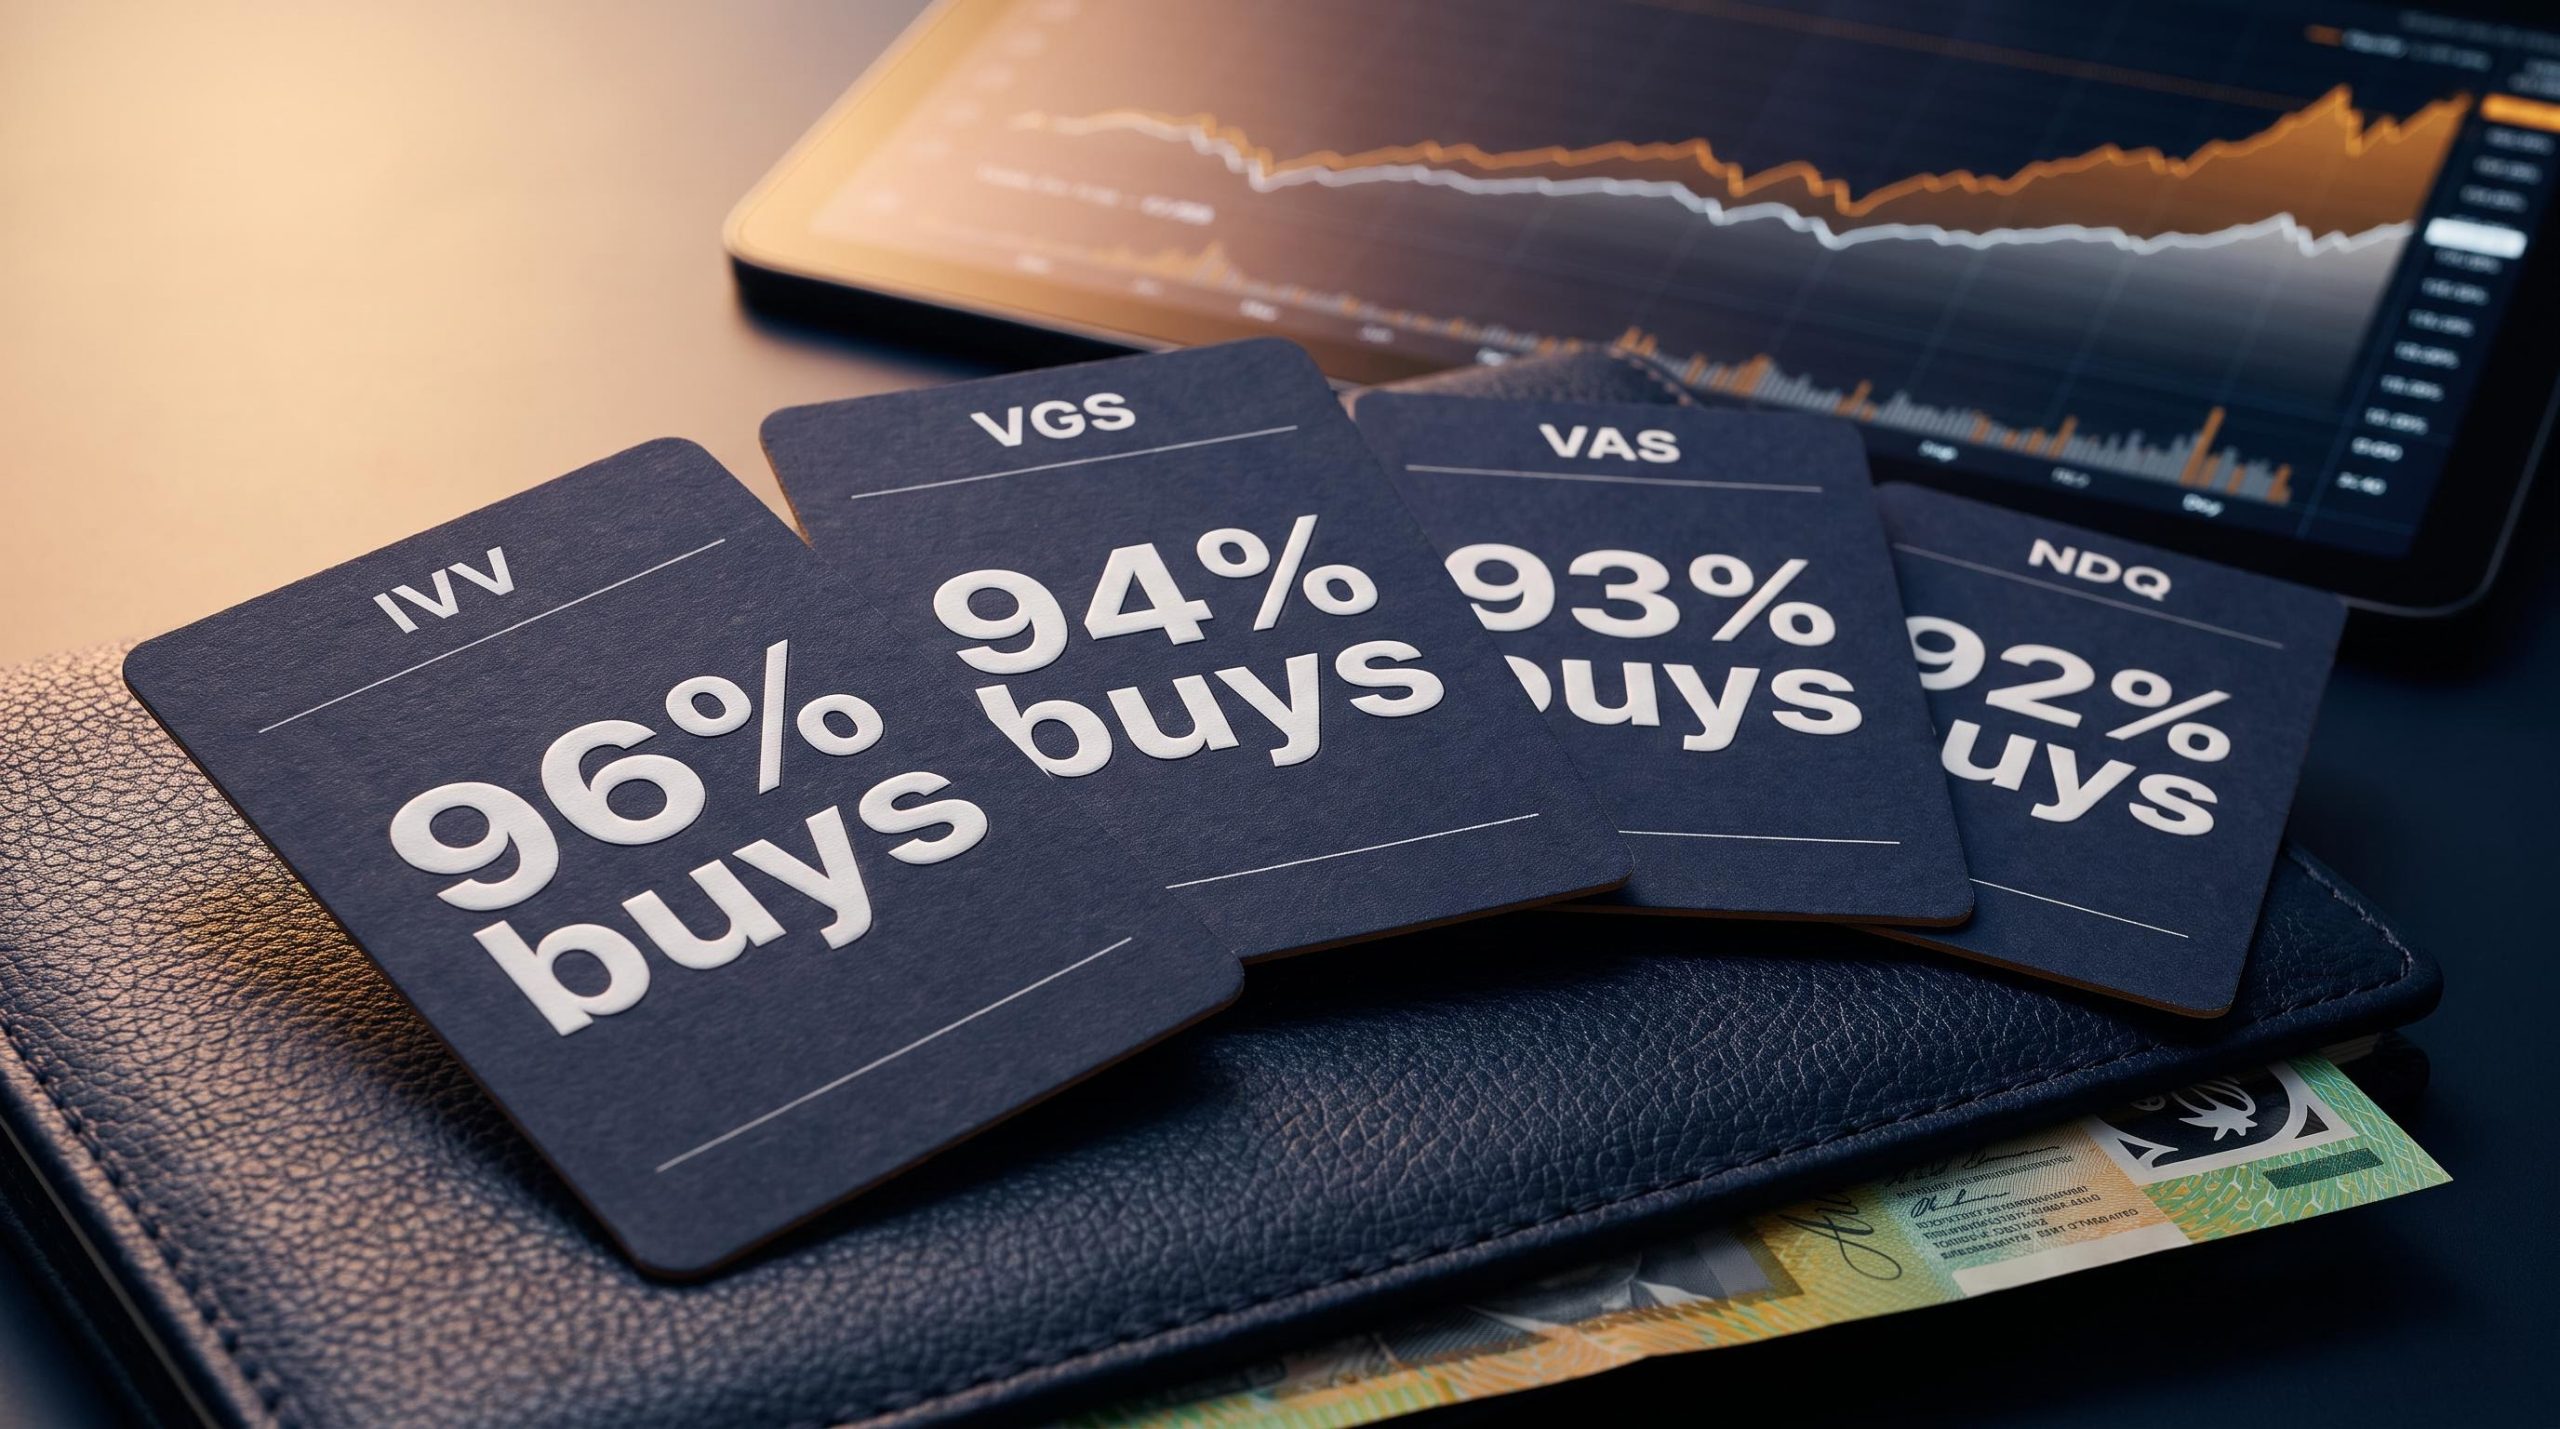
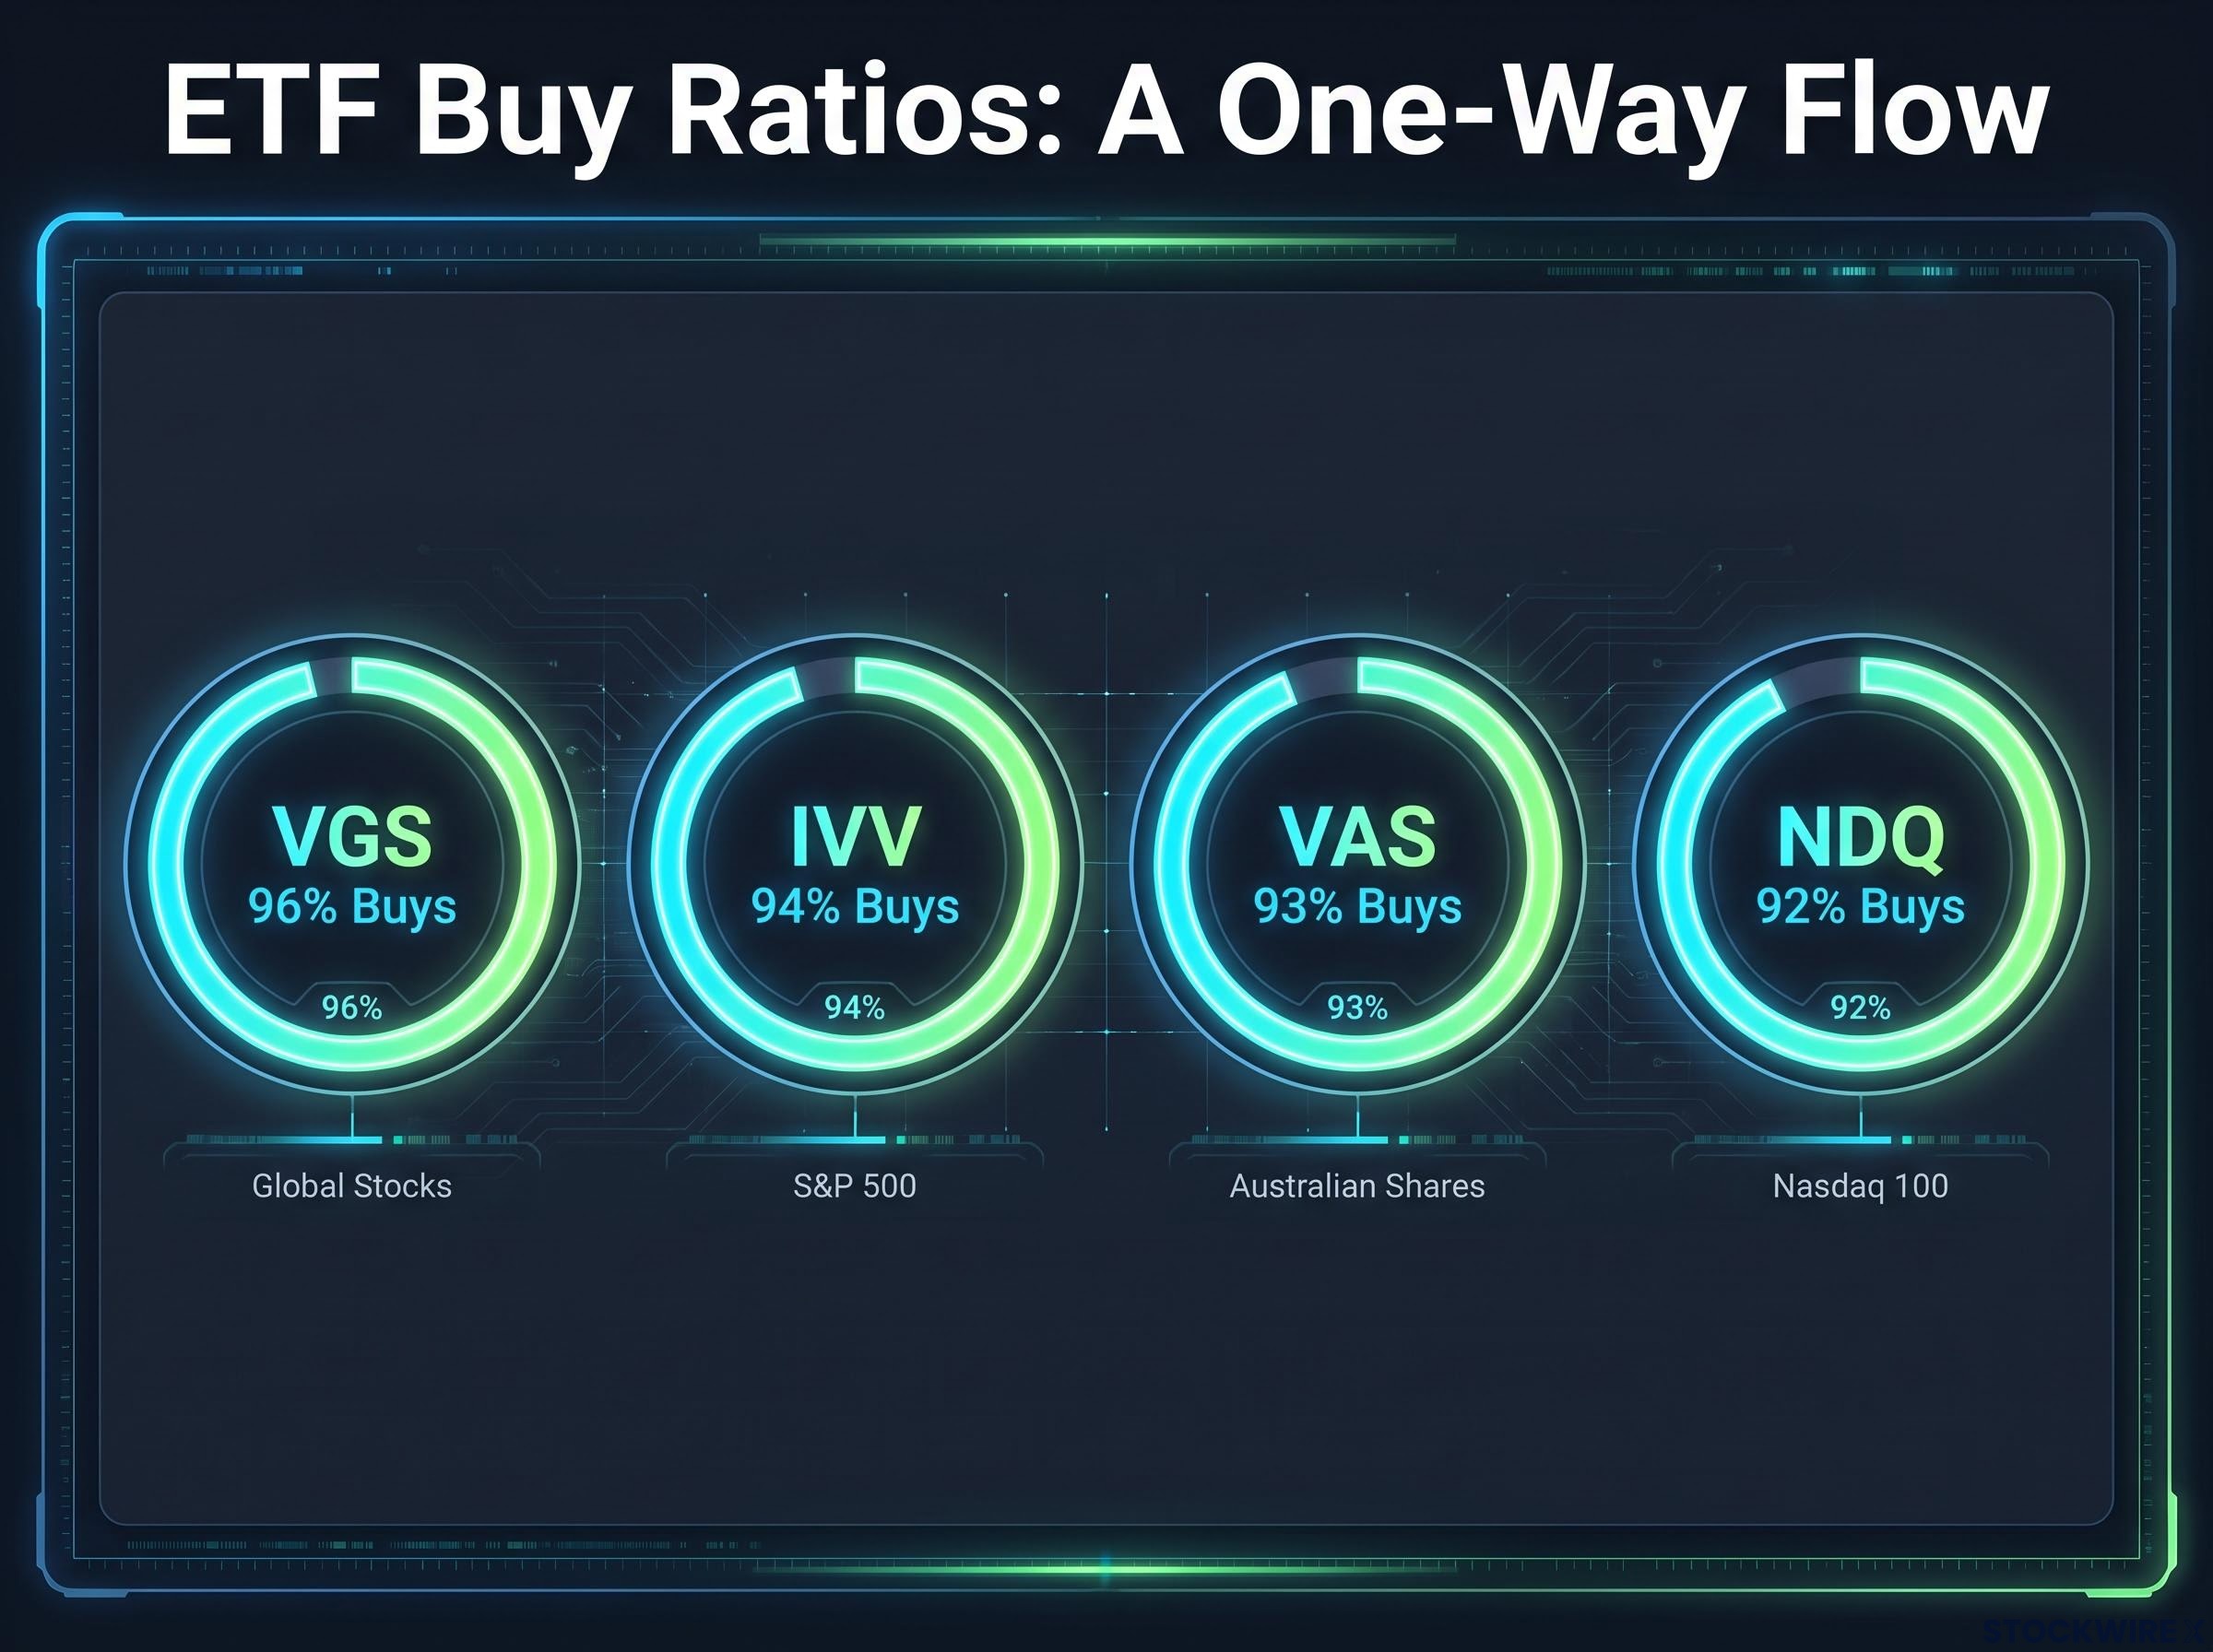
When 94% to 96% of all orders placed on a fund are purchases, that is not a market. A market implies two sides, buyers and sellers finding a price between them. What CMC Invest recorded across its two most-traded exchange-traded funds in the first half of FY26 looks more like a one-way flow of conviction, and it demands an explanation.
That data comes from a survey of more than 8,500 Australian investors, conducted by CMC Invest over the first half of FY26. It captured a moment when exchange-traded funds (ETFs), which are baskets of shares that track an index and trade like a single stock, had structurally overtaken direct share buying as the default way Australians put money to work.
The numbers make the shift plain: 48% of respondents increased their ETF allocations over the period, against 38% who added to individual ASX positions.
This is an analysis of the four funds leading that reallocation, the most popular ETFs in Australia by order flow. After reading, you will know what each fund holds, what the lopsided buying actually signals about investor conviction, and where the thesis buried inside these choices could come under real pressure.
ETFs have overtaken direct shares as how Australians actually invest now
Start with the concentration. Those four funds, IVV, VGS, VAS, and NDQ, accounted for roughly 75% of the top 10 orders placed by CMC retail clients in the first half of FY26. Four products absorbing three-quarters of the most-traded names is not a diversified order book. It is a herd moving in formation.
The allocation gap sharpens the picture. 48% of surveyed investors added to ETF positions, 38% added to ASX shares directly, and only 21% added to US equities through individual stocks. That spread is the tell.
The single most telling contrast 48% of investors increased ETF allocations. Just 38% added to individual ASX shares. Diversified index exposure has become the instinctive first move, not the considered second one.
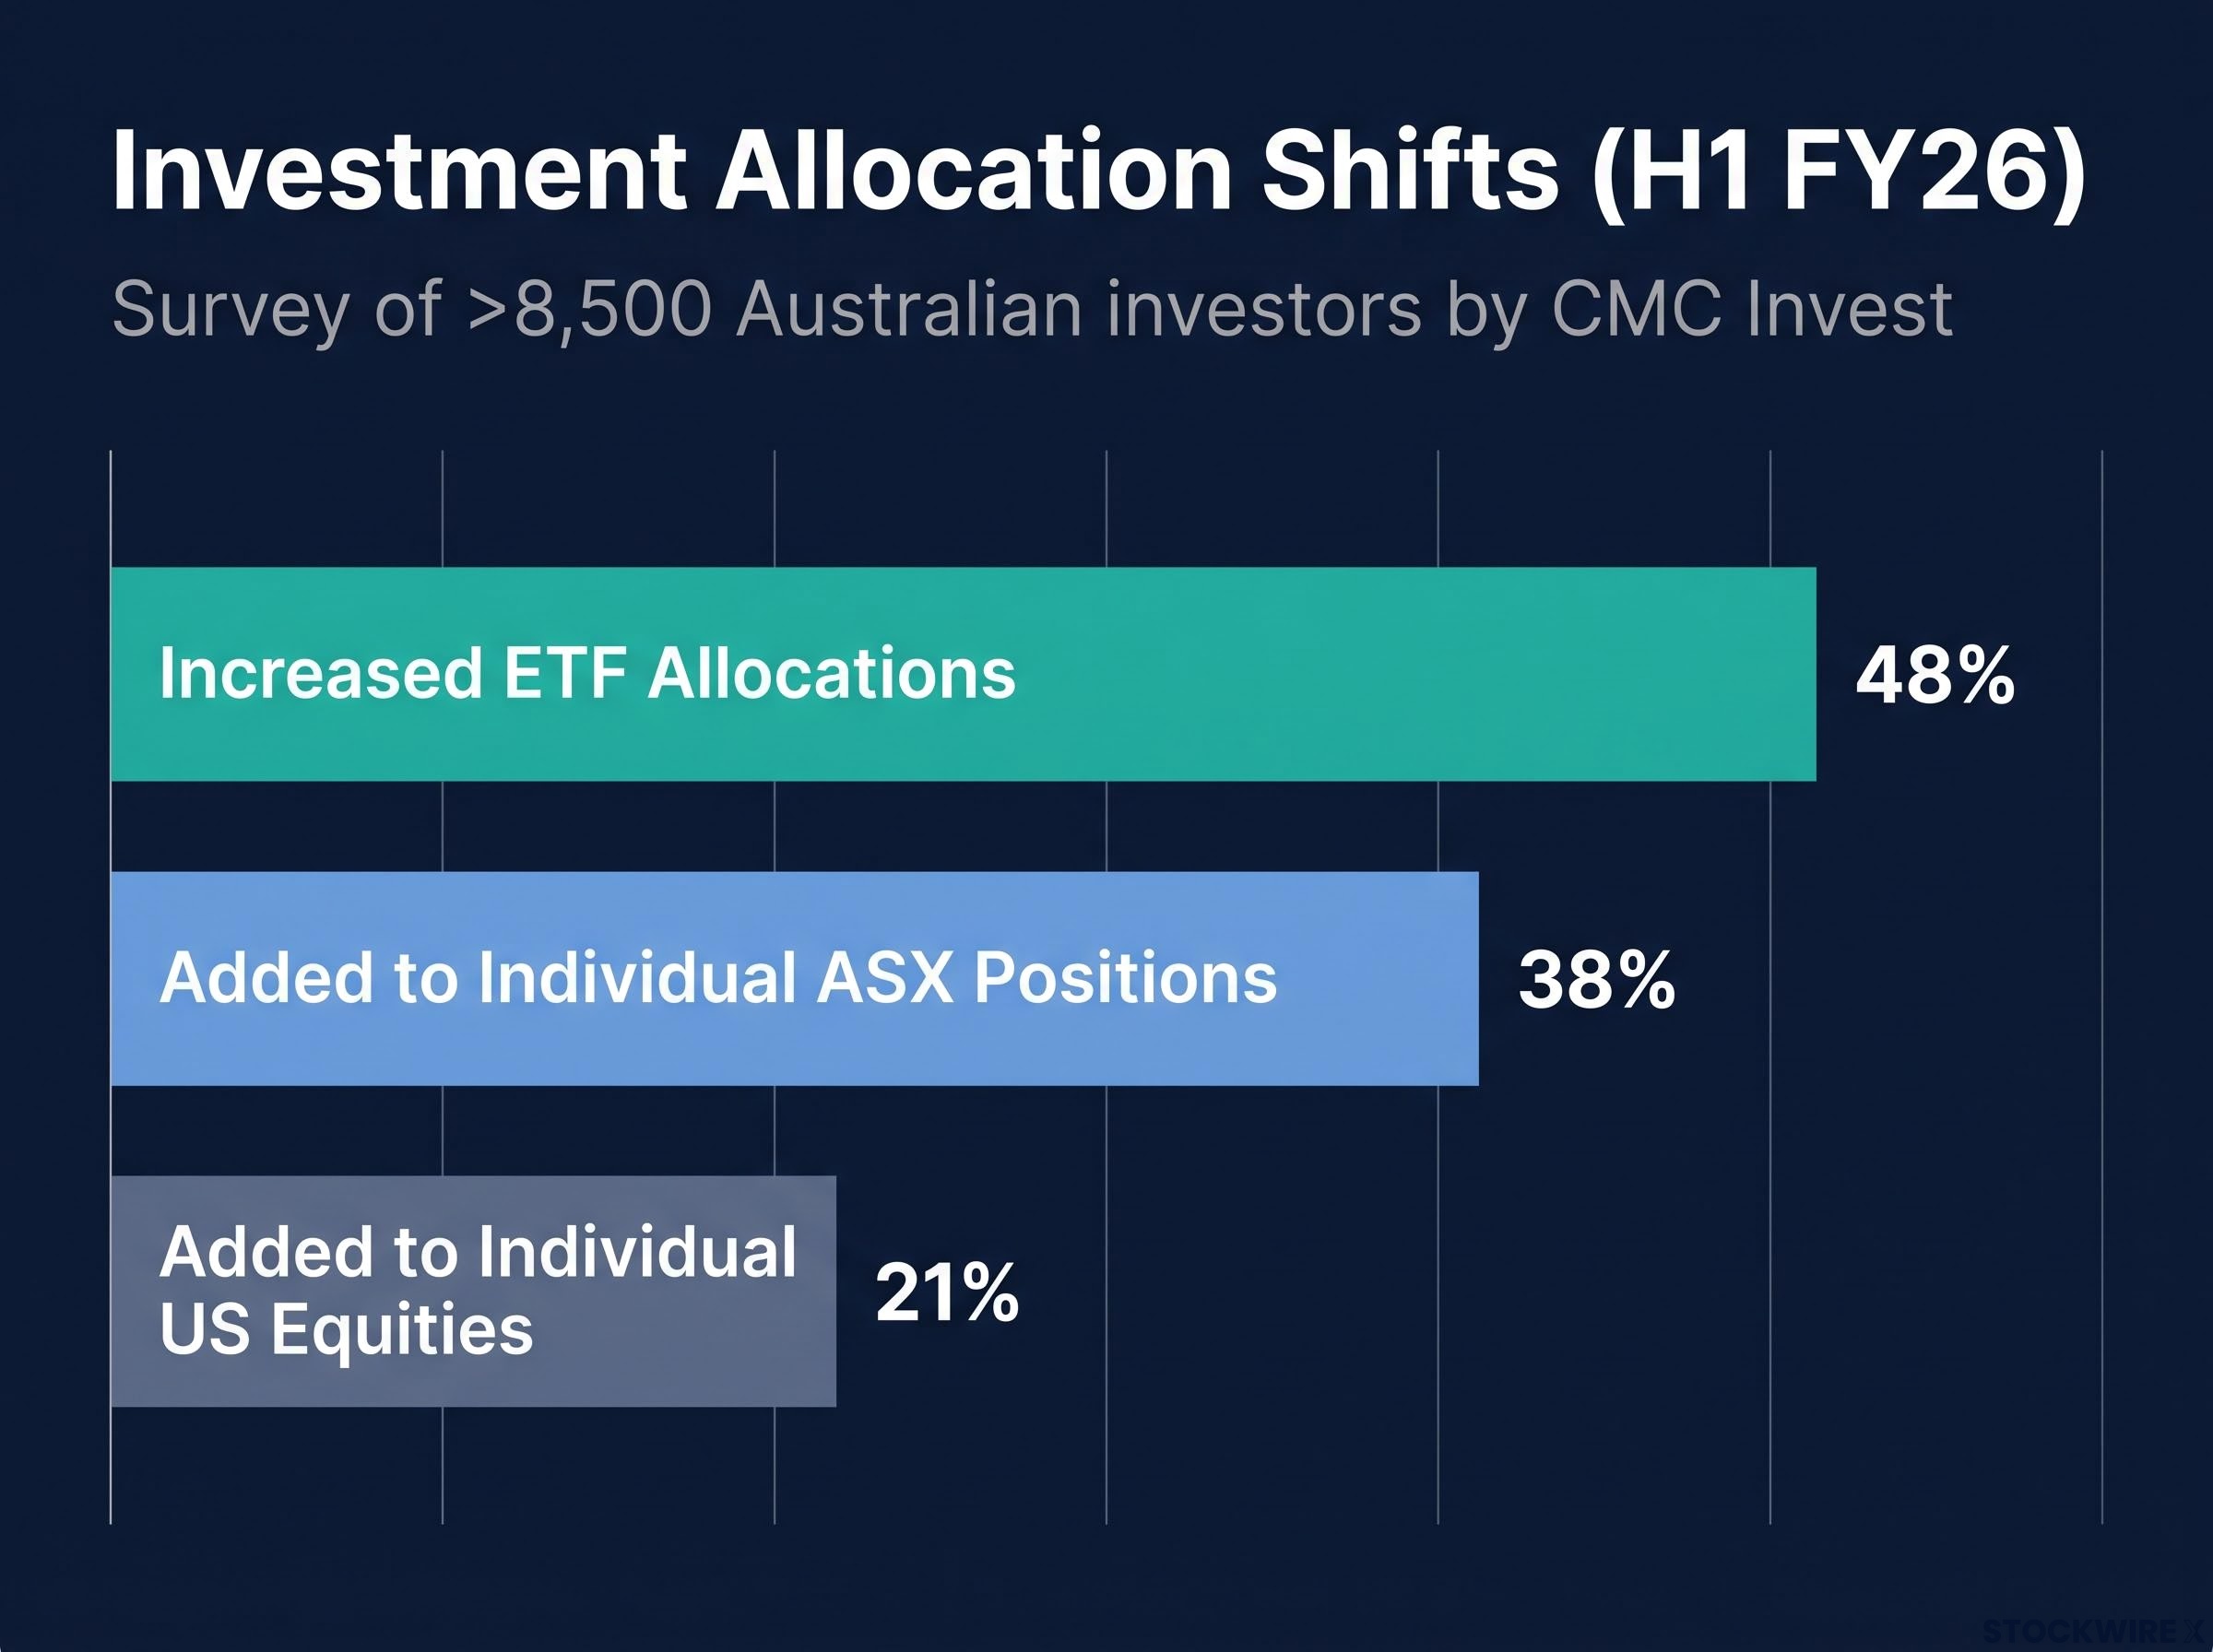
What that gap tells you is that buying an index has replaced picking a company as the reflex action for Australian retail investors. This matters because it is not a passing mood. It signals a permanent change in how wealth is being built at the retail level, and at scale.
The passive versus active ETF evidence sharpens the case for the four funds in this analysis: 74% of Australian equity active managers failed to beat the S&P/ASX 200 in 2025, rising to 87% over 15 years, which helps explain why the most-bought products on CMC’s platform are all low-cost index trackers rather than active strategies.
The preference is also forward-looking, not just habitual. When CMC asked respondents which asset class they expected to perform best over the following six months, the ranking looked like this:
- ETFs: 29%
- US shares: 21%
- Global shares: 16%
- ASX shares: 16%
- Commodities: 14%
ETFs topping the expectations list, ahead of the US shares many of these funds actually hold, shows conviction rather than convenience.
The industry backdrop confirms the scale. Australian ETF assets reached approximately $377 billion by the end of Q2 2026, with more than $50 billion in net inflows across FY26. The year also delivered a record 72 new listings, taking the total to 458 products. This is no longer a trend competing for attention. It is the architecture.
When big ASX news breaks, our subscribers know first
The four funds: what each one tracks and why it made this list
Before the analysis, the products. Each of these four funds does a different job, and the buy-to-sell ratio attached to each one reads as a verdict on how convinced investors are.
The iShares S&P 500 ETF (IVV) is the most widely held ETF among CMC clients. It replicates the S&P 500, which means heavy exposure to the US artificial intelligence platforms: Meta, Amazon, Alphabet, and Microsoft. Its order flow ran 94% buys to 6% sells.
The Vanguard MSCI Index International Shares ETF (VGS) tracks the MSCI World ex-Australia Index, holding roughly 1,300 international companies with an 80% tilt toward the US. It is denominated in Australian dollars with net dividends reinvested, and it recorded the highest conviction of the group at 96% buys to 4% sells.
The Vanguard Australian Shares Index ETF (VAS) replicates the S&P/ASX 300, giving broad domestic exposure through names like BHP Group, CBA, and Wesfarmers. Its ratio sat at 93% buys to 7% sells.
The BetaShares Nasdaq 100 ETF (NDQ) tracks the technology-heavy Nasdaq-100 and posted 92% buys to 8% sells, the lowest ratio in the group. Even that lowest figure represents an overwhelming buy consensus.
| Fund (Ticker) | Index Tracked | Geographic Focus | Buy Ratio | YTD Return (approx., Sep 2026) |
|---|---|---|---|---|
| VGS | MSCI World ex-Australia | Global (80% US) | 96% | 4-5% |
| IVV | S&P 500 | United States | 94% | 4-5% |
| VAS | S&P/ASX 300 | Australia | 93% | 1-2% |
| NDQ | Nasdaq-100 | United States (tech) | 92% | 7% |
The ratios cluster tightly, from 92% to 96%. What that near-uniformity tells you is that investors are not rotating between these funds, choosing one over another. They are accumulating all four at once. That is the signature of a conviction-based structural build, not tactical switching, and it means these products are being held and added to rather than traded.
Why Australian investors are betting so heavily on US equities
The buying makes more sense once you look at what these funds returned. Over FY26, US equities delivered a total return of roughly 22%. The ASX 200 managed approximately 7%. That is the anchor for everything else in this section.
The analytical centre of gravity Over FY26, US equities returned roughly 22%. The ASX 200 returned roughly 7%. A three-to-one gap over a full year is not noise. It is the reason three of the four most-bought funds point offshore.
The trailing numbers on the funds themselves confirm the direction. Ranked highest to lowest by FY26-era performance:
- NDQ: 14.96% after fees (1-year to 31 August 2026)
- VGS: approximately 10.03% to 10.82% (trailing 12 months into early September 2026)
- IVV: 9.66% total return (1-year to 31 August 2026)
- VAS: 6.19% gross total return (FY26)
- ASX 200 benchmark: approximately 7% (FY26)
The gap is not sentiment. It is composition. US indices carry heavy weightings in AI infrastructure, cloud platforms, and semiconductors, the parts of the market that have compounded fastest. The Australian benchmark is dominated by banks and miners, which lack direct exposure to AI revenue growth.
That composition point matters because even VGS, which markets itself as a diversified global fund, carries an 80% US tilt. So three of the four most popular funds, everything except VAS, deliver concentrated US and AI-related exposure despite looking spread out.
Professional money is moving the same way. Recent adviser data shows 59% of financial advisers cite US equities as a lead exposure, with ETF usage among advisers up more than 20%.
The home bias reversal visible in CMC’s order data is part of a broader structural break: international ETFs overtook domestic ETFs as the most purchased category on Selfwealth by Syfe in Q1 2026, and approximately 80% of Australian ETF investors plan to increase their international holdings further through the year.
What the three-to-one return gap tells you is that this buying is a rational, performance-chasing response to a measurable and prolonged divergence, not blind enthusiasm. The thesis holds as long as AI-era US earnings growth holds. That conditional is the whole game.
What the buy ratios are not telling you: concentration, currency, and overlap
Here is where the comfort should fade slightly. Buying four diversified index funds feels like diversification. Underneath, it may not be.
Three distinct risks sit beneath the buy ratios:
- Concentration overlap: The top 10 developed-market stocks, all US-listed, make up roughly 25% of the MSCI World benchmark and 37% of the S&P 500. IVV, VGS, and NDQ share the same mega-cap names.
- Currency exposure: IVV and NDQ are unhedged US-dollar positions, so every move in the AUD/USD rate flows straight through to returns.
- Domestic sector layering: Pairing VAS with any US fund stacks concentrated bank and miner exposure beneath concentrated tech exposure.
Currency risk in unhedged US-equity ETFs
IVV and NDQ are priced in Australian dollars but track US-dollar indices. That means every unit of AUD/USD movement changes what an Australian holder actually earns, independent of what the underlying shares do.
The effect cuts both ways, and IVV shows it clearly. Its calendar 2025 return was 17.88% in US-dollar terms. For Australian holders, that translated to roughly 10.13% after currency effects. Recent AUD softness helped returns; a sustained AUD recovery would work in reverse.
More sophisticated investors are already acting. The AUD-hedged equivalent, IHVV, drew $540 million in year-to-date flows in 2025, almost double its total 2024 inflows. That is a signal that awareness of the currency risk is growing.
The hedged versus unhedged decision has never been more consequential for Australian holders of IVV and NDQ: HNDQ returned 40.2% against NDQ’s 27.2% over the year to May 2026, a 13-percentage-point gap produced entirely by AUD/USD appreciation rather than any difference in the underlying Nasdaq-100 index.
Index overlap and the illusion of diversification
IVV, VGS, and NDQ all hold the same cluster of US mega-caps: Apple, Microsoft, Nvidia, Alphabet, Amazon, at varying weights. Buying all three does not spread your risk across genuinely different companies. It concentrates it.
First Sentier Investors noted in 2026 that standard global index allocations are no longer style-neutral. They now represent concentrated bets on mega-cap growth, whether the buyer intends that or not.
Treat this as information, not a warning. What it tells you is that the diversification of holding several ETFs may be thinner than it looks. Knowing that, you can either hold the concentration deliberately or add genuine sector and geographic spread to dilute it.
What Australian investors holding these four ETFs should be watching in the months ahead
The CMC data is a snapshot of what has happened. The more useful question is what to monitor now. Three variables carry the most weight:
- AI earnings delivery. The US outperformance inside IVV, VGS, and NDQ assumes AI infrastructure spending converts into real revenue and margin growth. If that conversion stalls or disappoints, the risk of valuation multiples compressing is significant.
- The AUD/USD trajectory. A sustained strengthening of the Australian dollar would mechanically reduce returns from unhedged US funds. The hedged-versus-unhedged decision matters more now than during the recent stretch of AUD weakness.
- Domestic versus international balance. VAS’s lower buy ratio (93%) and softer FY26 net return (6.12%) show investors underweighting home. Those conditions are mean-reversible, and the ASX’s banks and miners could outperform in a commodity or rate cycle that favours domestic defensives.
There is a broader point in the ratios themselves. The four most popular funds in Australia are also the four highest buy-ratio instruments on the platform. That tells you this is a crowded trade, with the dominant thesis, US and AI outperformance, being bet on at scale.
Crowded trades carry asymmetric downside when the thesis cracks. With an estimated 300,000 first-time ETF investors expected in 2026 and account growth for under-45s running at 42% a year, more capital is flowing into the same names, not fewer.
For investors wanting broader context on what is driving the generational shift toward international index products, our dedicated guide to retail ETF flow trends in 2026 covers how Gen Z and Millennial investors are overcoming home bias and rotating capital from domestic assets into global growth equities.
None of this argues against holding these funds. It argues for holding them with the risk map in view: watch the earnings, watch the currency, and know how much of your apparent diversification is really one concentrated bet.
This article is for informational purposes only and should not be considered financial advice. Investors should conduct their own research and consult with financial professionals before making investment decisions. Past performance does not guarantee future results. Financial projections are subject to market conditions and various risk factors.