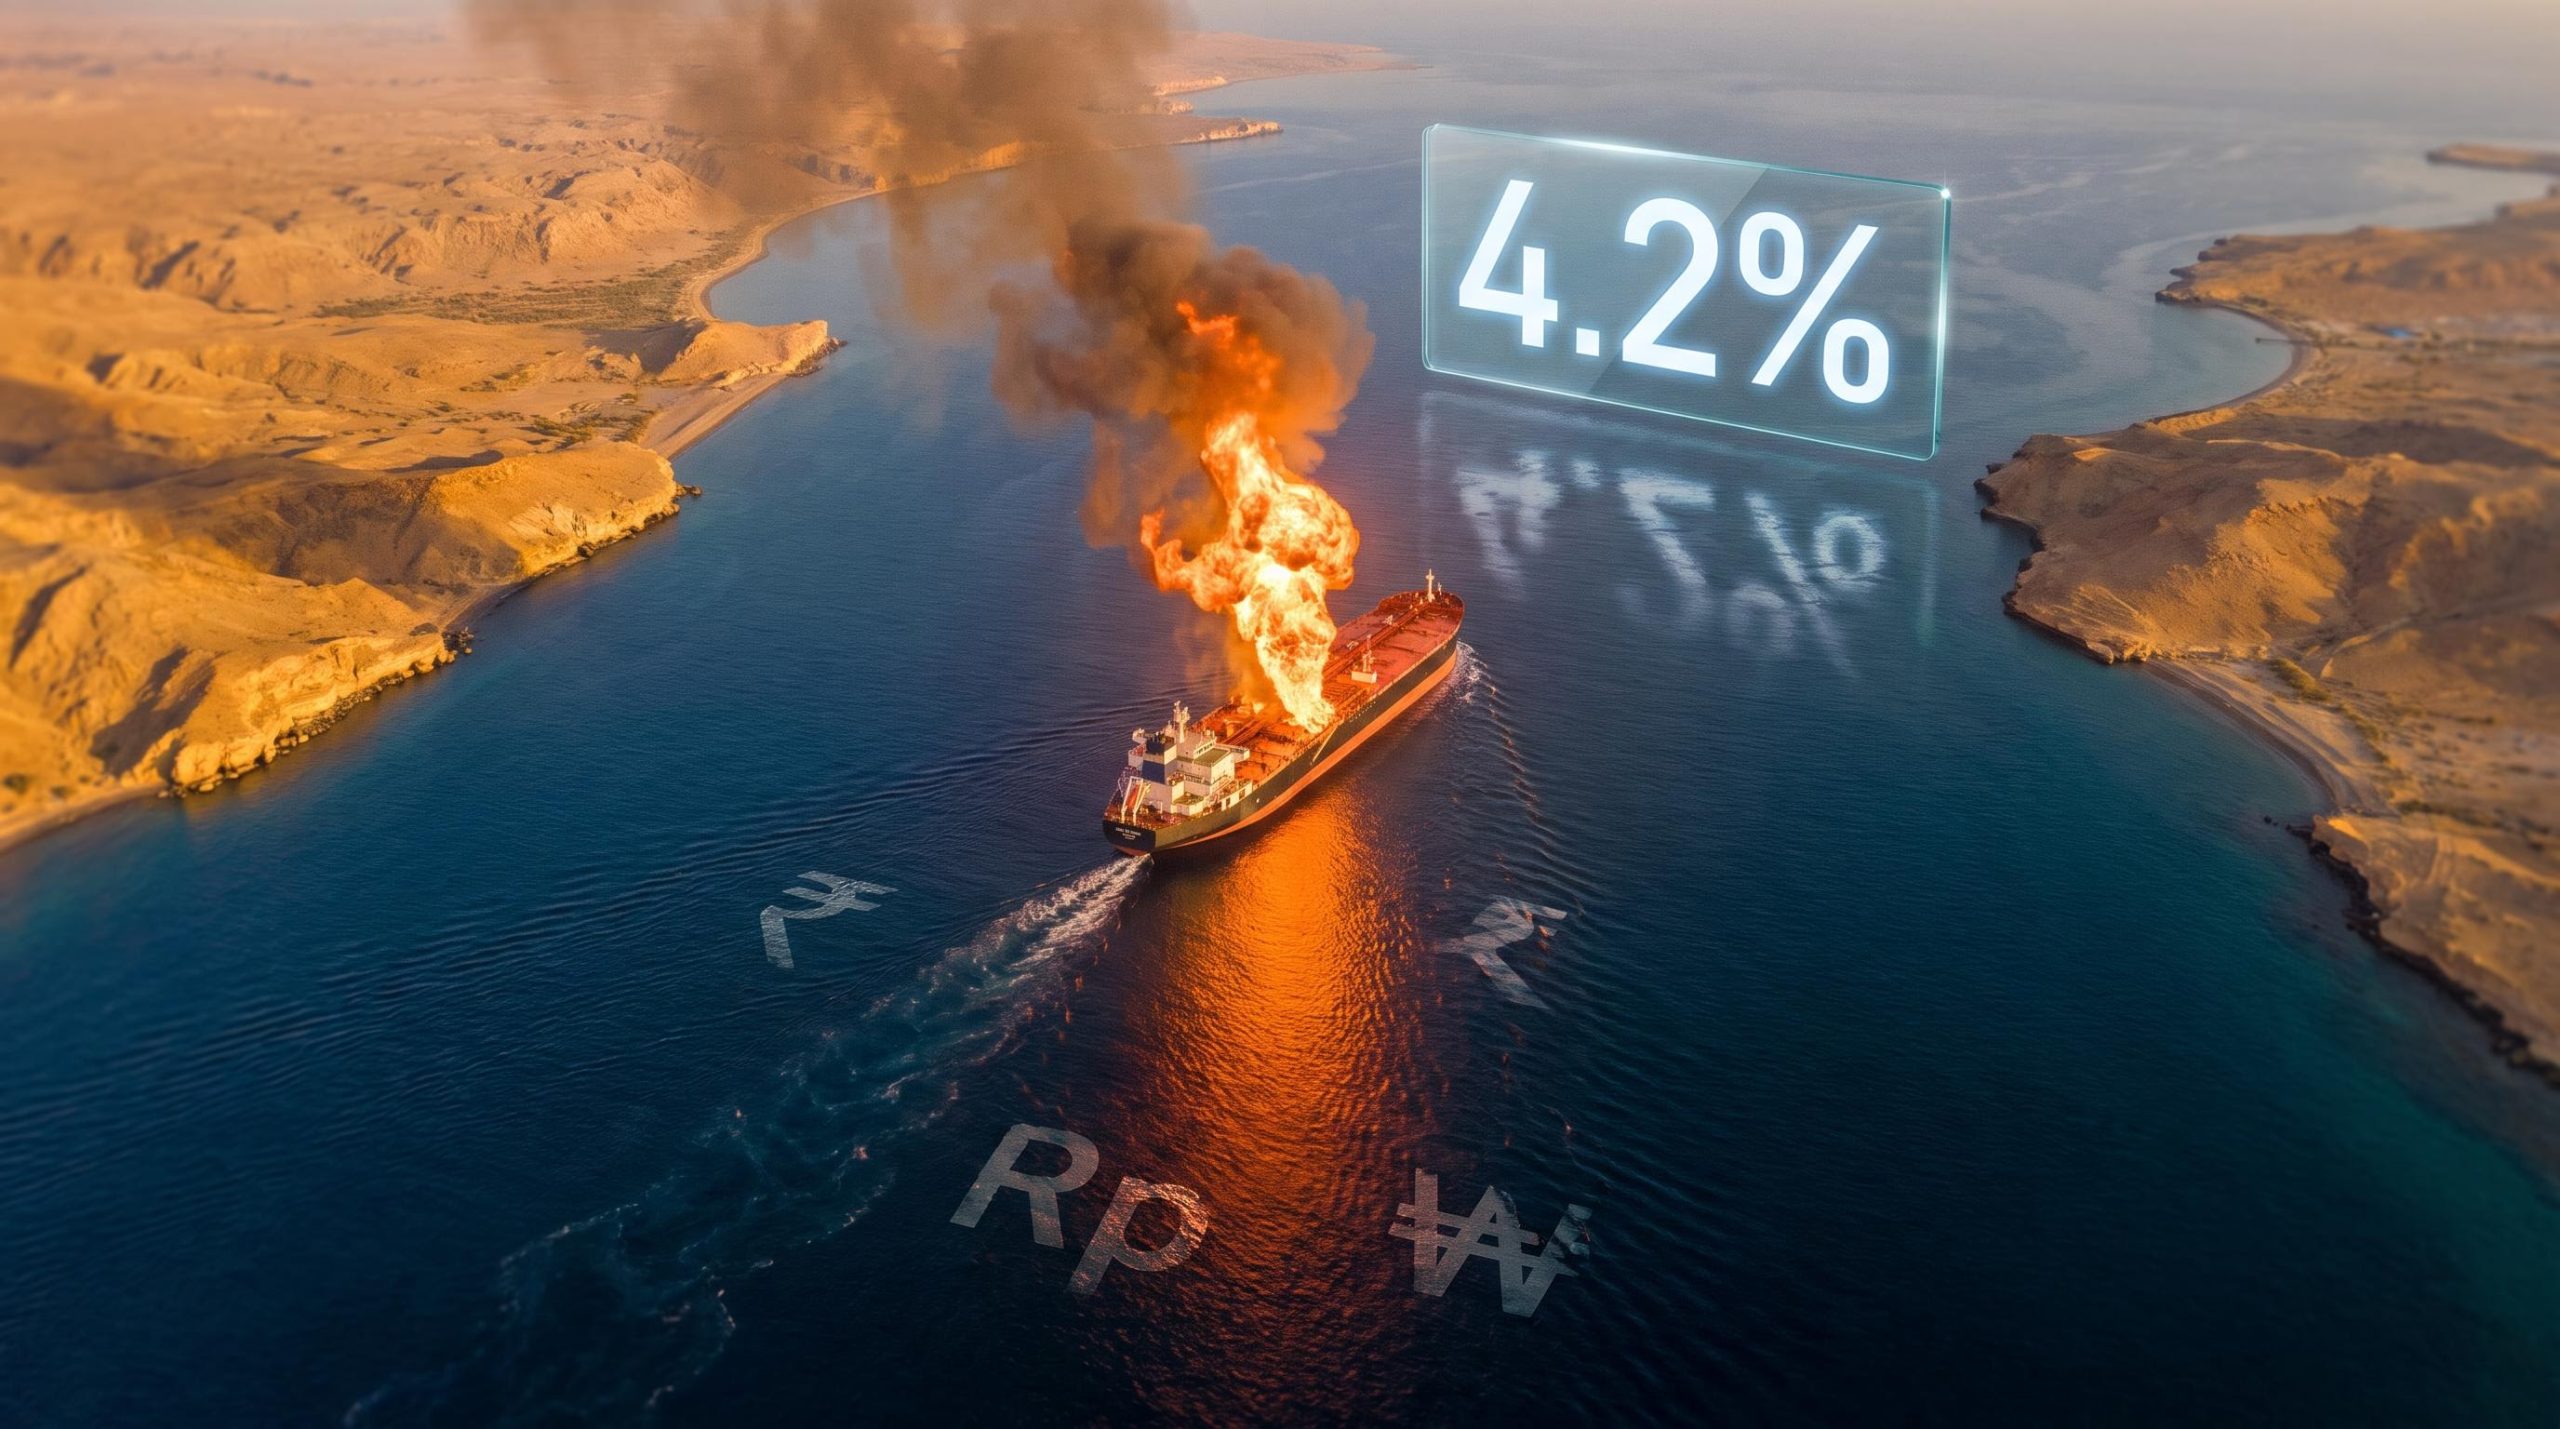
Two things happened almost at once, and together they put the year-to-date rebound in the Asia Dollar Index at risk of being erased. The Federal Reserve’s hawkish repricing has pushed markets to expect a policy rate near 4.2% by year-end, and on 17 September 2026, Iran’s Islamic Revolutionary Guard Corps struck and detained an oil tanker in the Strait of Hormuz. Two unrelated events, one very connected consequence for the region.
For anyone tracking Asian currencies, portfolio flows, or broader emerging market exposure, this is a convergence of the two most reliable drivers of currency weakness: rising U.S. rate expectations that pull capital toward dollar assets, and geopolitical risk that triggers risk-off selling. What makes this episode worth reading carefully is that it is not a simple replay of 2013 or 2022. Structural buffers have improved, country-level vulnerabilities remain uneven, and a third factor, the fading support from the U.S. Treasury buyback programme, has quietly shifted the balance.
This piece unpacks each force in turn, explains the mechanics that move capital out of Asian currencies, and gives you a framework for judging which countries face the sharpest pressure and under what conditions the current episode deepens or stabilises.
What just happened in the Strait of Hormuz, and why FX traders are paying attention
On the night of 17 September 2026, a Togo-flagged oil tanker called the Trend caught fire and came to a halt in the Strait of Hormuz. Iran’s Islamic Revolutionary Guard Corps (IRGC), through its official outlet Sepah News, said it had struck and detained the vessel after what it described as an “illegal” attempt to transit the waterway, claiming the ship had been provoked by the U.S. military.
The location is what turns a single burning tanker into a currency story. The Strait of Hormuz is the passage for roughly one-fifth of global oil trade, and it has no meaningful bypass.
The IRGC warned that any “illegal passage” through the Strait will lead to “destruction,” stating that its forces maintain full control of the waterway and will not permit passage by any “aggressor.”
That rhetoric raised the stakes further. On the same day, U.S. President Donald Trump indicated, as reported by Axios, that a significant decision on potential large-scale military action against Iran was being weighed. Traders had to start pricing an uncertainty premium that stretched from a contained incident all the way to open confrontation.
The market reaction showed up first in the assets that respond fastest to fear. Gold recovered from a six-week low to above $4,350 on 18 September 2026, with Hormuz-related risk attention feeding the move.
The reason FX desks care is not the tanker itself. It is what a sustained disruption to the world’s most critical energy chokepoint would do: an oil price shock feeds directly into wider current account deficits and risk-off capital flight from Asia’s most oil-dependent economies. The Hormuz incident opens three distinct risk channels:
- An energy price shock that raises import bills for oil-dependent Asian economies
- A broad risk-off shift in sentiment that pulls capital toward the dollar
- Escalation uncertainty over potential U.S. military action against Iran
Each channel can move currencies on its own. Arriving together, they set the backdrop against which the Fed story now plays out.
Hormuz shipping throughput collapsed to just 3-14 vessels per day against a pre-disruption baseline of 120-140, and war-risk insurance premiums running at approximately 30 times normal rates mean that a diplomatic declaration of safe passage cannot by itself restore commercial oil flows or the FX pressure that accompanies an energy price shock.
When big ASX news breaks, our subscribers know first
How the Fed’s hawkish pivot is repricing the floor under Asian currencies
The clearest way to see the pressure building is to read the rate path the way the market is pricing it, not the way it stands today. The current level is only the starting point.
The Federal Reserve’s official H.15 release put the effective federal funds rate at 3.63% for the week of 9-15 September 2026. That is the anchor. What matters for currencies is where the futures market thinks it is going.
| Date / Source | Implied Rate | Instrument |
|---|---|---|
| 14 September 2026 (MarketWatch) | ~3.73% | September Fed funds futures |
| 16 September 2026 (Barchart) | ~3.90% | October Fed funds futures (ZQV26, 96.1050) |
| 17 September 2026 (iShares) | ~4.2% by year-end | Fed funds futures, forward path |
Read down that column and the tightening path emerges as a progression rather than a single guess. The iShares fixed-income outlook of 17 September 2026 priced the policy rate around 4.2% by year-end, while describing the forward path as “less certain” and consistent with at least one further 25-50 basis point hike.
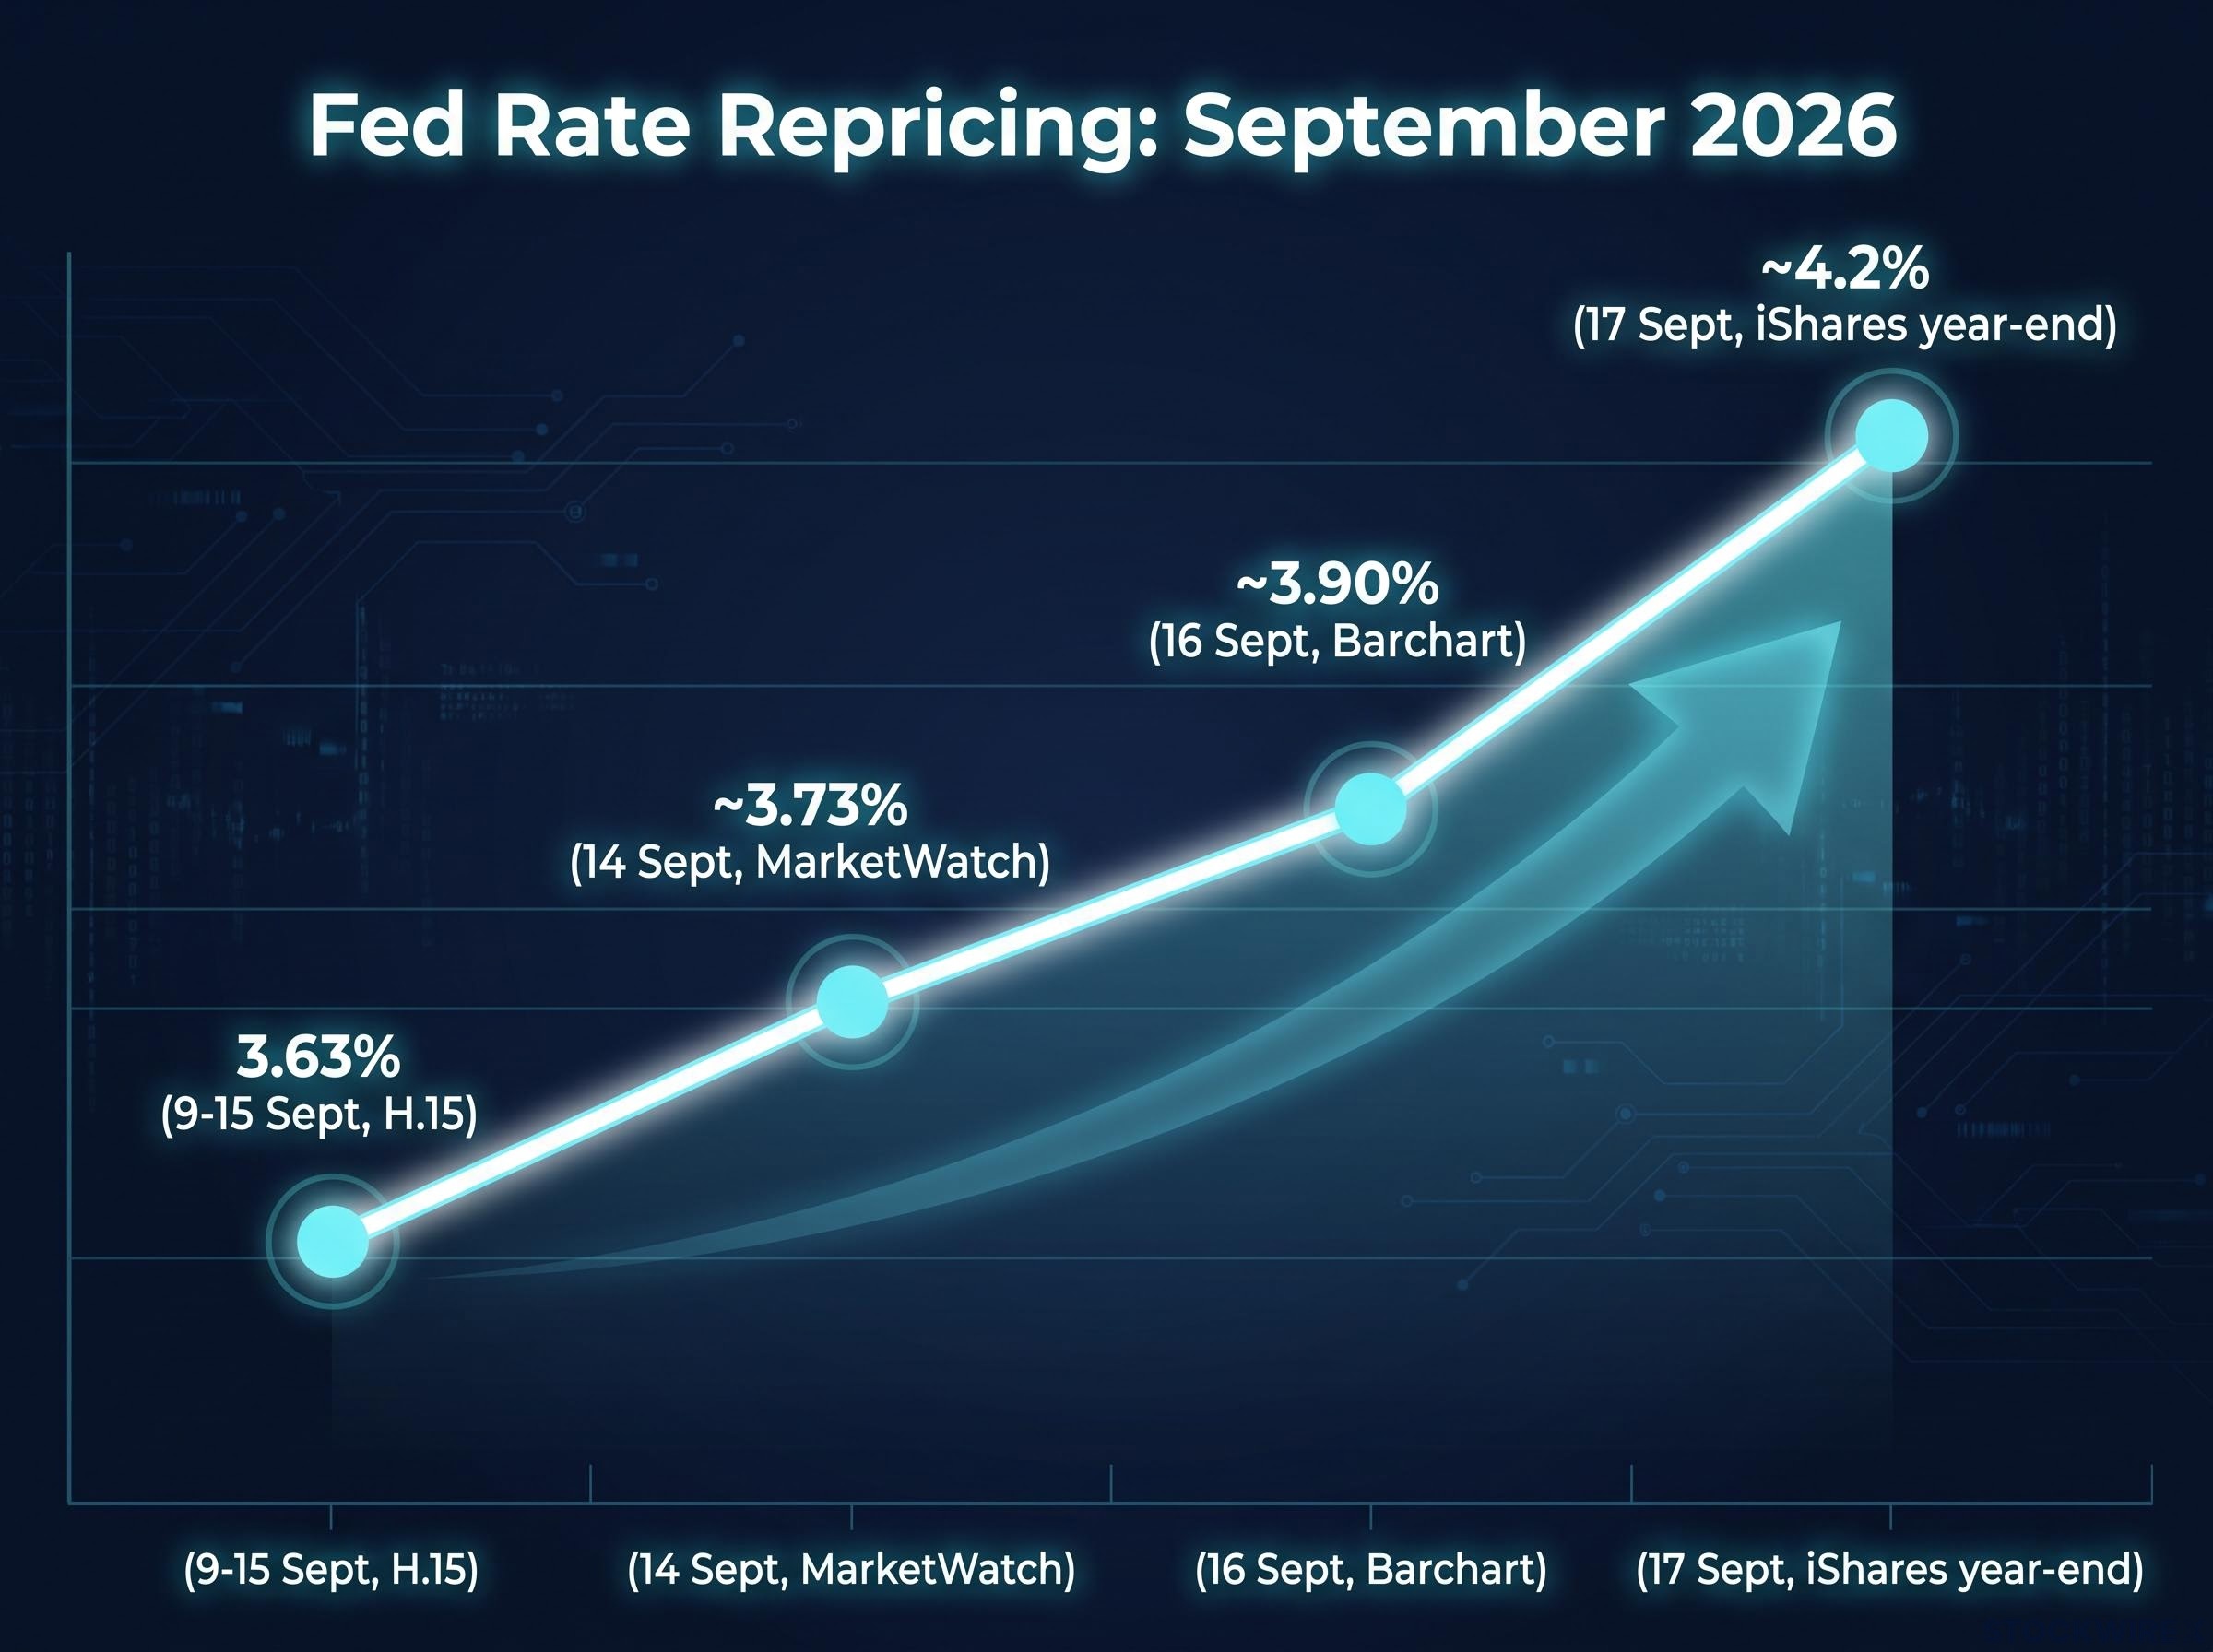
Here is why that gap matters mechanically. A higher, more prolonged Fed rate path widens the yield differential between U.S. Treasuries and Asian local-currency assets, and that differential is what decides whether foreign capital stays in the region or rotates home.
The distinction between Fed policy repricing and term-premium expansion matters here because BIS research quantifies each channel differently: a 1 percentage point term-premium expansion in US yields produces roughly a 0.6 percentage point rise in Asian long-term bond yields within three months, a transmission speed that outpaces most portfolio hedging cycles.
UOB Group strategists, as of 18 September 2026, cautioned that the year-to-date rebound in the Asia Dollar Index is at risk from the Fed’s hawkish pivot, identifying further rate increases as a potential catalyst for portfolio capital to exit the Asia region.
That warning is the rate story translated into the currency story. A move from 3.63% toward a market-implied 4.2% is not a rounding adjustment. For an investor holding Indonesian local bonds or Indian equities, it is a real increase in the opportunity cost of staying in Asian assets rather than rotating into U.S. Treasuries.
The practical takeaway is to watch the implied path, not just the headline rate. When that path moves sharply higher, it often signals Asian FX pressure weeks before it shows up in currency data.
The mechanics of capital flight: how Fed tightening pulls money out of Asia
Understanding why capital leaves is less about any single lever and more about a sequence of channels that build on one another. IMF, BIS, and major sell-side research describe four, and they run in a logical order:
- Yield differentials. Higher U.S. rates make Treasuries and high-grade dollar credit more attractive relative to Asian local-currency bonds. Foreign portfolio investors sell and repatriate into dollars, and economies with large foreign holdings of local bonds, such as Indonesia, Malaysia, and India, feel it first.
- Carry trade unwinding. A carry trade borrows in a low-yield currency to buy a higher-yielding one. As the Fed turns hawkish, that yield gap shrinks and volatility rises, prompting leveraged investors to close positions in high-yield Asian currencies, often amplified by stop-loss cascades.
- Global risk-off funding costs. Tighter U.S. policy raises dollar funding costs for banks and corporates borrowing offshore, draining liquidity from local bond markets as investors demand higher yields or move to cash.
- FX mismatch stress. A stronger dollar increases the local-currency value of unhedged dollar debts, concentrating pressure on corporates in property and infrastructure and on banks with mismatched FX balance sheets.
The last channel is the one most readers underestimate, and it is the slowest to appear. It is also the most damaging, because it turns a currency move into a solvency question for leveraged borrowers.
If you hold exposure to Indonesian rupiah bonds or Indian equities, none of this is theoretical. These are the same mechanics that drove double-digit currency moves during the 2013 taper tantrum and the 2018 emerging-market sell-off, and the same vulnerabilities remain structurally present today.
Knowing which channel dominates tells you what to watch. If it is yield differentials, the signal sits in U.S. Treasury moves. If it is carry unwind, watch volatility and positioning data. If it is balance-sheet stress, watch corporate credit spreads in the most leveraged sectors.
Which Asian economies face the sharpest pressure
The channels do not hit every currency equally. Based on portfolio-flow sensitivity and carry exposure, strategists tend to flag the same names as relatively more vulnerable:
- Most exposed: India, Indonesia, the Philippines, and Korea, given large foreign portfolio holdings and high-yield currencies attractive to carry trades. The Indonesian rupiah, Indian rupee, and Philippine peso are the classic carry-unwind casualties.
- Structurally insulated: China, where capital controls limit hot-money outflows, though it remains exposed through trade flows and confidence effects.
The global shock is only half the story. Idiosyncratic factors, fiscal position, political risk, and the current account balance, determine whether an individual currency sees a shallow wobble or a deep drawdown.
Why the Treasury buyback tailwind has faded, and what replaced it
If you were positioned for Asian FX strength earlier this year, part of the thesis probably rested on the U.S. Treasury buyback programme. That was a reasonable read in August 2026, and it is worth understanding why it stopped working.
The buyback programme sees the Treasury repurchase older, less-traded bonds. When it was first discussed, some commentators argued it would compress long-end yields, weaken the dollar, and revive a “USD debasement” narrative that supported emerging-market currencies. In August 2026, that argument gave Asian FX an unexpected tailwind.
The narrative faded for three reasons:
- Scale versus expectations. The actual size and pace of buybacks were modest relative to overall Treasury supply, so the market concluded they were technical liquidity management, not a shift in fiscal stance.
- Debt management versus macro policy. Buybacks smooth the Treasury’s maturity profile but are financed by issuing other securities, leaving net supply broadly unchanged. Dealer analysis from JPMorgan and Barclays reinforced this reading.
- Competing interpretations losing traction. A minority camp of macro funds and gold-focused commentators still treats buybacks as a long-term debasement signal, but that view is not the consensus in current commentary.
UOB Group judged, as of 18 September 2026, that the buyback programme’s market influence is now secondary to the Fed’s tightening posture.
For readers who traded the August tailwind, the lesson is not just retrospective. It clarifies what evidence would be needed to revive the thesis, namely a genuine shift in net Treasury supply or a return to QE-style support, and why today’s environment is structurally different.
It is also a useful case study in how fast a macro narrative moves from tailwind to irrelevant. Checking a programme’s mechanics against its actual scale is more reliable than trading the initial headline.
Structural buffers across Asia: why this episode may be painful but contained
The case for containment is real, but it is conditional. Three structural buffers argue for pressure that is persistent rather than acute, and each depends on variables that are not yet settled.
The first buffer is reserve depth and intervention capacity. Central banks in China, India, Korea, Indonesia, and Singapore hold large FX reserves and macroprudential tools, letting them lean against disorderly moves.
Asian FX reserve buffers are a genuine mitigant but not a ceiling on pressure: cumulative equity outflows from the region reached $134 billion through mid-June 2026, more than triple the total for all of 2025, confirming that the scale and speed of capital exit can strain even the deepest reserve cushions.
The second is current account strength. Korea, Taiwan, and parts of ASEAN run surpluses that provide a natural flow of foreign-currency income, offsetting portfolio outflows.
The third is policy credibility, which has improved across most of the region since the 2013 taper tantrum, when weaker frameworks amplified the damage.
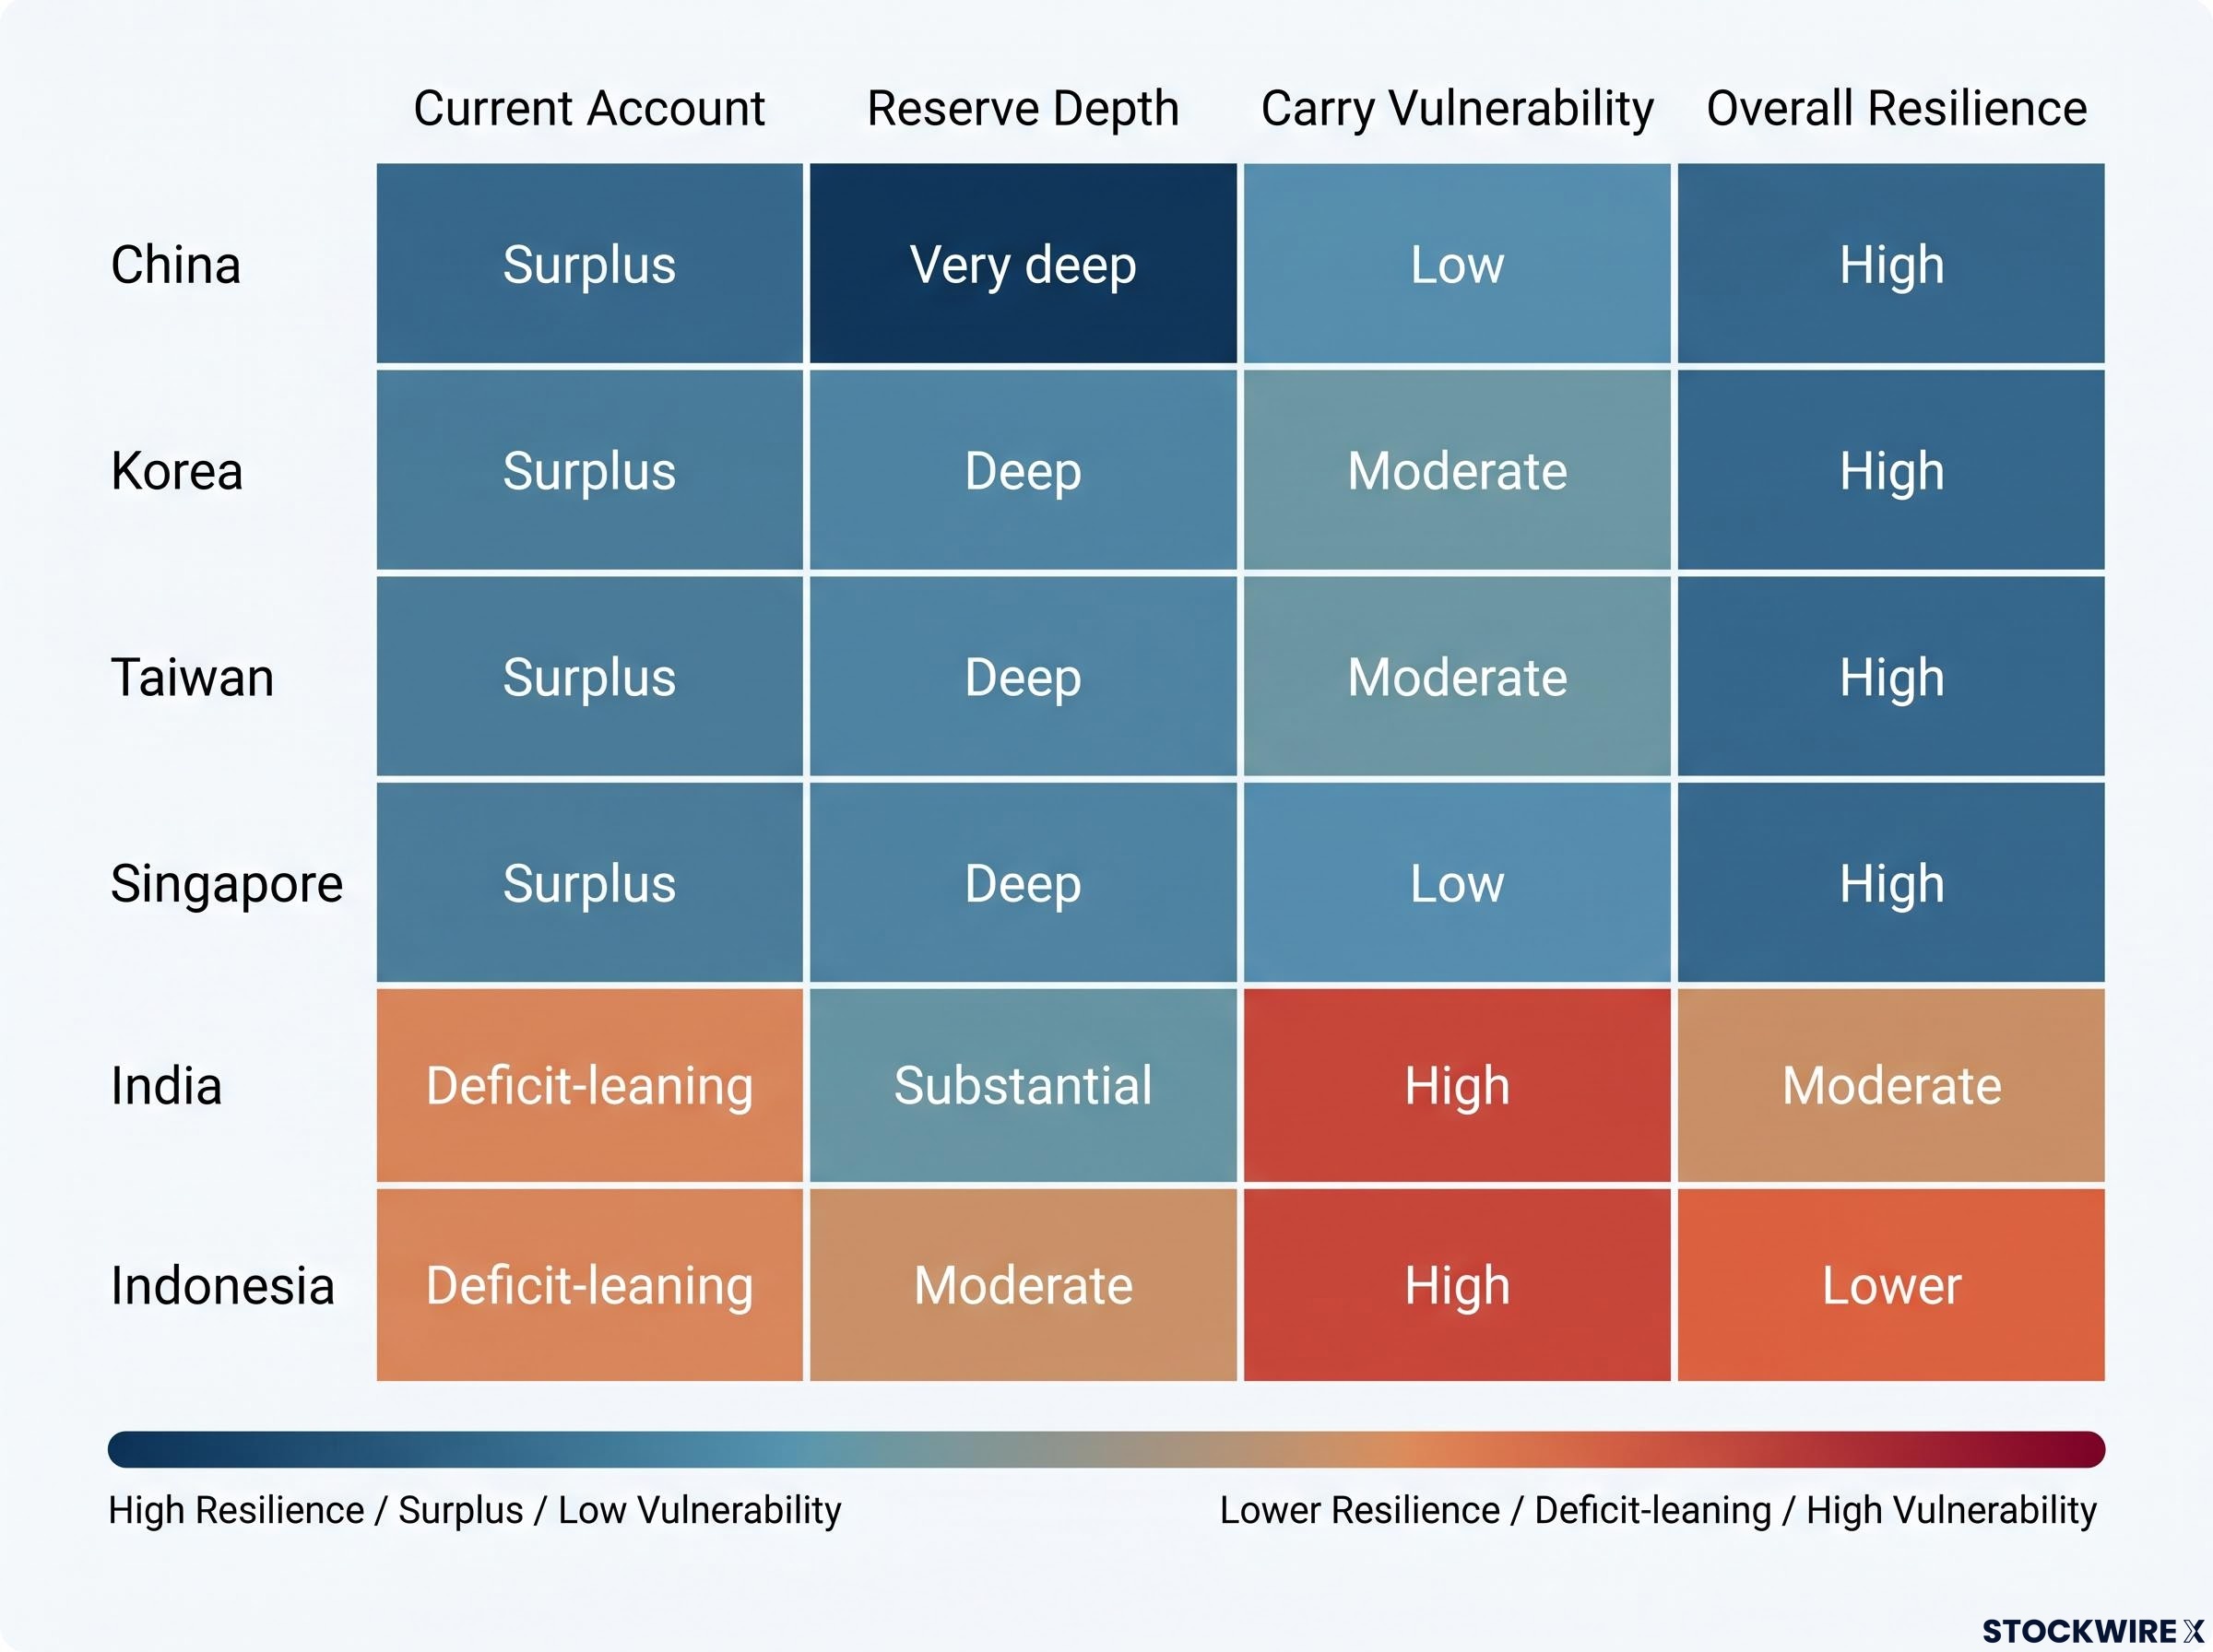
| Economy | Current Account | Reserve Depth | Carry Vulnerability | Overall Resilience |
|---|---|---|---|---|
| China | Surplus | Very deep | Low (capital controls) | High |
| Korea | Surplus | Deep | Moderate | High |
| Taiwan | Surplus | Deep | Moderate | High |
| Singapore | Surplus | Deep | Low | High |
| India | Deficit-leaning | Substantial | High | Moderate |
| Indonesia | Deficit-leaning | Moderate | High | Lower |
The 2022 dollar surge is the most instructive recent precedent. Currencies with strong external balances, notably the Singapore dollar and Korean won, stabilised faster than deficit currencies once a credible Fed peak came into view. Three risks could still break the containment case, roughly in order of severity:
- Sustained Hormuz disruption that triggers an oil price shock and broad risk-off, hitting oil-importing economies hardest.
- A sharp rate repricing beyond ~4.2% for year-end, which would widen yield differentials further and accelerate outflows.
- Idiosyncratic country deterioration, where fiscal slippage or political risk turns a global shock into a local crisis.
The buffer argument is credible for surplus economies with large reserves. It does not apply uniformly. If you are tracking currencies in economies that combine fiscal slippage, a current account deficit, and political uncertainty, the mitigants are weakest exactly where the global pressure lands hardest. De-dollarisation efforts, such as CNY invoicing and regional swap lines, are incremental and slow, and the dollar still dominates reserves, trade finance, and global debt.
What shifts the balance from pressure to recovery, and what to watch now
Rather than predict a level, it helps to know the signals that historically mark the turn from pressure to recovery. Three matter most: a credible Fed terminal rate emerging in futures pricing, U.S. real yields stabilising, and Middle East escalation risk being contained.
The 2022 episode is the clearest guide. Once markets became confident about the Fed’s peak rate and U.S. inflation began to fall, emerging-market currencies recovered even from a position of real weakness, and the same dynamic is likely to apply this cycle.
In 2022, Asian currencies weakened materially before recovering once markets priced a peak in the Fed cycle and U.S. real yields stabilised, with strong-balance-sheet currencies leading the rebound.
The Strait of Hormuz remains the wildcard. A de-escalation path, meaning diplomatic resolution and no further incidents, removes one of the two pressures. Sustained escalation into an oil price shock compounds both channels at once and prolongs the strain.
For reference points, the DXY Dollar Index sat at 100.237 on 17 September 2026, and gold above $4,350 on 18 September 2026 is functioning as a real-time gauge of the uncertainty premium.
The recovery signal is not a specific FX level. It is a shift in the futures-implied Fed path. When markets stop pricing hikes and start pricing cuts, capital tends to flow back into emerging-market assets quickly, and a view on Fed timing lets you see that inflection before it reaches currency headlines. A structured watchlist keeps the story manageable:
For investors exploring which instruments benefit most when Fed tightening eventually peaks and dollar pressure eases, our full explainer on EM local-currency bonds covers the three compounding advantages these instruments carry over EM equities as a recovery expression, including carry yield, FX appreciation, and portfolio diversification mechanics.
- The Fed futures implied path and any move beyond the ~4.2% year-end expectation
- U.S. real yields and whether they are stabilising or still climbing
- Strait of Hormuz shipping status and any further escalation indicators
- Current account trajectories for the most exposed economies, particularly India, Indonesia, and the Philippines
This article is for informational purposes only and should not be considered financial advice. Investors should conduct their own research and consult with financial professionals before making investment decisions.
Past performance does not guarantee future results. Financial projections are subject to market conditions and various risk factors, and forward-looking statements are speculative and subject to change based on market developments.