Goodman Group’s 18% Pullback: Decoding the Metrics That Matter
6 mins ago

Bill Ackman sold a billion-dollar Google position in Q1 2026 and redirected the capital into Microsoft, citing long-term value at a moment when MSFT was trading near its lowest forward price-to-earnings multiple of the prior decade, roughly 21 to 22 times earnings. That entry point has since shifted. Microsoft now trades around $420 to $424, Azure has re-accelerated to 40% growth in FY26, and quarterly AI capital expenditure has surged from $14.8 billion to $37.5 billion in under 18 months. The investment case has evolved materially since Ackman made his move, and so has the risk profile. What follows is a dissection of both sides of the Microsoft stock analysis: what the bull case is built on, where the genuine vulnerabilities sit, how the valuation framework holds at today’s prices, and what a finance-educated investor should conclude about MSFT as a portfolio position heading into the second half of 2026.
Ackman’s rotation was specific. He exited Google to establish a comparable-sized Microsoft stake, and his stated rationale centred not on a business thesis change but on a valuation dislocation. At the time of purchase, MSFT had fallen between 12% and nearly 30% year-to-date. The forward P/E had compressed to approximately 21 to 22x, close to the lowest multiple of the prior ten years.
Ackman described Microsoft as offering long-term value at a price that reflected temporary sentiment damage rather than structural deterioration in the business.
Ackman’s original investment thesis, disclosed via a 13F-HR filing on 15 May 2026, centres on a specific claim the current share price does not yet reflect: that Microsoft’s roughly 27% economic interest in OpenAI represents approximately $200 billion in embedded value that consensus models are treating as zero.
The entry conditions matter because they no longer exist. At $420 to $424 in mid-May 2026, MSFT sits meaningfully above Ackman’s likely cost basis. The valuation dislocation he identified has partially closed.
Not every prominent voice agreed with the trade. Jim Cramer stated his intention to reduce or exit his Microsoft position during the same period, a disagreement that functions less as entertainment and more as a proxy for a genuine split among sophisticated investors: is Microsoft’s risk-reward compelling, or merely acceptable? The rest of this analysis attempts to answer that question at today’s price, not Ackman’s.
Microsoft 365 remains the structural core. With 450 million daily active users generating approximately 70% of company profits, the productivity suite operates behind enterprise-grade compliance and security infrastructure that makes switching costs genuinely high. Organisations do not migrate away from Microsoft 365 because the cost of doing so, measured in retraining, compliance recertification, and workflow disruption, typically exceeds any licensing savings.
Azure is the second major engine, and the most important recent data point is the FY26 acceleration. After growing in the high-20s to low-30s range through FY25, Azure posted 40% growth in Q1 and Q3 FY26, with 39% headline growth in Q2. AI services are a disclosed contributor to that re-acceleration.
| Segment | Key Metric | Revenue Contribution | Moat Characteristic |
|---|---|---|---|
| Microsoft 365 | 450M daily active users | ~70% of profits | Enterprise compliance lock-in |
| Azure | 40% FY26 growth | Fastest-growing segment | AI infrastructure scale |
| Secondary Portfolio | LinkedIn: 1B+ members | Meaningful but not load-bearing | Platform network effects |
The secondary portfolio, LinkedIn at over one billion members, Xbox and Activision, Bing and Edge, contributes meaningfully but does not carry the investment thesis.
Microsoft’s stake in OpenAI, estimated at $100 billion to $200 billion contingent on an eventual IPO, represents genuine optionality. However, at the time of a prior earnings disclosure, roughly 45% of Azure’s reported backlog was attributed to OpenAI, making the relationship a concentration exposure as much as a growth driver. OpenAI has also been reported to be exploring infrastructure relationships with competing cloud providers, raising the question of whether Azure exclusivity is durable over time.
The structural risks inside the Microsoft bull case extend beyond the headline capex and rate sensitivity discussed here: the agentic AI orchestration layer poses a longer-term threat to Microsoft 365’s bundling logic that is not yet visible in seat retention or churn metrics, and the OpenAI concentration within Azure’s backlog creates asymmetric downside if that relationship begins to diversify.
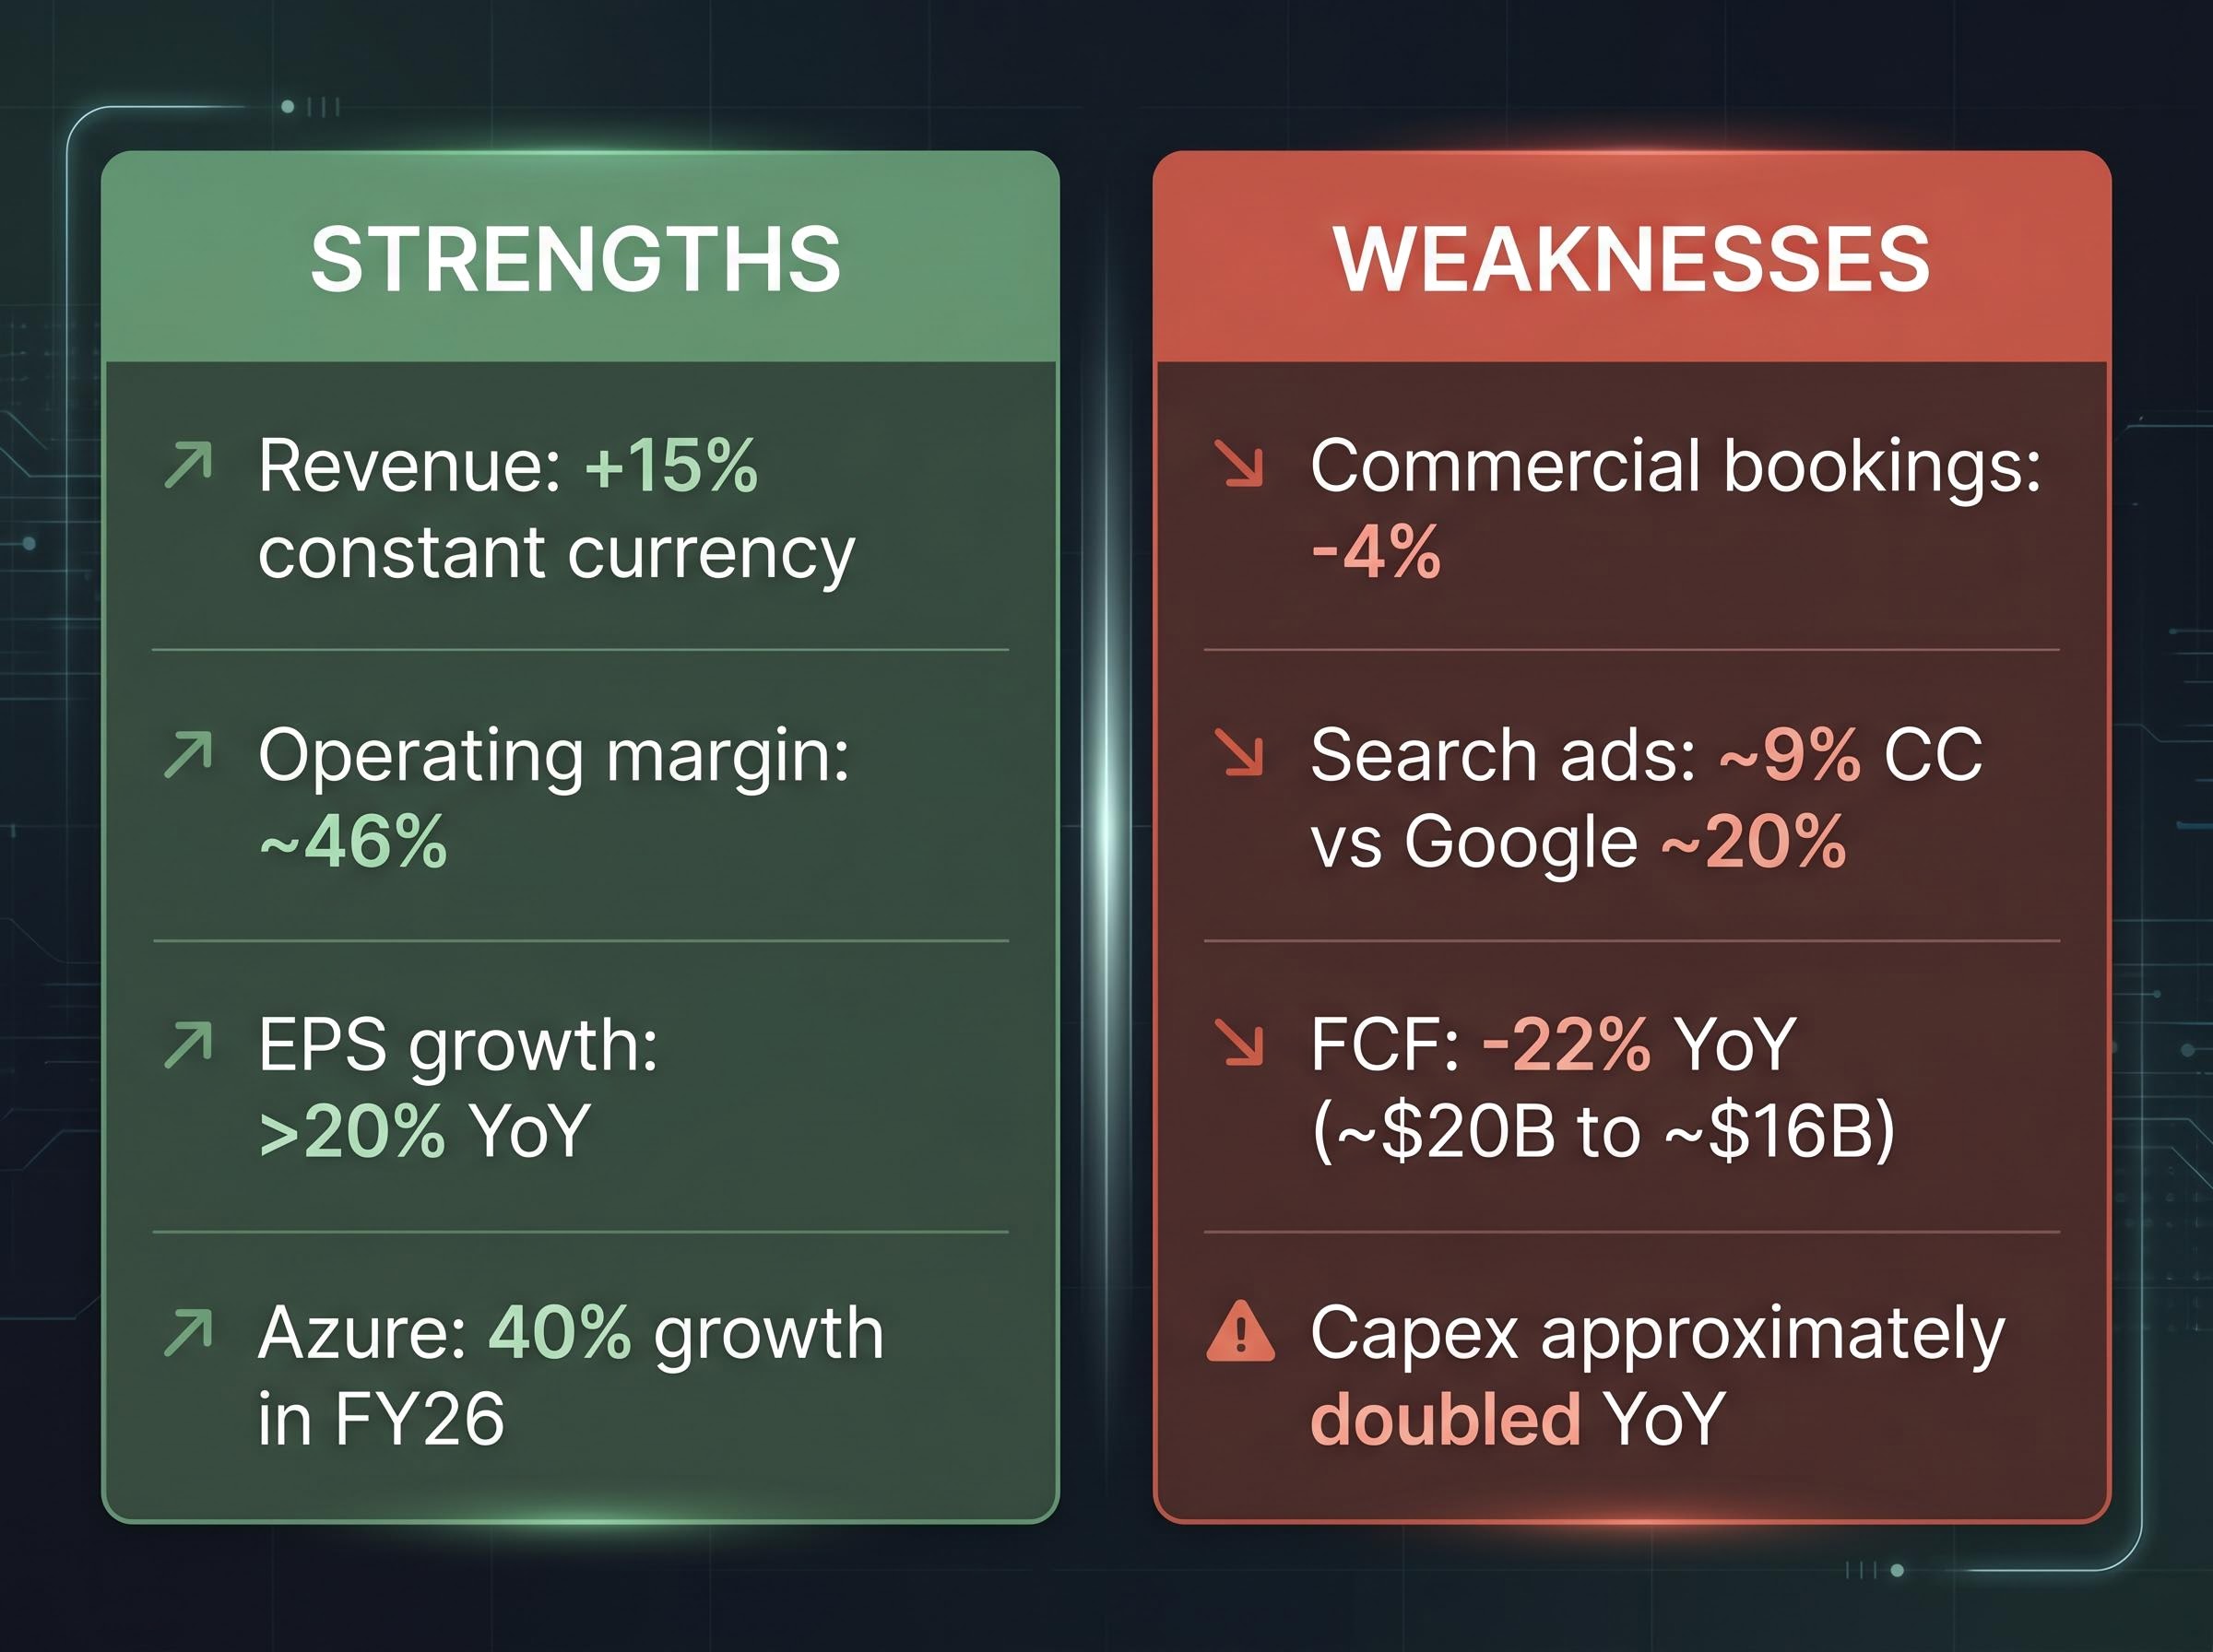
The strong numbers are genuinely strong. Revenue grew 15% on a constant-currency basis and 18% as reported. Operating margins held at approximately 46%. Earnings per share grew by more than 20% year-over-year.
Then the sub-surface figures introduce tension. Commercial bookings declined approximately 4%. Search advertising grew at roughly 9% constant currency, against Google’s approximately 20%. Windows and Xbox revenue contracted.
The commercial bookings decline warrants careful interpretation rather than alarm. Management has attributed part of the softness to the seat-to-token pricing transition for Copilot and to timing irregularity in the OpenAI contract cycle. That explanation is plausible but requires active monitoring in subsequent quarters.
Free cash flow declined approximately 22% year-over-year, from roughly $20 billion to approximately $16 billion, as capital expenditure approximately doubled.
| Strength | Weakness |
|---|---|
| Revenue: +15% constant currency | Commercial bookings: -4% |
| Operating margin: ~46% | Search ads: ~9% CC vs Google ~20% |
| EPS growth: >20% YoY | FCF: -22% YoY (~$20B to ~$16B) |
| Azure: 40% growth in FY26 | Capex approximately doubled YoY |
The divergence between earnings growth and free cash flow generation is the single most important financial dynamic for investors to track. It is capital expenditure, not earnings, that will determine whether AI investment creates or erodes long-term shareholder value.
The spending trajectory makes the scale undeniable:
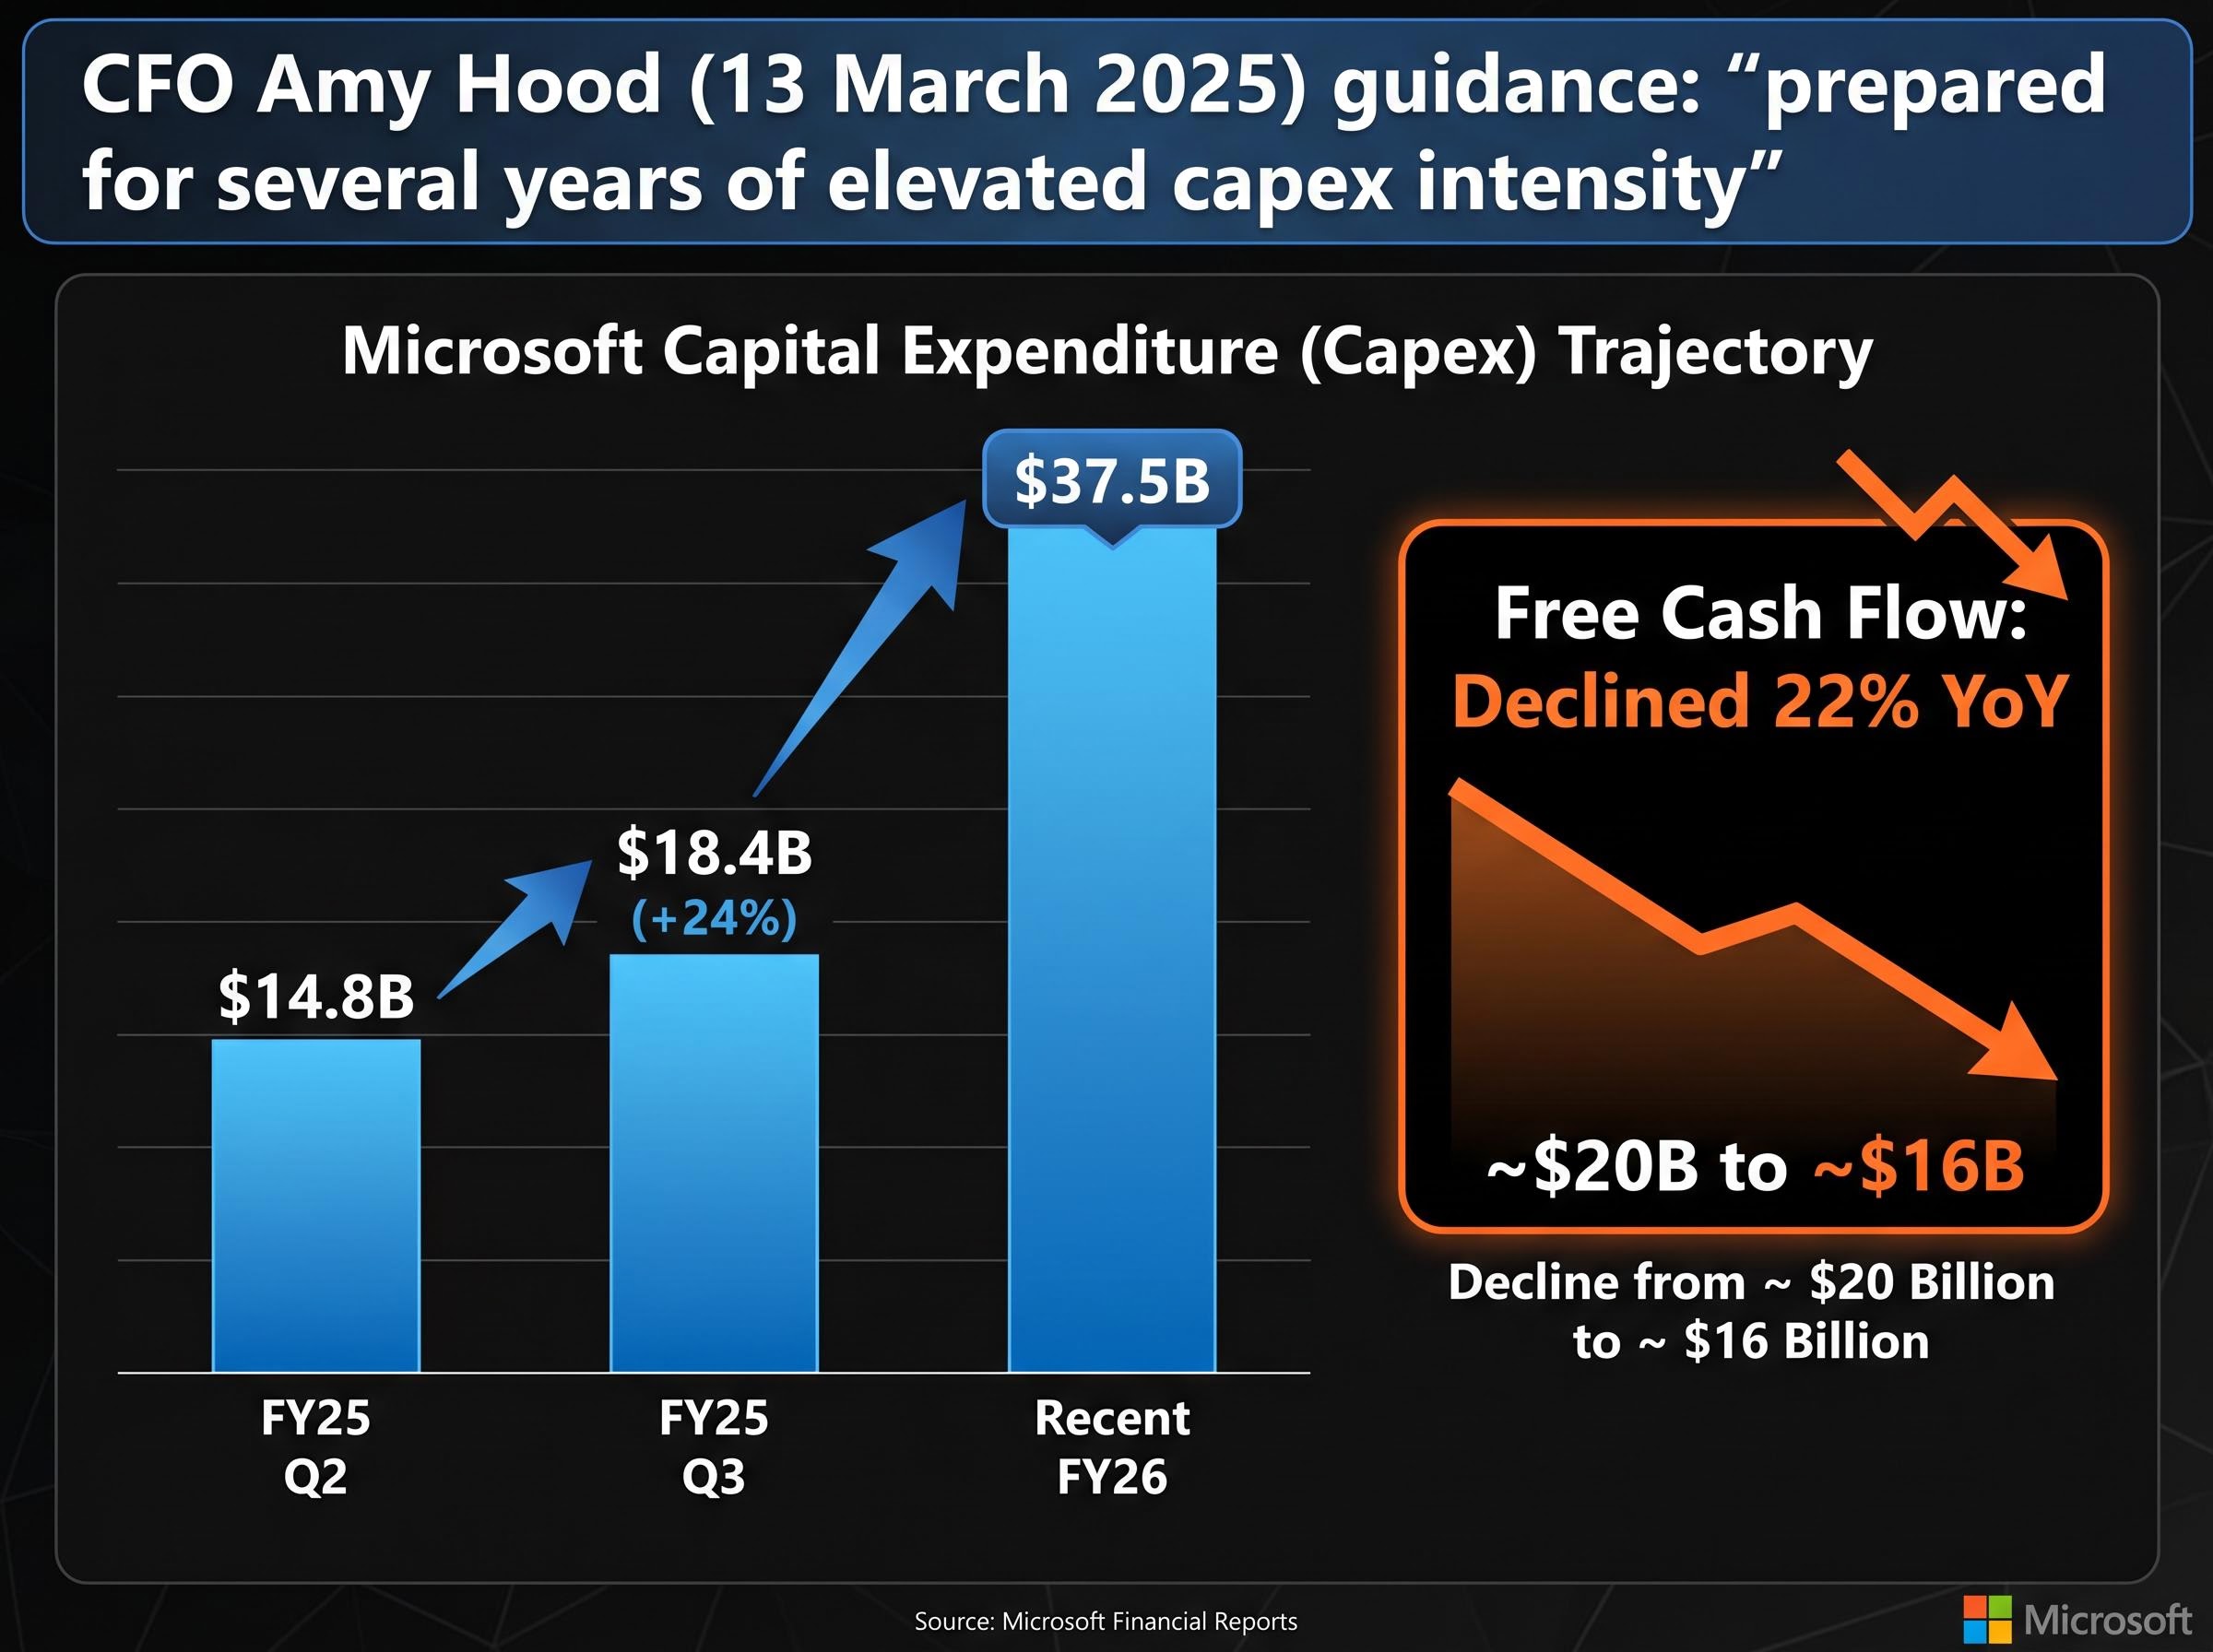
CFO Amy Hood has removed any expectation of near-term normalisation. At Microsoft’s AI and Cloud Investor Briefing on 13 March 2025, she stated the company is “prepared for several years of elevated capex intensity” compared with pre-AI levels.
The hyperscaler capital expenditure trajectory across Amazon, Alphabet, and Meta provides the peer context that Microsoft’s own spending requires: collectively these four companies committed $130 billion in Q1 2026 alone, which reframes Microsoft’s $37.5 billion quarterly figure not as an outlier but as a proportionate response to a sector-wide infrastructure commitment running toward $725 billion for the full year.
The question is not whether the spending is large. It is whether the spending is productive. Two interpretations compete:
Whether the AI capex surge is value-creating or value-dilutive is the central unresolved question in the Microsoft investment case. The answer will likely not be visible in reported financials for 12 to 24 months.
A forward price-to-earnings multiple represents the price an investor pays today for each dollar of earnings the market expects a company to generate over the next 12 months. A forward P/E of 25x means the market is paying $25 for every $1 of expected earnings. The higher the multiple, the more optimistic the implied assumption about future growth.
At $420 to $424, Microsoft’s forward P/E is materially lower than the approximately 30x recorded at year-end 2025 when the stock traded near $405. That compression reflects partly a rising share price but primarily rising earnings estimates. Ackman entered at roughly 21 to 22x, near the decade low. Today’s multiple sits between those two reference points.
The 10-year Treasury yield stood at approximately 4.59% to 4.61% as of mid-May 2026. This is precisely the range that institutional strategists identified as an inflection point for mega-cap tech multiples.
Goldman Sachs’ David Kostin wrote in October 2025 that “mega-cap growth stocks are the most vulnerable cohort if the 10-year stabilises above 4.5%.” Morgan Stanley’s Mike Wilson warned in September 2025 that “any move above 5% could drive a more pronounced de-rating in the group.”
Investors wanting to model the rate risk in full portfolio terms will find our deep-dive into tech concentration and yield sensitivity, which examines the six historical instances since 2023 where elevated RSI readings preceded significant drawdowns, the mechanics of how a yield move toward 5% compounds with record 37.5% S&P 500 tech weighting, and why mega-cap de-rating in this environment produces outsized index-level losses relative to historical norms.
Morgan Stanley’s rate threshold warning, citing a 10-year yield at 4.50% as a noticeable headwind for equity multiples, directly supports the valuation sensitivity framework that makes Microsoft’s current multiple vulnerable to any sustained move toward 5% on the long end of the curve.
The mechanism is straightforward. Higher risk-free rates increase the denominator in a discounted cash flow model, reducing the present value of future earnings. A move from 4.6% to 5% on the 10-year would have a proportionally larger effect on a stock trading at 28 to 30x earnings than one trading at 14 to 15x.
Berkshire Hathaway, sitting on approximately $400 billion in cash, illustrates a different valuation philosophy entirely. Value investors of that calibre tend to wait for extreme dislocations, not merely below-decade-average multiples.
The base case assumes approximately 10% annual earnings growth, implying low-to-mid teens compounding in a bull scenario. That is solid but not exceptional against the backdrop of a $3 trillion market cap and elevated capex drag on free cash flow. The OpenAI optionality ($100 billion to $200 billion in estimated stake value, contingent on IPO) is real but insufficient to alter the return profile materially at this scale.
| Dimension | Bull Assumption | Bear Assumption | Current Evidence | Verdict Weight |
|---|---|---|---|---|
| Azure Growth | Sustains above 35% | Decelerates as base grows | 40% in FY26 | Leans bull |
| Copilot Monetisation | Additive to seat revenue | Eventually cannibalises seats | No erosion observed to date | Neutral, early |
| Rate Environment | 10Y falls below 4.5% | 10Y moves toward 5% | Currently ~4.6% | Leans bear |
| OpenAI Dependency | Exclusivity holds | OpenAI diversifies cloud | No confirmed shift yet | Neutral, monitoring |
Analyst price targets set during 2025 provide directional context: Goldman Sachs at $485, Morgan Stanley at $500, J.P. Morgan at $490, and Bernstein at $510. These were established before the current yield and capex environment fully materialised and should be treated as reference points, not forecasts.
Three conditions would shift the analytical verdict:
The conclusion aligns with the weight of the evidence. Microsoft is a high-quality business at a reasonable but not deeply discounted price. That is consistent with Ackman’s framing at his entry point but does not support characterising the stock as deeply compelling at current levels. Berkshire’s preference for extreme dislocations serves as a useful counterweight.
Microsoft belongs in a diversified large-cap portfolio for investors comfortable with an approximate 10% annual base case return, but the evidence does not support concentrating around it the way Ackman has. The capex trajectory, the rate environment, and the OpenAI concentration risk are the three live variables that will determine whether FY26 and FY27 results vindicate or challenge the current multiple.
The honest assessment: Microsoft is unlikely to face material disruption in the next five years, but that durability is already substantially priced in. The market is paying a premium for certainty, not for surprise upside. Quality business. Fair price. Conditional conviction.
Investors looking to form their own view should track three data points above all others: Azure growth rates, free cash flow recovery relative to the capex build, and the 10-year Treasury yield. Those three inputs will most directly determine whether MSFT’s current multiple is justified or at risk over the next 12 months.
This article is for informational purposes only and should not be considered financial advice. Investors should conduct their own research and consult with financial professionals before making investment decisions. Past performance does not guarantee future results. Financial projections are subject to market conditions and various risk factors.
A forward P/E multiple is the price an investor pays today for each dollar of earnings expected over the next 12 months; for Microsoft, this figure sits between the roughly 21-22x entry point Ackman identified and the approximately 30x recorded at year-end 2025, making it a key gauge of whether the stock is cheap or expensive relative to its own history.
Ackman exited his Google position and redirected the capital into Microsoft because MSFT had fallen 12% to nearly 30% year-to-date, compressing its forward P/E to approximately 21-22x, close to the lowest multiple of the prior decade, which he characterised as temporary sentiment damage rather than structural deterioration.
The three primary risks are the sustained surge in AI capital expenditure (rising from $14.8 billion to $37.5 billion per quarter in under 18 months), the concentration of roughly 45% of Azure's reported backlog with OpenAI and the possibility that OpenAI diversifies to competing cloud providers, and the current 10-year Treasury yield near 4.6%, which institutional strategists have identified as an inflection point for mega-cap tech valuation multiples.
Azure posted 40% growth in Q1 and Q3 of FY26, with 39% headline growth in Q2, re-accelerating from the high-20s to low-30s range recorded through FY25, with AI services identified as a disclosed contributor to that pickup.
The three most critical data points are Azure growth rates, free cash flow recovery relative to the ongoing capital expenditure build (FCF declined approximately 22% year-over-year as capex roughly doubled), and the 10-year Treasury yield, since each directly determines whether MSFT's current valuation multiple is justified or at risk over the next 12 months.