Why BTK Inhibitor Resistance Opens a Door for Off-the-Shelf CAR-T
42 mins ago

Micron just posted gross margins of nearly 85 percent on a quarterly revenue run rate that implies $200 billion annually. That is not a technology company having a good quarter. That is a commodity manufacturer that appears to have changed the terms of its business, and the gap between those two descriptions is exactly what investors need to understand before acting.
Fiscal Q3 2026 results landed with after-hours shares surging 15 percent, driven by revenue of $41.46 billion against $9.30 billion a year earlier and management guidance of $50 billion for the next quarter. The surface-level narrative is straightforward: AI is driving memory demand, and Micron is benefiting. The harder question is whether the structural features now in place (take-or-pay contracts, sold-out HBM capacity, a three-player oligopoly) genuinely change the risk profile for equity holders, or whether this is a historically familiar pattern wearing new clothes.
Here is a framework for separating what the numbers confirm, what management’s forward guidance assumes, and where the genuine uncertainty sits heading into the late 2020s. After reading, you will know which specific metrics to track before making or sizing a position.
The headline figures tell a story of acceleration on every line:
Those numbers are objectively historic for a memory manufacturer. But what produced them matters more than the figures themselves.
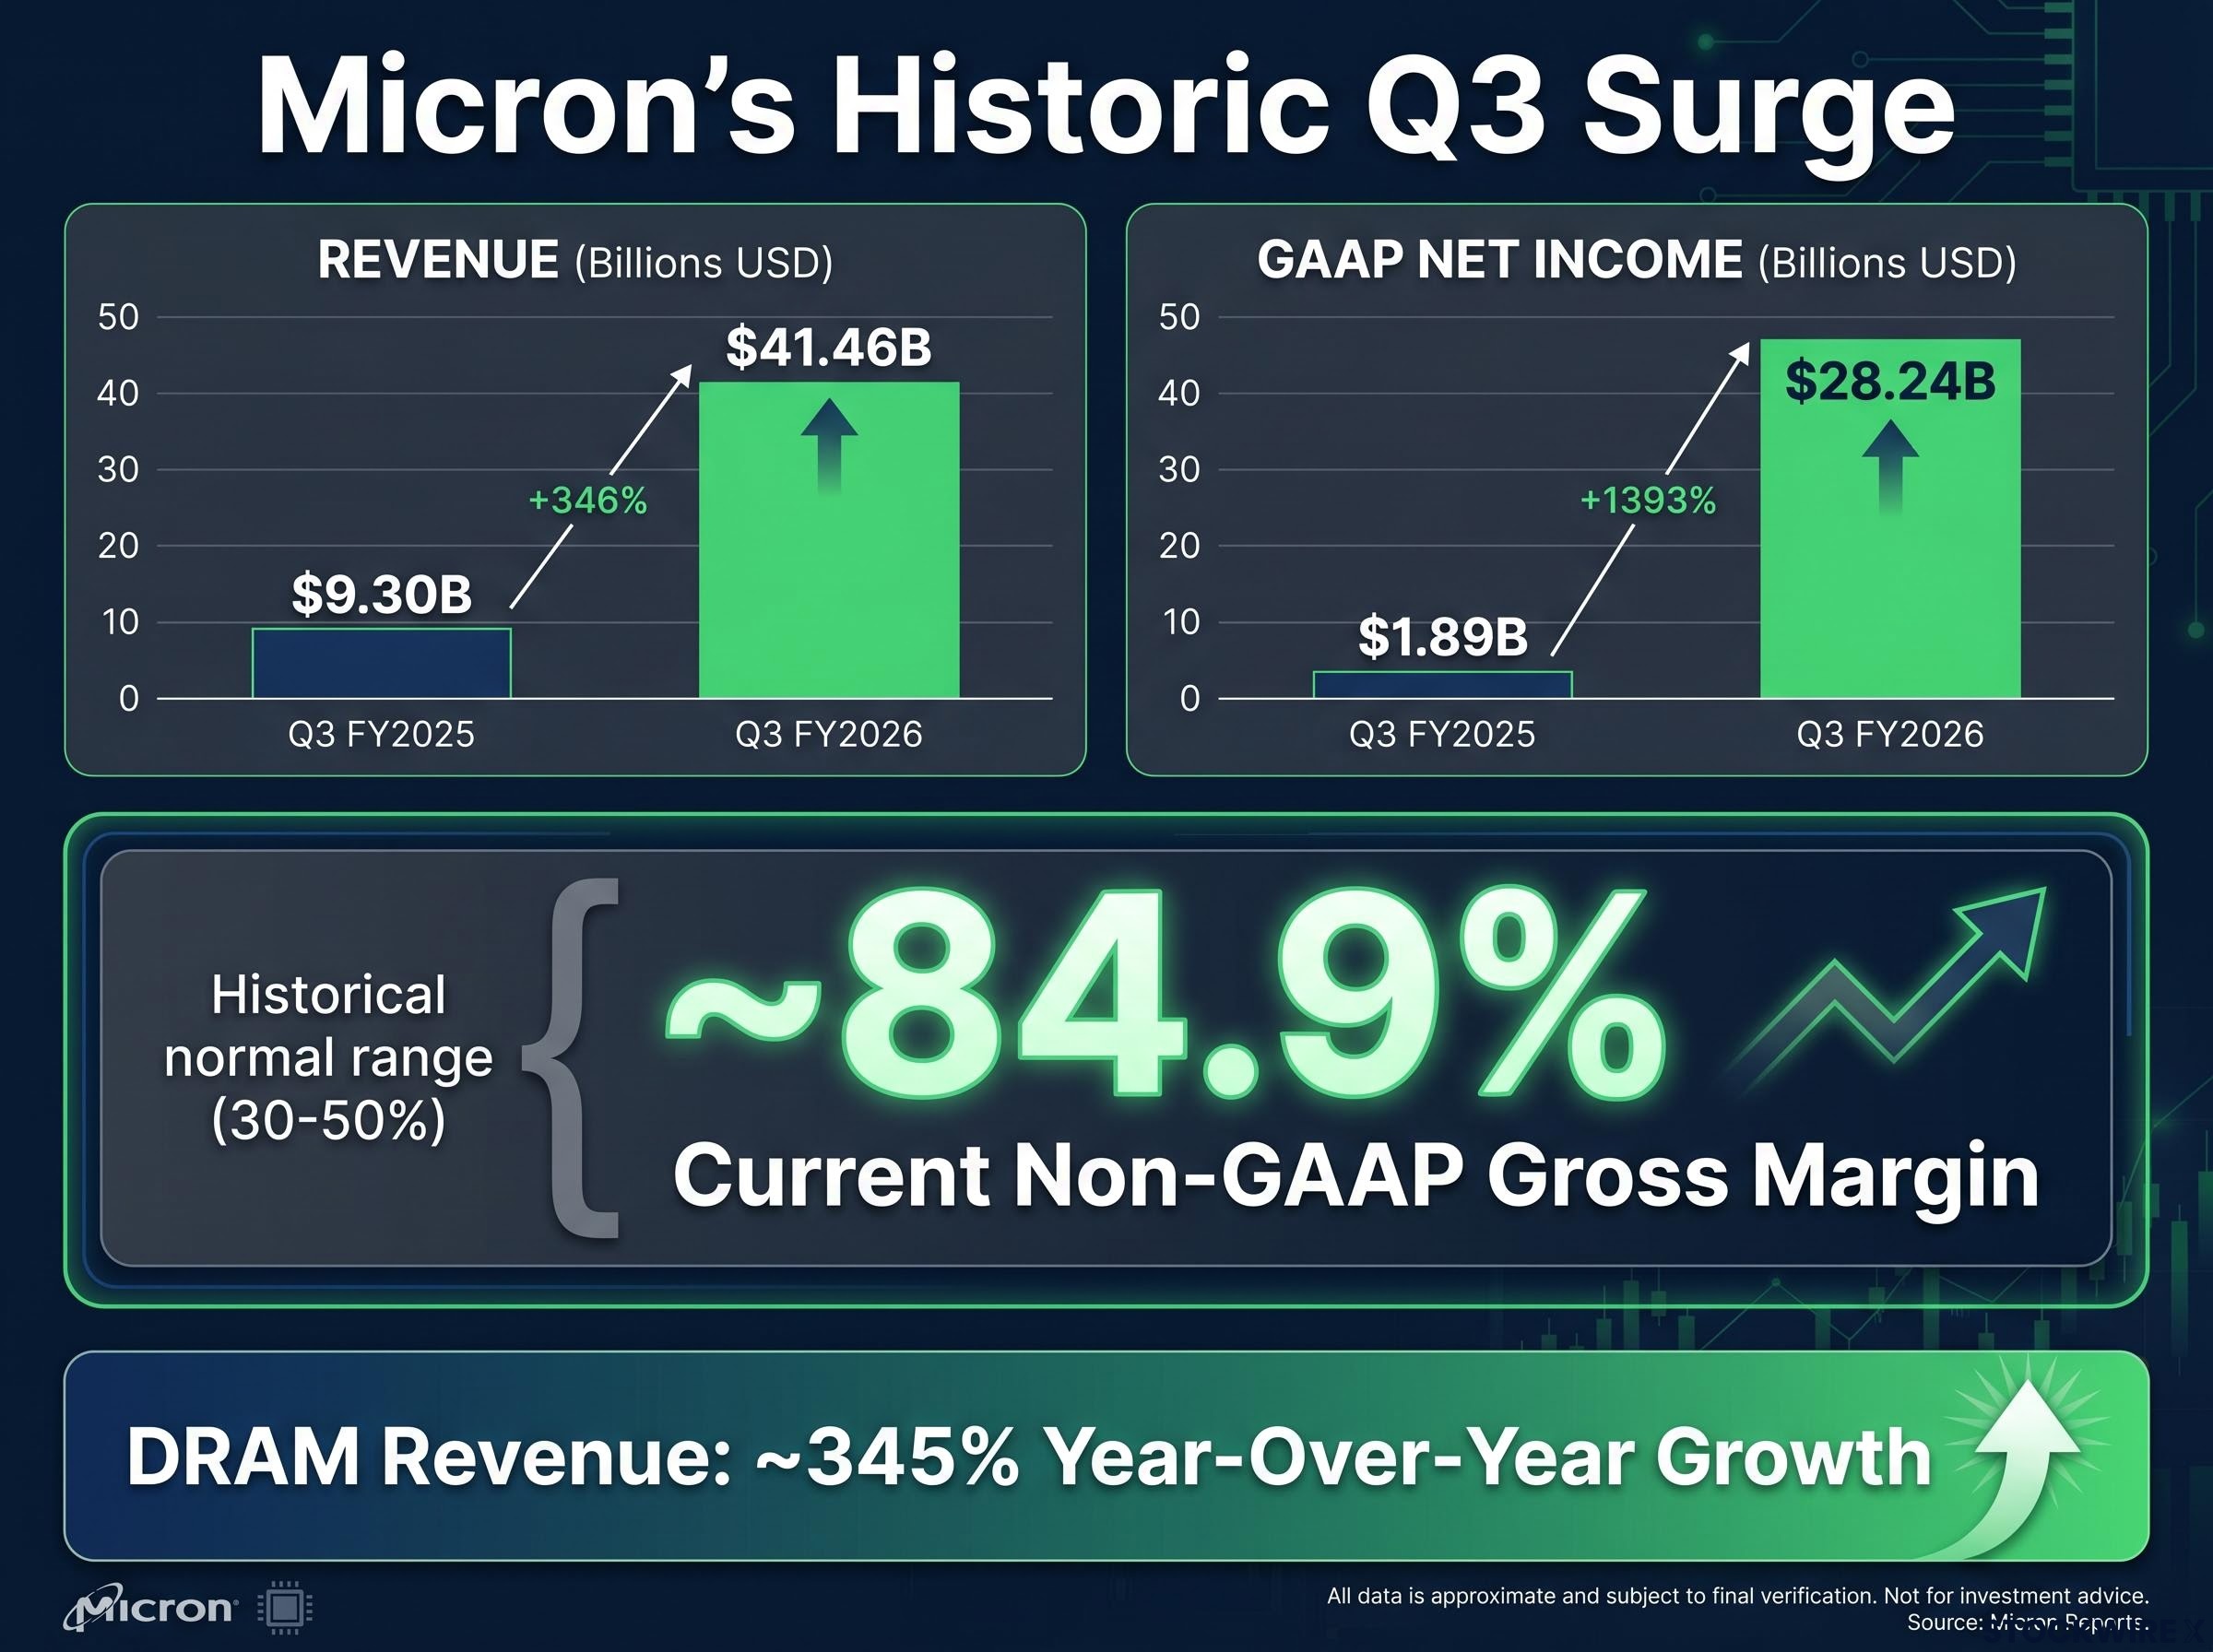
84.9 percent non-GAAP gross margin. For context, memory manufacturers have historically operated with gross margins in the 30-50 percent range during normal cycles. The current level is without precedent.
The sequential revenue gain was overwhelmingly a pricing story rather than a volume story. Bit shipments increased only modestly, in the low single-digit percentage range, while per-unit pricing surged sharply as customers competed for constrained supply.
DRAM accounted for approximately three-quarters of total revenue and delivered year-over-year growth of around 345 percent. The data centre segment was the standout within that, expanding roughly tenfold compared with the same quarter a year earlier, a direct reflection of surging AI accelerator deployments.
What this tells you is specific: current margin levels are a product of constrained supply priced into a sold-out market, not a structural operating efficiency gain. The margin story holds only as long as the supply constraint holds. That distinction is the foundational filter for every other part of the investment thesis.
High-Bandwidth Memory (HBM) is a memory architecture that stacks DRAM dies vertically and connects them through silicon interposers, purpose-built for the bandwidth demands of AI accelerators. Where standard DRAM sends data through a single layer, HBM stacks multiple layers and connects them simultaneously, delivering the data throughput that chips like Nvidia’s GPU accelerators require.
Three companies manufacture HBM at scale: Micron, SK Hynix, and Samsung. The technical complexity of manufacturing, which involves advanced packaging, precise thermal management, and silicon-through-via interconnects, creates meaningful barriers to rapid capacity addition by new entrants.
The memory repricing event that preceded these quarterly results was itself driven by converging supply shocks: sold-out HBM capacity, a looming Samsung labour disruption, and the exclusion of semiconductor equipment suppliers from US-China trade talks, each independently tightening a market that already had no slack.
| Supplier | HBM generation | Supply status |
|---|---|---|
| Micron | HBM3E shipping; HBM4 ramping in calendar 2026 | Full 2026 capacity sold out under fixed-price contracts |
| SK Hynix | HBM3E shipping; HBM4 in qualification | Strong early positioning with Nvidia; actively expanding capacity |
| Samsung | HBM3E shipping; HBM4 development stage | Catching up on yields; customer qualification ongoing |
The HBM total addressable market is projected to reach approximately $100 billion by 2028, driven by AI data centre build-outs and sovereign AI initiatives globally.
The HBM price surge projected by Bernstein for 2027 does not stay contained at the memory level: GPU vendors targeting 75% gross margins are expected to apply roughly a fourfold amplification to any input cost increase, meaning the pricing pressure flows through to hyperscaler infrastructure budgets at a multiple of the original memory cost move.
SK Hynix secured early qualification with Nvidia and has been expanding capacity aggressively. That relationship means HBM market share is actively contested, and Micron’s position as a strategic rather than secondary supplier is not guaranteed on each new GPU generation.
The oligopoly structure is real, but oligopolies only de-risk a position if each member retains qualification status with the customers that matter most. Micron’s HBM share relative to SK Hynix is one of the two or three most important metrics you should be watching.
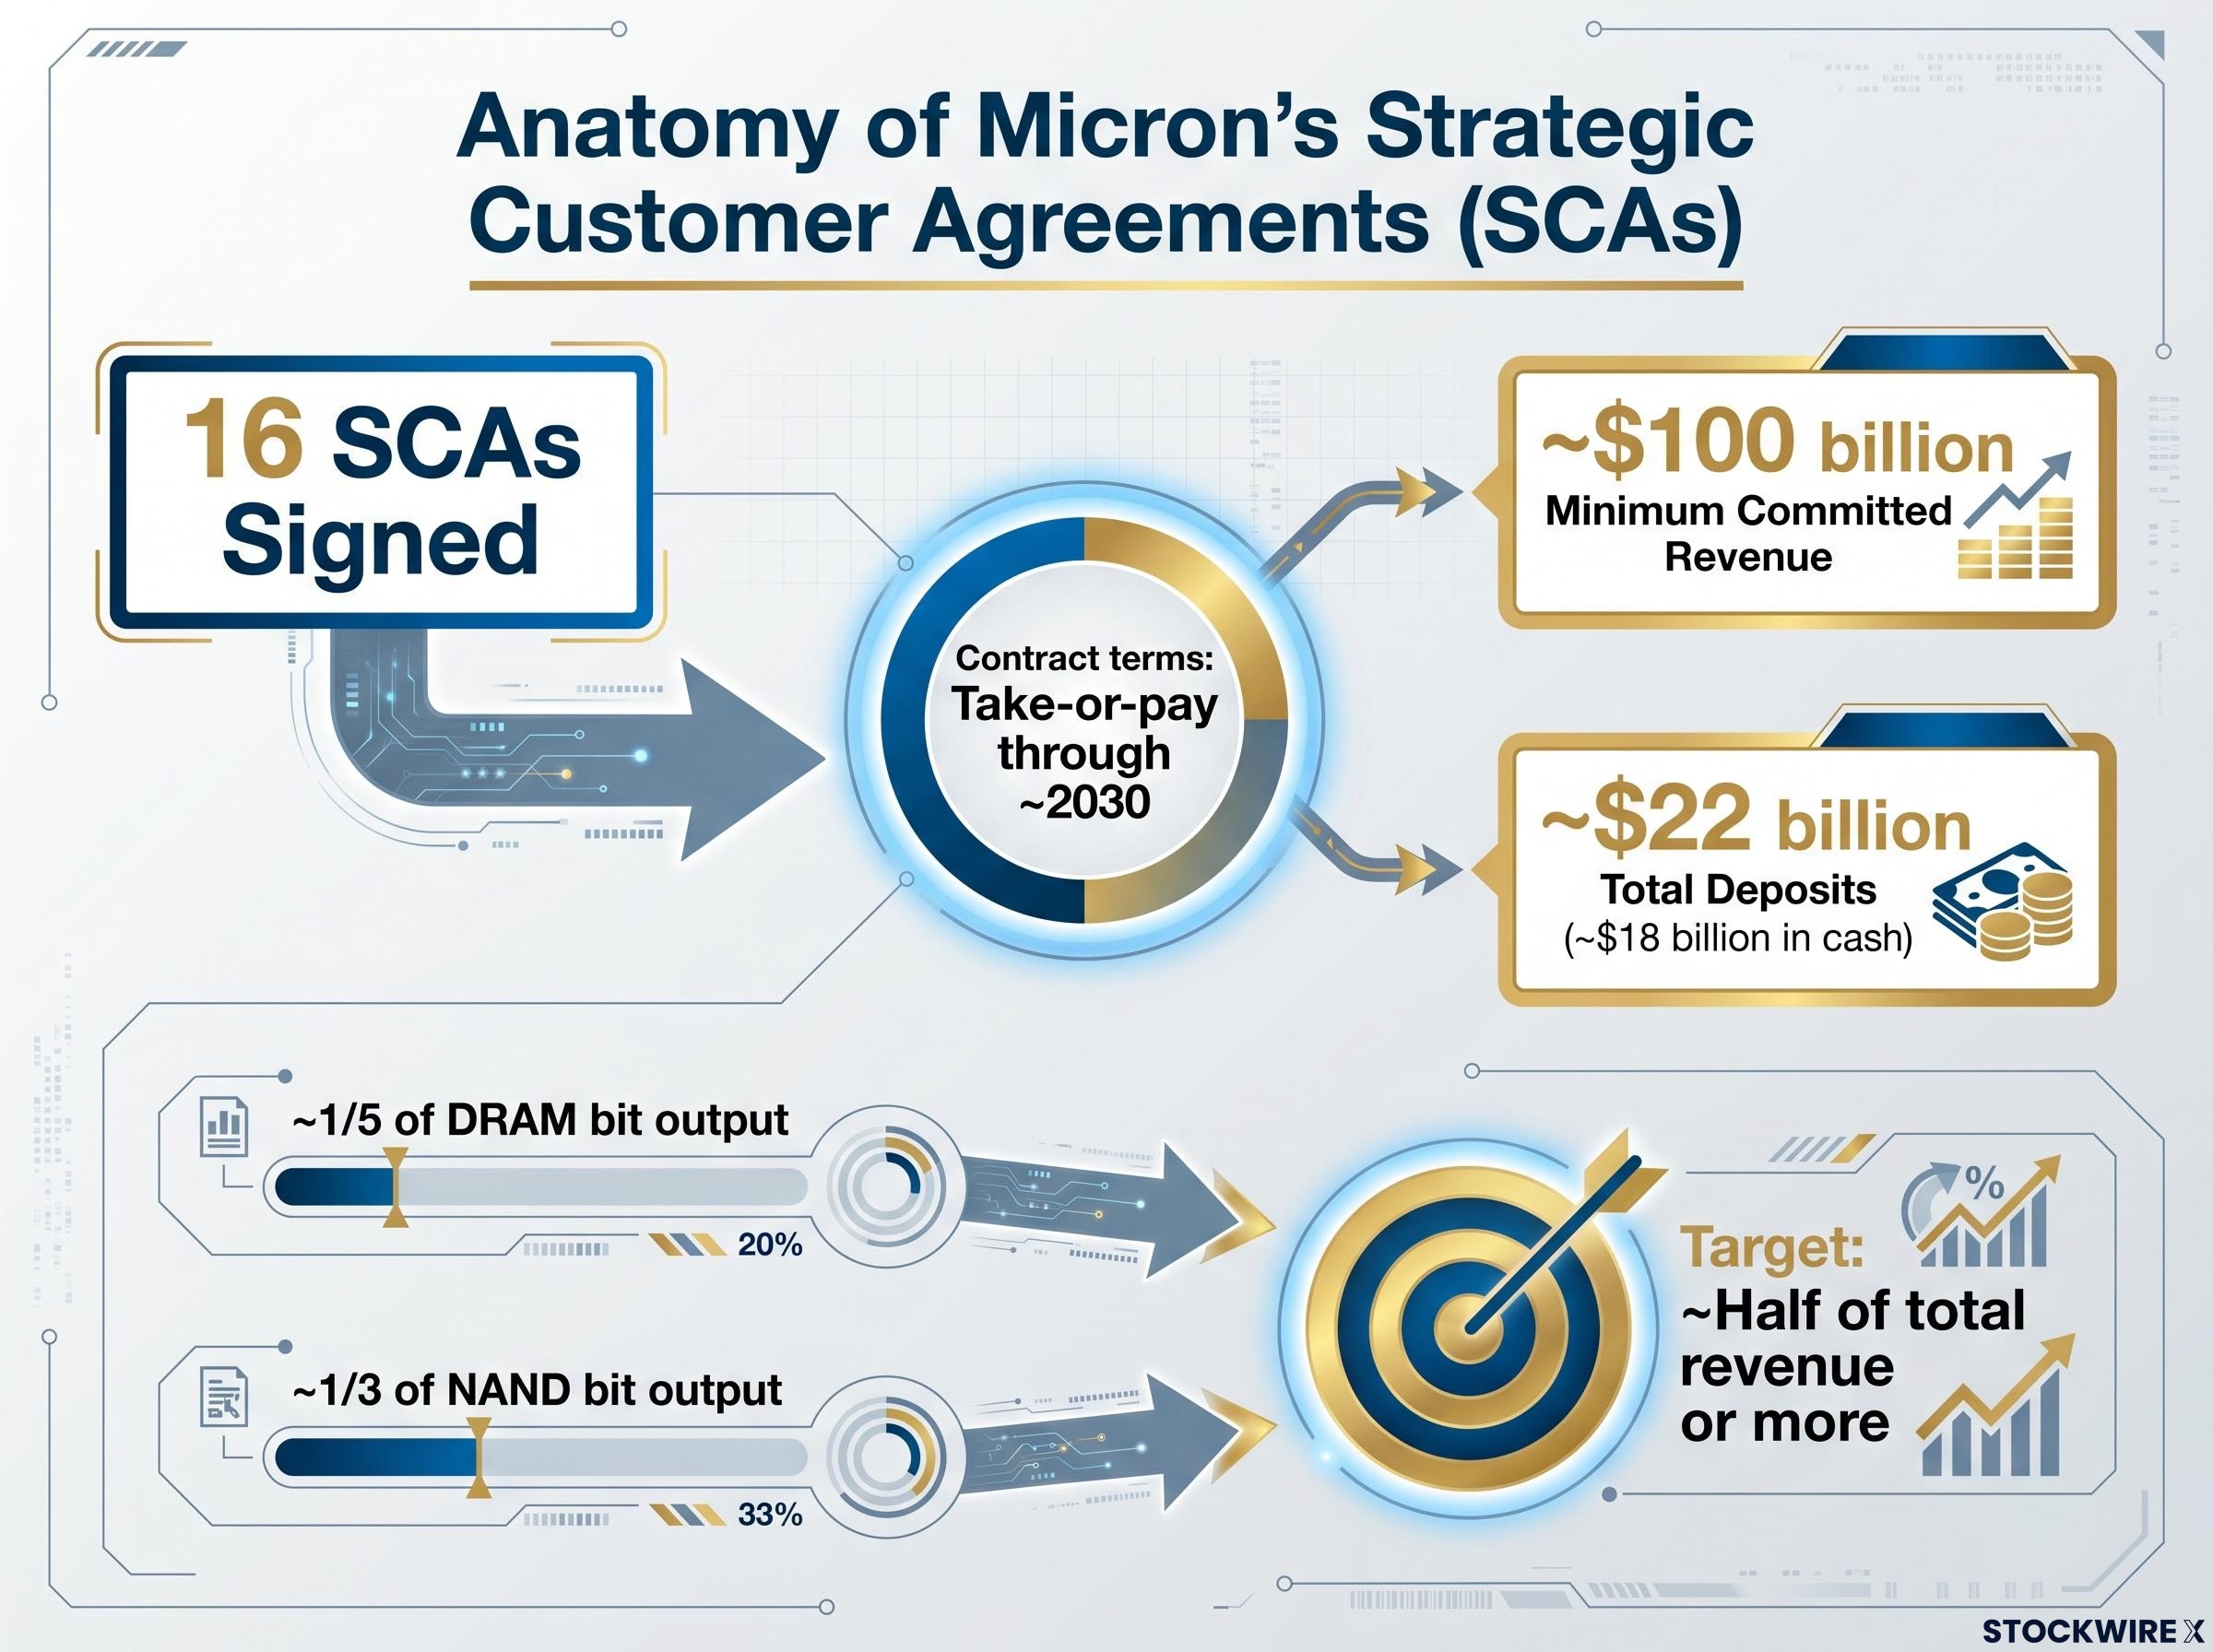
Micron has signed 16 Strategic Customer Agreements (SCAs), a contract structure that represents the most genuinely new element of this investment story. The key terms:
$18 billion in cash deposits. This represents a structural transfer of financial risk from Micron’s balance sheet to customers’ balance sheets. That is a meaningful change in how Micron’s earnings should be valued relative to prior cycles.
SCAs shift part of the cycle risk from Micron to customers. They lock in future output at pre-negotiated terms, make it financially painful for customers to walk away during a downturn, and provide capital visibility that historically did not exist in the memory industry.
What SCAs do not do is eliminate cyclicality. Take-or-pay contracts in other industries, including LNG and pipeline infrastructure, have been revisited under extreme stress. It is reasonable to assume that in a severe downturn or significant technological shift, some SCA terms could be pressured. Treat them as durable under normal conditions and as renegotiable under severe ones.
| Structural bull case | Cyclical sceptical case |
|---|---|
| Multi-billion-dollar fabs and multi-year construction timelines slow rapid capacity additions | Extreme DRAM pricing has attracted massive capital in every prior cycle |
| AI demand is categorically different from consumer DRAM demand | No credible source argues memory has become permanently non-cyclical |
| Geopolitical constraints concentrate the capable supply base | Current margins and pricing will draw competitor investment |
| SCAs and fixed-price HBM contracts provide revenue visibility through approximately 2030 | Take-or-pay contracts have been renegotiated under stress in other industries |
| Management expects supply will still not fully meet demand even by 2028 | Historical memory cycles ended in 18-24 months; what appears structural at the top has sometimes proven temporary |
Both cases are credible, and the honest synthesis sits between them. The question is not whether memory is now structural. It is whether the current cycle is longer and flatter than prior ones, and what that implies for timing.
The DRAM supply constraint underpinning current pricing is not primarily a capital problem: Google CEO Sundar Pichai has identified memory availability, not funding, as the binding limit on AI infrastructure expansion, even with approximately $180 billion in planned annual capex committed across the hyperscaler tier.
The most defensible position breaks down by time horizon:
For an investor deciding on position sizing today, the near-term is unusually de-risked relative to prior cycle peaks, but the late-decade outlook is where the genuine uncertainty sits.
Micron currently trades at a forward P/E of approximately 10-11x on elevated earnings estimates. At first glance, that does not scream expensive for a company reporting near-85 percent gross margins.
Q4 FY2026 guidance: approximately $50 billion in revenue, approximately $31 EPS (plus or minus $1), approximately 86 percent gross margin. That is the number that produces the $200 billion annualised run-rate narrative.
Prior consensus for Q4 had been approximately $43 billion, which means management’s guidance represented a $7 billion upside surprise for a single quarter.
The CHIPS Act funding awarded to Micron, totalling up to $6.165 billion for fabrication projects in Idaho and New York, reinforces the geopolitical constraint argument: U.S. policy is actively concentrating advanced memory capacity domestically, making rapid entry by new non-allied competitors structurally harder.
But the multiple requires you to form a view on earnings durability, and the two positions break cleanly:
A 10-11x forward P/E on a commodity manufacturer reporting near-85 percent gross margins is not obviously expensive, but it is not a margin-of-safety valuation either. It prices in a meaningful amount of earnings durability that you should stress-test against the cycle scenarios above.
Rather than looking backward at Q3, the more useful exercise is forward monitoring. These six metrics connect directly to specific thesis elements:
Semiconductor cycle monitoring across the broader sector points to the same 2027-2029 supply wave risk: TSMC’s locked-in capital budget of $52-56 billion and Samsung’s estimated $70-80 billion annual outlay confirm new capacity is a structural certainty rather than a conditional threat, with equipment lead times already running.
The near-term case is unusually strong:
The late-decade uncertainty is equally real:
The stock is not a speculation on whether AI is real. That question is settled. It is a bet on whether the structural features Micron has built (SCAs, HBM positioning, margin profile) are durable enough to hold earnings through the next capacity cycle.
The investor who sizes this position relative to their confidence in those specific structural features, rather than relative to the headline revenue figures, will be better positioned to hold through volatility or exit when a specific thesis element breaks. The six metrics above are the monitoring framework. Watch them quarterly, and let the data, not the narrative, determine whether the thesis is holding.
This article is for informational purposes only and should not be considered financial advice. Investors should conduct their own research and consult with financial professionals before making investment decisions. Past performance does not guarantee future results. Financial projections are subject to market conditions and various risk factors.
Strategic Customer Agreements are take-or-pay contracts that obligate customers to pay Micron even if they do not take delivery. Micron has signed 16 of these agreements covering at least $100 billion in minimum committed revenue, backed by roughly $18 billion in cash deposits, which shifts a meaningful portion of cycle risk from Micron's balance sheet to its customers.
High-Bandwidth Memory (HBM) is a stacked DRAM architecture purpose-built for the data throughput demands of AI accelerators like Nvidia's GPUs. Micron's full 2026 HBM capacity is sold out under fixed-price contracts, and the HBM total addressable market is projected to reach approximately $100 billion by 2028, making it the single most important product line driving Micron's current margin expansion.
The margin surge was driven primarily by pricing, not volume: bit shipments increased only modestly in the low single-digit percentage range while per-unit pricing surged sharply as customers competed for constrained supply. That means current margins hold only as long as the supply constraint holds, which is the foundational filter for assessing the durability of the earnings story.
The three most material risks are: SK Hynix winning a larger share of HBM qualification with Nvidia on future GPU generations, new competitor capacity from Samsung and SK Hynix arriving earlier than Micron's management expects (currently projected no earlier than 2028), and potential renegotiation of take-or-pay SCA terms under severe demand stress, a pattern seen in comparable contract structures in other capital-intensive industries.
The six most important metrics are: HBM market share versus SK Hynix, SCA coverage as a share of total revenue (management targets roughly 50%), bit volume growth rates, competitor capex announcements from Samsung and SK Hynix, free cash flow generation and capital allocation decisions, and any signals of SCA renegotiation or customer deposit drawdowns.