Why BTK Inhibitor Resistance Opens a Door for Off-the-Shelf CAR-T
44 mins ago

The ASX 200 has returned approximately 1.3% year-to-date. Taiwan’s TAIEX is up roughly 57%. That is not a rounding error or a short-term blip. It is a 55-percentage-point gap between two equity markets operating in the same global economy, during the same six months, available to the same investors.
The divergence is structural. The ASX is built for a different kind of market cycle than the one running in 2026, and most Australian investors have unknowingly concentrated their portfolios in a corner of the global economy representing roughly 2% of world market capitalisation.
Here is what the performance data actually tells you about your current portfolio, and a practical, tax-efficient framework for changing it. This piece walks through the numbers, the structural reasons behind them, the currency decision most investors are making by default rather than by design, and a step-by-step ETF approach you can act on with your next investment.
Start with what you probably already sense: the ASX has been flat. The ASX 200 accumulation index has delivered approximately 1.3% year-to-date. The FTSE 100, a market not typically associated with high growth, has returned roughly 4.4%, about four times the Australian result.
Then the numbers get harder to sit with. The NASDAQ 100 is up approximately 14-16% in USD terms, driven by artificial intelligence and mega-cap technology names. The Nikkei 225 has surged more than 40% in local currency, fuelled by an economy that grew well ahead of forecasts and a multi-trillion dollar stimulus package unveiled in recent months, both of which prompted investors to re-rate Japanese equities upward.
And then there is Taiwan.
| Market | Index | 2026 YTD Return | Primary Driver | Currency Basis |
|---|---|---|---|---|
| Taiwan | TAIEX | ~57% | TSMC / semiconductors | Local currency |
| Japan | Nikkei 225 | ~40%+ | Stimulus / equity re-rating | Local currency |
| United States | NASDAQ 100 | ~14-16% | AI / mega-cap technology | USD |
| United Kingdom | FTSE 100 | ~4.4% | Broad-based | Local currency |
| Australia | ASX 200 | ~1.3% | Banks / resources | AUD |
| Hong Kong | Hang Seng | ~-7% | China weakness | HKD |
| China | Broad market | ~-12% | Structural slowdown | Local currency |
The standout: The TAIEX has posted a year-to-date gain of approximately 57%, with TSMC accounting for around 27% of the index by weight. A single chipmaker, propelled by surging global demand for semiconductors, has lifted an entire national market to gains that no other developed-market index comes close to matching.
Three distinct growth narratives have driven the top performers: TSMC and semiconductors in Taiwan, AI and mega-cap technology in the United States, and government stimulus with a multi-year equity re-rating in Japan. Australian equities offer no meaningful foothold in any of those themes. Your underperformance against global peers in 2026 is not random volatility. It is the predictable output of a portfolio concentrated in sectors that are structurally absent from the current global growth cycle.
The ASX 200 is dominated by two sectors: resources and banking. Together, they account for a large majority of the index’s market capitalisation, and they operate on opposing cycle dynamics. Rising interest rates tend to help bank margins but weigh on commodity demand. Falling rates do the reverse. The two biggest sectors rarely fire simultaneously, which effectively caps the index’s ability to deliver outsized gains in any given year.
ASX 200 concentration risk is more severe than the index’s 200-stock label implies, with financials and materials together exceeding 50% of market-cap weight, meaning two sectors effectively determine the index’s annual result before any other factor comes into play.
That two-speed dynamic is only half the problem. The other half is what the ASX simply does not have:
Japan’s surge illustrates the gap from a different angle. Its 40%+ gain did not come from technology alone. It came from better-than-expected GDP growth, large-scale fiscal stimulus, and a multi-year low valuation re-rating. Australia in 2026 has had no comparable growth narrative of any kind: no stimulus programme, no structural reform story, no sector-specific boom.
For you, this is a structural diagnosis, not a temporary condition. Holding only Australian shares is not a neutral default. It is an active decision to exclude the sectors and themes generating most of the world’s equity wealth in 2026. Waiting for the ASX to catch up is not a strategy, because the sectors missing from the index cannot grow into it simply through time.
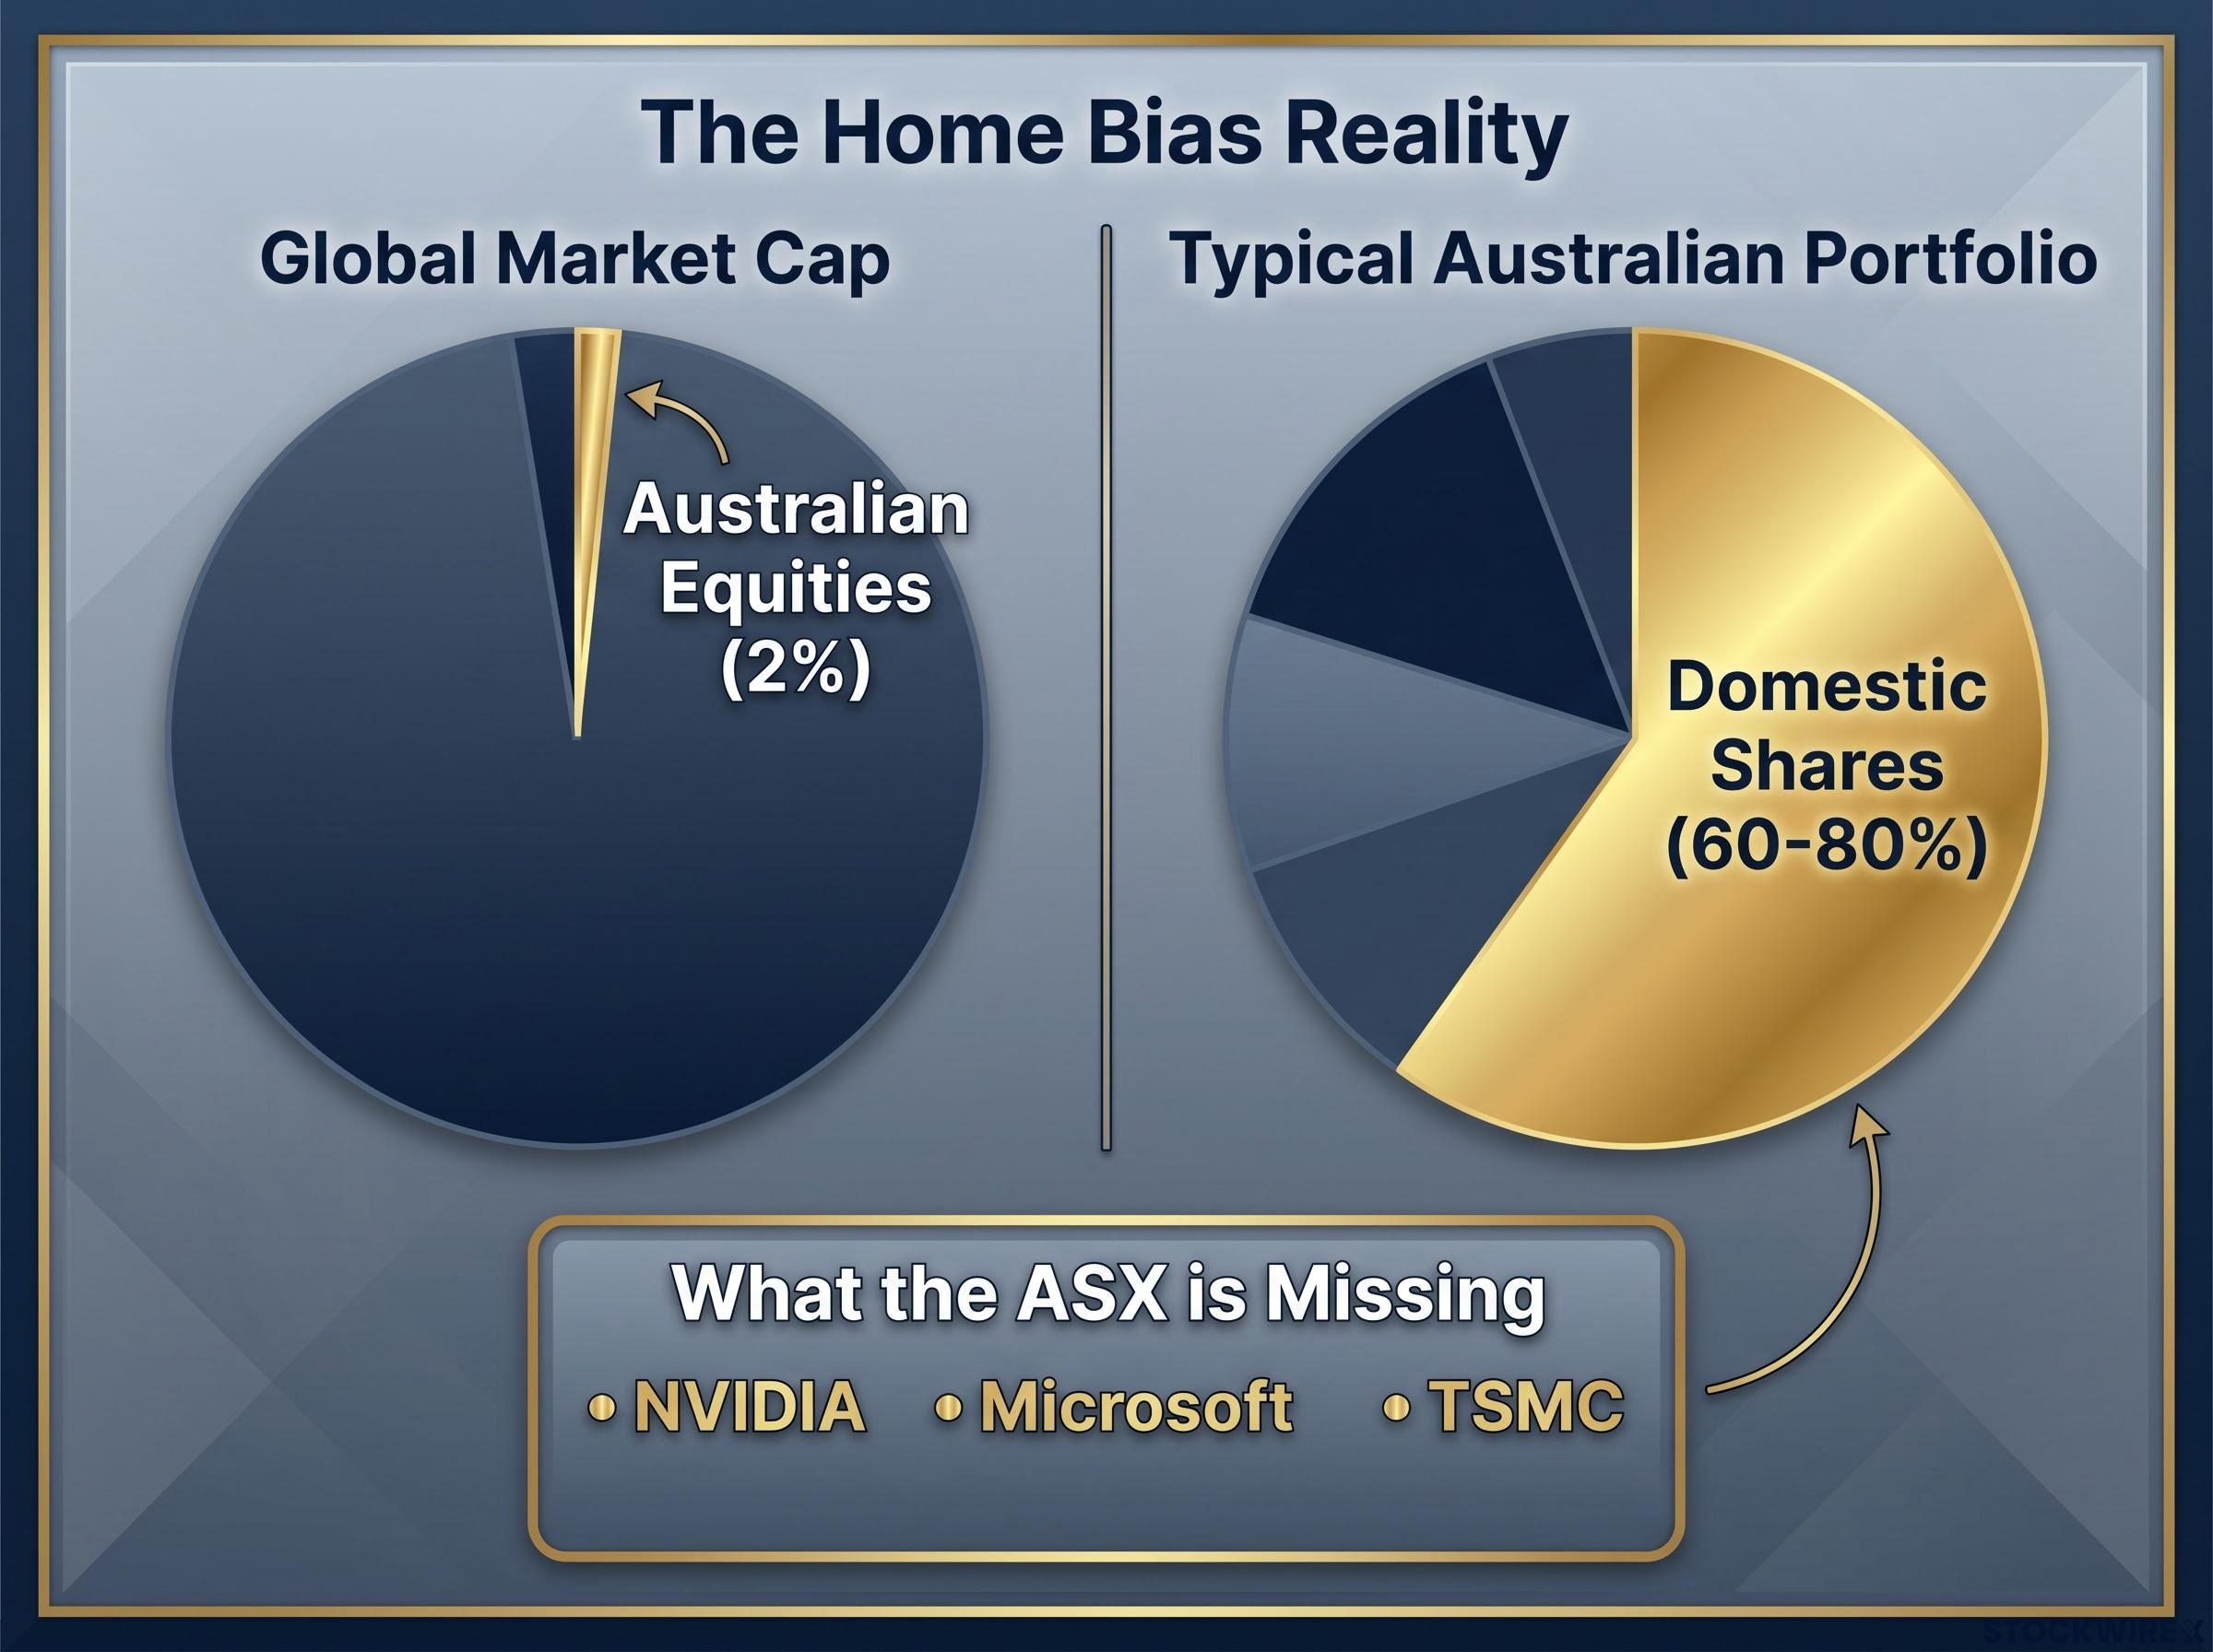
Australian equities account for roughly 2% of total global market capitalisation.
Sit with that for a moment. Many Australian investors hold 60-80% of their equity portfolio in domestic shares. That is not conservative positioning. It is a highly concentrated active bet on a tiny slice of the global economy.
The home bias return cost is measurable over a decade: the ASX has delivered annualised returns of 11.1% including franking credits versus 15.5% for the S&P 500, and Morningstar’s analysis confirms that franking credits alone do not close the gap for growth-oriented investors.
The reasons for the tilt are genuine. Australian shares carry structural advantages that most foreign markets cannot match:
But those advantages come with structural limitations:
The practical conclusion is “both/and” rather than “either/or.” Your existing Australian holdings are not wrong; they are incomplete. They capture income and tax efficiency while missing the growth sectors driving global wealth creation in this cycle. International diversification is designed to add what the ASX structurally lacks, not to replace the income and franking credit advantages of domestic holdings.
This distinction matters because it turns the diversification case from abstract theory into a specific, actionable gap in your portfolio.
Consider two Australian investors who each bought Japan ETFs at the start of 2026. Both own essentially identical underlying Japanese equities. One has earned a 27.7% return; the other has earned roughly 13%. That 14-percentage-point gap has nothing to do with stock selection.
The entire 14-percentage-point difference is currency.
The gap in one number: A spread of around 14 percentage points opened up between hedged and unhedged Japanese equity returns in 2026, driven solely by the Australian dollar appreciating against the yen over the period.
The BetaShares Japan Currency-Hedged ETF (HJPN) returned approximately 27.7% year-to-date excluding distributions. The iShares Japan ETF (IJP, unhedged) returned approximately 13%. Both products hold the same underlying market. The AUD has strengthened against the yen in 2026, reducing unhedged returns when converted back to Australian dollars.
| Factor | Hedged (HJPN) | Unhedged (IJP) |
|---|---|---|
| 2026 YTD return | ~27.7% | ~13% |
| Currency exposure | Removed (AUD returns) | Full JPY exposure |
| Best suited to | Isolating market return | Long-term / risk-off cushion |
| Key cost consideration | Hedging costs tied to interest rate differentials | Currency volatility absorbed by investor |
The hedging decision is not a minor administrative detail. In 2026, it has equalled or exceeded the entire return from a market in a single year. A practical framework: hedge where interest-rate or currency differentials are extreme (Japan is the current example); consider leaving major USD exposure unhedged, given the AUD’s tendency to weaken during global risk-off episodes, which provides a natural portfolio cushion when you need it most.
Many Australian retail investors end up in unhedged ETFs without ever consciously selecting that exposure. This is a decision that deserves conscious attention on every international purchase you make.
For investors wanting to model the full range of scenarios, our dedicated guide to the hedged versus unhedged ETF decision examines the HNDQ versus NDQ 13-percentage-point gap in detail, with a practical framework for deciding which structure fits your time horizon and AUD spending needs.
If you hold significant unrealised gains in Australian shares, selling to diversify means triggering capital gains tax (CGT), the tax you pay on investment profits, at your peak marginal rate. For investors in their 40s and 50s at peak earning years, that tax bill can be substantial.
The alternative: direct new savings and reinvested Australian dividends into international ETFs. This gradually shifts your portfolio’s global balance without crystallising a CGT event today. If you plan to reduce work hours or retire in the medium term, you can defer realising gains on long-held Australian positions until your taxable income falls, potentially paying CGT at a lower rate.
Note: recent government superannuation tax changes impose a minimum 30% tax rate, which limits but does not eliminate this deferral strategy for some investors.
Where one partner in a household has a structurally lower income, allocating more international assets in that partner’s name improves after-tax outcomes over time. Financial advisers treat this as standard practice, but DIY investors often overlook it.
ASX-listed ETFs now provide access to global broad markets, regional exposures, and sector themes including technology, healthcare, semiconductors, and clean energy.
An ETF-based fix for ASX concentration centres on VGS and IVV as the two dominant instruments Australian investors use to access technology, healthcare, and consumer sectors the domestic index structurally under-represents, with both funds capturing the majority of annual ETF inflows from Australian retail investors.
The structure question matters:
Drew Meredith of Wattle Partners has noted that the share of financial planning clients choosing direct share portfolios has fallen to below 10% today, compared with around 95% roughly a decade ago. The infrastructure for global ETF diversification is already mainstream.
Treat global exposure as a permanent portfolio feature. Review annually or semi-annually. Rebalance to target weights rather than chasing recent performance. A common error among Australian investors is adding international exposure only after the ASX has lagged for a painful stretch, which amounts to chasing whatever already outperformed.
The 2026 divergence will not be the last time Australia lags, but it will also not be the last time Australia leads. Commodity surges, defensive income environments, and global tech de-rating episodes will create cycles where a dividend-heavy, resources-rich ASX outperforms globally diversified portfolios.
The goal is not to guess which market leads next. It is to hold a portfolio with genuine exposure to the global economy rather than a 2% slice of it.
The principles this piece has built toward are straightforward:
Your current portfolio is not wrong. It is incomplete. The correction is gradual, tax-efficient global exposure added systematically rather than reactively. The ASX 200 at 1.3% versus global leaders is a composition story, not a bad luck story, and composition is something you can change.
This article is for informational purposes only and should not be considered financial advice. Investors should conduct their own research and consult with financial professionals before making investment decisions. Past performance does not guarantee future results.
Investing overseas from Australia means allocating part of your portfolio to international shares or ETFs listed outside the ASX, giving you exposure to sectors and markets, such as US technology, Japanese equities, and Taiwanese semiconductors, that the domestic index structurally lacks.
The ASX 200 is dominated by banks and resources, which together exceed 50% of index weight, and it has no large-cap technology companies, no semiconductor exposure, and no comparable government stimulus narrative; the three themes driving global outperformers in 2026, semiconductors, AI, and Japanese fiscal stimulus, simply do not exist in the Australian index.
Rather than selling existing Australian holdings and crystallising capital gains tax, investors can direct new savings and reinvested dividends into international ETFs, gradually shifting the portfolio's global balance without triggering a taxable event.
A hedged ETF removes currency exposure so your return reflects the underlying market in AUD terms, while an unhedged ETF means your return also rises or falls with exchange rate movements; in 2026, this distinction created a 14-percentage-point gap between hedged and unhedged Japanese equity ETFs available on the ASX.
Morningstar's analysis confirms that franking credits alone do not close the gap for growth-oriented investors; the ASX delivered annualised returns of 11.1% including franking credits over the past decade versus 15.5% for the S&P 500, meaning international diversification adds growth the domestic income layer cannot replace.