Meta shares jumped about 4% at Monday’s open to near $748. Within seconds, a cluster of aggressively filled put orders worth roughly $32 million hit the tape, according to a Tasty Life options-flow segment. Urgent buying looks like conviction, but conviction about what is less obvious than it seems.
The timing explains why traders noticed. Meta’s third-quarter report is close, and its last report, in July, sent the stock down roughly 9-10% after hours. The put cluster also runs against a Wall Street consensus that is overwhelmingly bullish.
Two caveats apply from the start. The original source dates the report to 21 October, but Meta has not confirmed it, and MarketBeat’s latest estimate is 28 October. The $32 million figure has not been independently corroborated.
Here is what this flow does and does not reveal, which fundamentals make downside protection rational, and how to read the next big print that crosses your screen.
What did the $32 million in Meta put options actually look like?
The mechanics carried the urgency. According to the presenter, roughly six put orders filled at or above the ask, the price sellers are asking. Buyers who pay the ask are choosing speed over a better price.
Speed of execution Five of the six orders filled within about 22 seconds, several at roughly 97-98% of the ask.
Short-dated trades (October 16)
About $14.3 million went into puts expiring 16 October, four days out. The 740 and 730 strikes sat only 1-2% out of the money, and they traded at about four times existing open interest, the number of contracts already outstanding. This expiry falls before earnings under either reported date, so these trades were not earnings bets.
Longer-dated trades (November 20)
The larger slice, about $17.97 million, spread across four strikes expiring 20 November, an expiry that spans the report.
| Expiry | Strike | Premium | Approx. break-even |
|---|---|---|---|
| 16 October | 740 | $8.29M | $729.50 |
| 16 October | 730 | $6.04M | $723.38 |
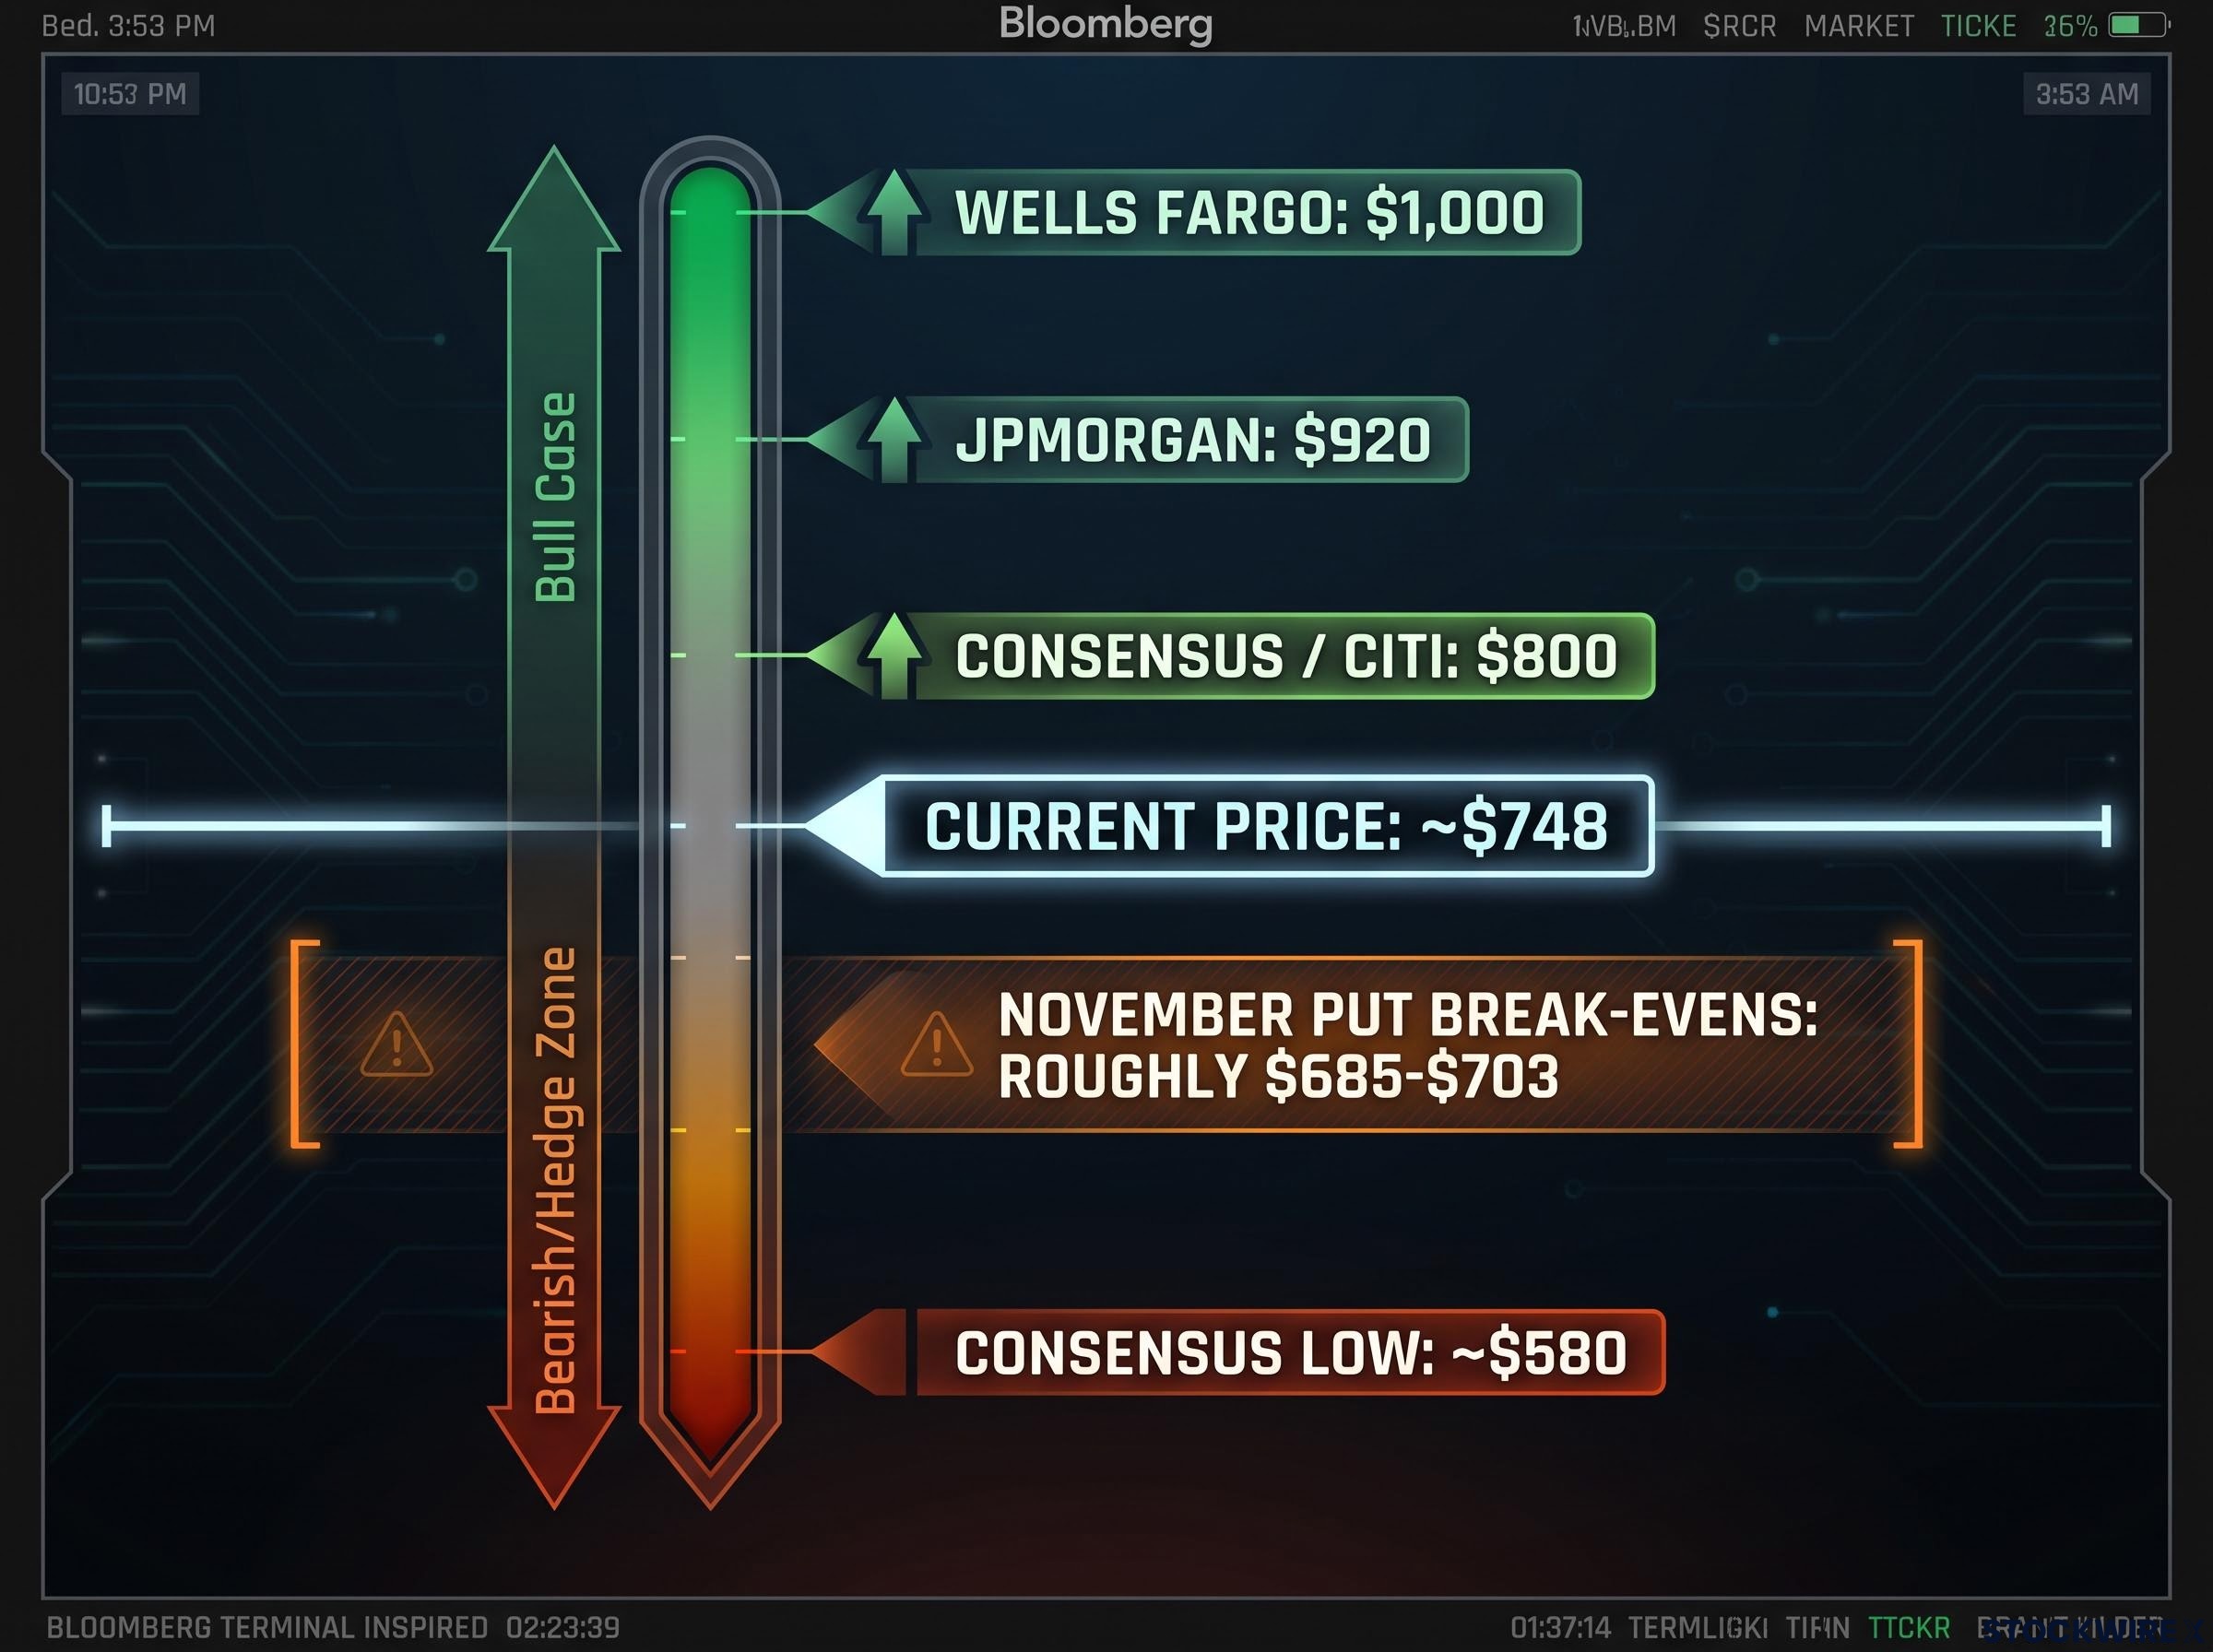
| 20 November | 730 | $7.46M | Roughly $685-$703 across strikes |
| 20 November | 740 | $4.71M | |
| 20 November | 720 | $3.24M | |
| 20 November | 710 | $2.56M |
Public data backs the broad picture, if not the exact totals. OptionsBell logged about $3.5 million in premium at the $720 strike, and OptionCharts flagged heavy volume relative to open interest in the $735-$745 puts. SquawkFlow, meanwhile, tracked about $78.6 million in call premium for the same 16 October expiry.
The break-evens tell you the November buyers need only a pullback to roughly $700 within 39 days to profit. That is a modest-move trade, not a collapse call, and you should weigh it that way. The urgency describes how the buyer traded. It says nothing certain about what the buyer believes.
When big ASX news breaks, our subscribers know first
Why would anyone buy downside protection on Meta now?
On the surface, the bull case looks overwhelming. The weak spots sit beneath the revenue line, in July’s profit and cash-flow numbers.
What went wrong in July
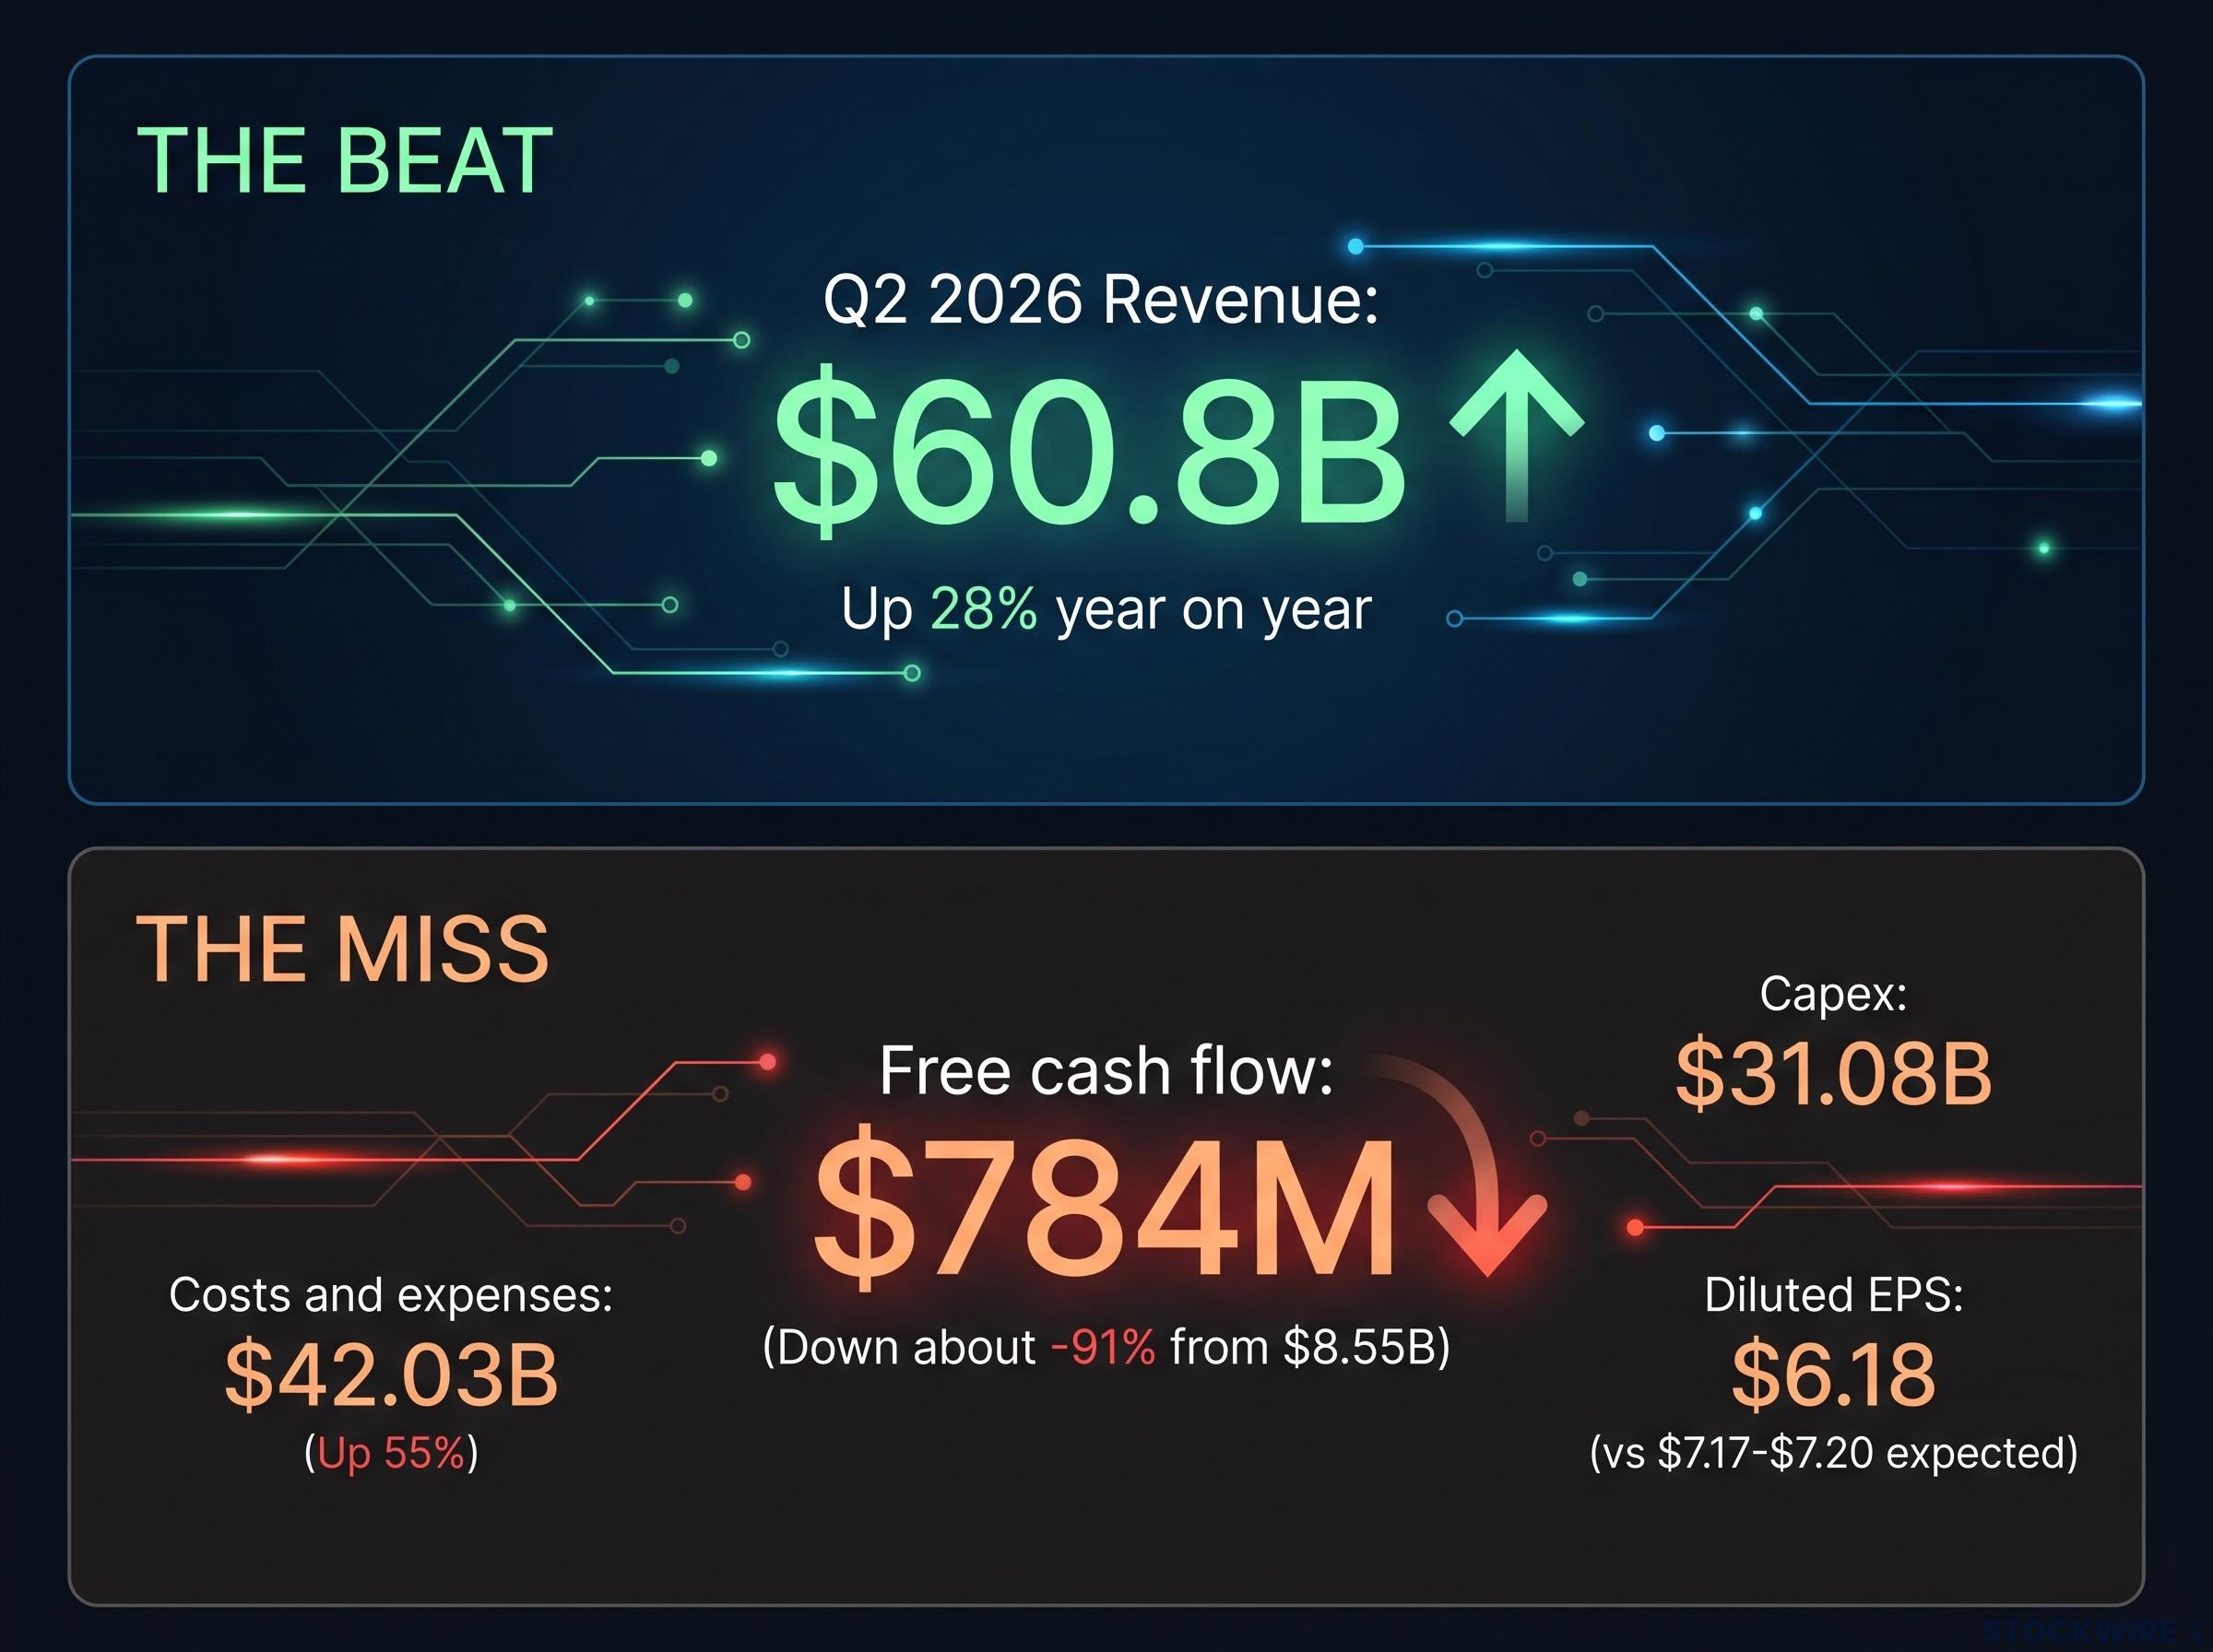
Meta’s Q2 2026 report, released on 29 July, beat on revenue and still sank the stock.
| Q2 2026 metric | Result | Comparison |
|---|---|---|
| Revenue | $60.8B | Up 28% year on year |
| Diluted EPS | $6.18 | About $7.17-$7.20 expected |
| Costs and expenses | $42.03B | Up 55% |
| Capex | $31.08B | 2026 guidance $130B-$145B |
| Free cash flow | $784M | $8.55B a year earlier (about -91%) |
Capex, or capital expenditure, is money spent on long-term assets such as data centres. Free cash flow is the cash left after those outlays. Expense guidance of $165B-$169B and a Q3 revenue midpoint of $62.5B, below consensus near $63.2B-$63.3B, compounded the damage.
Two readings compete. The structural view holds that AI costs may keep outrunning monetisation. The cyclical view blames legal and severance charges and treats capex as spending that comes before Muse revenue arrives.
For readers wanting the full numbers, our deep-dive into Meta’s Q2 results breaks down the $2.4 billion legal charge and $1.18 billion severance cost behind the expense surge.
The bull case the puts are betting against
Wall Street largely sides with the cyclical view:
- Wells Fargo‘s Ken Gawrelski raised his target to $1,000 and expects Q3 revenue near $64B.
- Citi‘s Ronald Josey holds an $800 target, with the bank projecting Muse above $27B in annual revenue by 2030.
- JPMorgan lifted its target to $920.
- Consensus sits near $800, with a low of about $580; ratings run 47 strong buy, 8 buy, 7 hold, 0 sell, 1 strong sell.
Meta has also launched Muse Wonder, an upgraded Muse app, and no clear short-term catalyst points lower. Q3 consensus revenue sits near $63.3B with EPS of $6.77, per MarketBeat. A stock can beat on revenue and still fall, so you should judge Meta on whether spending converts into margin and free cash flow, not on the top line alone.
Bearish bet or hedge: how to read the Meta put options flow
On a flow screen, Monday’s print looks simple: big puts, paid at the ask. The structure behind it may not be.
Alerts on unusual options activity confirm that abnormal volume hit a strike, but they cannot show whether the buyer is betting on a decline, hedging shares, or holding one leg of a larger structure.
A put option gives its buyer the right to sell a stock at a set price, the strike, before expiry. If the stock falls below the strike, the put gains value. That is why investors who already own shares often buy puts as insurance.
Four ways to read the same print
| Interpretation | What the trade looks like | Net market view |
|---|---|---|
| Outright bearish | Puts bought with no stock held | Expects a decline |
| Protective hedge | Puts layered over long shares | Bullish, protecting gains |
| Put spread | Puts bought, lower strike sold | Bearish within a limited range |
| Collar | Puts bought, calls sold against shares | Can stay fundamentally bullish |
The multiple November strikes could be legs of a spread, with sold contracts not shown in the headline premium. Rolls from expiring positions and market-maker hedging are secondary possibilities. Meta’s heavily institutional ownership makes the hedge reading common for large funds sitting on gains.
Pricing matters too. Admiral Markets estimated an implied earnings move of about ±6-7%, and Ohey put a longer-dated implied range at roughly $632-$809 through 6 November. Over 10 years, Meta’s average post-earnings move has been about ±11.8%.
The presenter’s framing Urgency is the signal; assuming an outright short is noise.
Because the market already prices a large move, you should read expensive put buying as possibly rational insurance rather than a forecast of a drop. The most defensible conclusion is demand for downside protection ahead of a high-volatility event.
What can options flow not tell you?
The print looked like a warning. The evidence around it is more mixed.
| Caveat | Why it matters |
|---|---|
| Spread legs | Gross premium overstates net bearish exposure |
| Collars | The buyer may remain net bullish |
| Closing or rolling trades | Apparent new buying may adjust an old position |
| Dealer hedging | Market-maker activity can look directional |
| Gross premium bias | Strike, expiry and volatility shape real exposure |
| Conflicting flow | About $78.6M in call premium traded alongside |
July offers a precedent but not proof. Options priced a large move then, and the stock fell about 9-10%, yet that outcome does not show pre-earnings put buying predicts direction. From here, several paths remain open:
- A real decline that rewards directional puts
- A contained reaction where puts served as insurance
- A rally if results clear elevated expectations
- A sharp move either way that rewards volatility trades
Nor is the anxiety unique to Meta. Reuters reported that options were pricing a roughly $190 billion market-value swing ahead of Microsoft‘s 29 July report, a sign that AI capex scrutiny is sector-wide.
Monday’s flow is not the first time large buyers have targeted Meta downside protection; earlier Meta put buying before the September keynote split into a two-day event trade and a longer December thesis.
Two facts remain unresolved: the report date and the uncorroborated $32 million total. You should treat flow as one input beside fundamentals and implied volatility, and confirm the date on Meta’s investor relations page before positioning around it.
What the put buying changes, and what it does not
Monday’s flow shows real demand for downside insurance on Meta. It cannot prove that anyone expects a fall. The stronger reason for caution sits in the July numbers: Meta still has to show that AI spending converts into margin and free cash flow.
Three things deserve your attention:
- The confirmed report date from Meta
- Q3 revenue against the $61B-$64B guidance range
- Free cash flow and any change to expense guidance
The reaction to those numbers, not an options print, will settle the debate.
This article is for informational purposes only and should not be considered financial advice. Investors should conduct their own research and consult with financial professionals before making investment decisions. Past performance does not guarantee future results, and analyst projections are subject to market conditions and various risk factors.