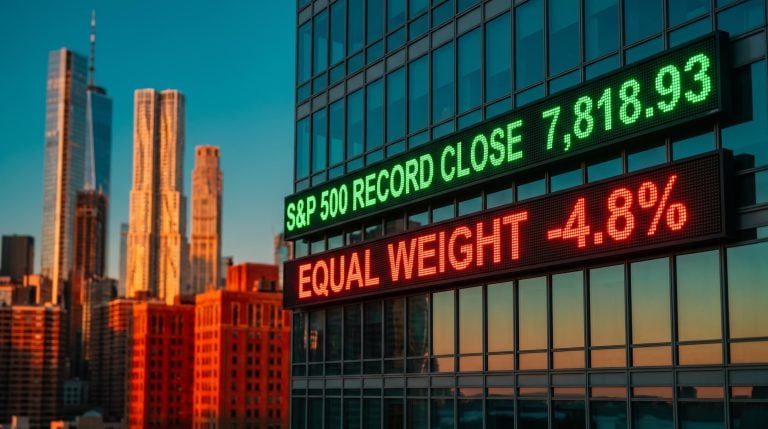
Oil is climbing on fresh Middle East attacks, yet the bond market’s inflation gauges are barely moving. At the same time, the University of Michigan’s current-conditions index has fallen to a record low of 44.7. If you are reading this CPI week preview as a simple “inflation is back” story, you may be missing the more important signal.
September’s Consumer Price Index (CPI) lands tomorrow, Wednesday 14 October 2026. The Producer Price Index (PPI) follows on Thursday 15 October, with retail sales close behind. Futures markets still price Federal Reserve rate hikes in the first half of 2027, roughly 50 basis points above the Fed’s own path, according to the original source. That gap has not been independently confirmed.
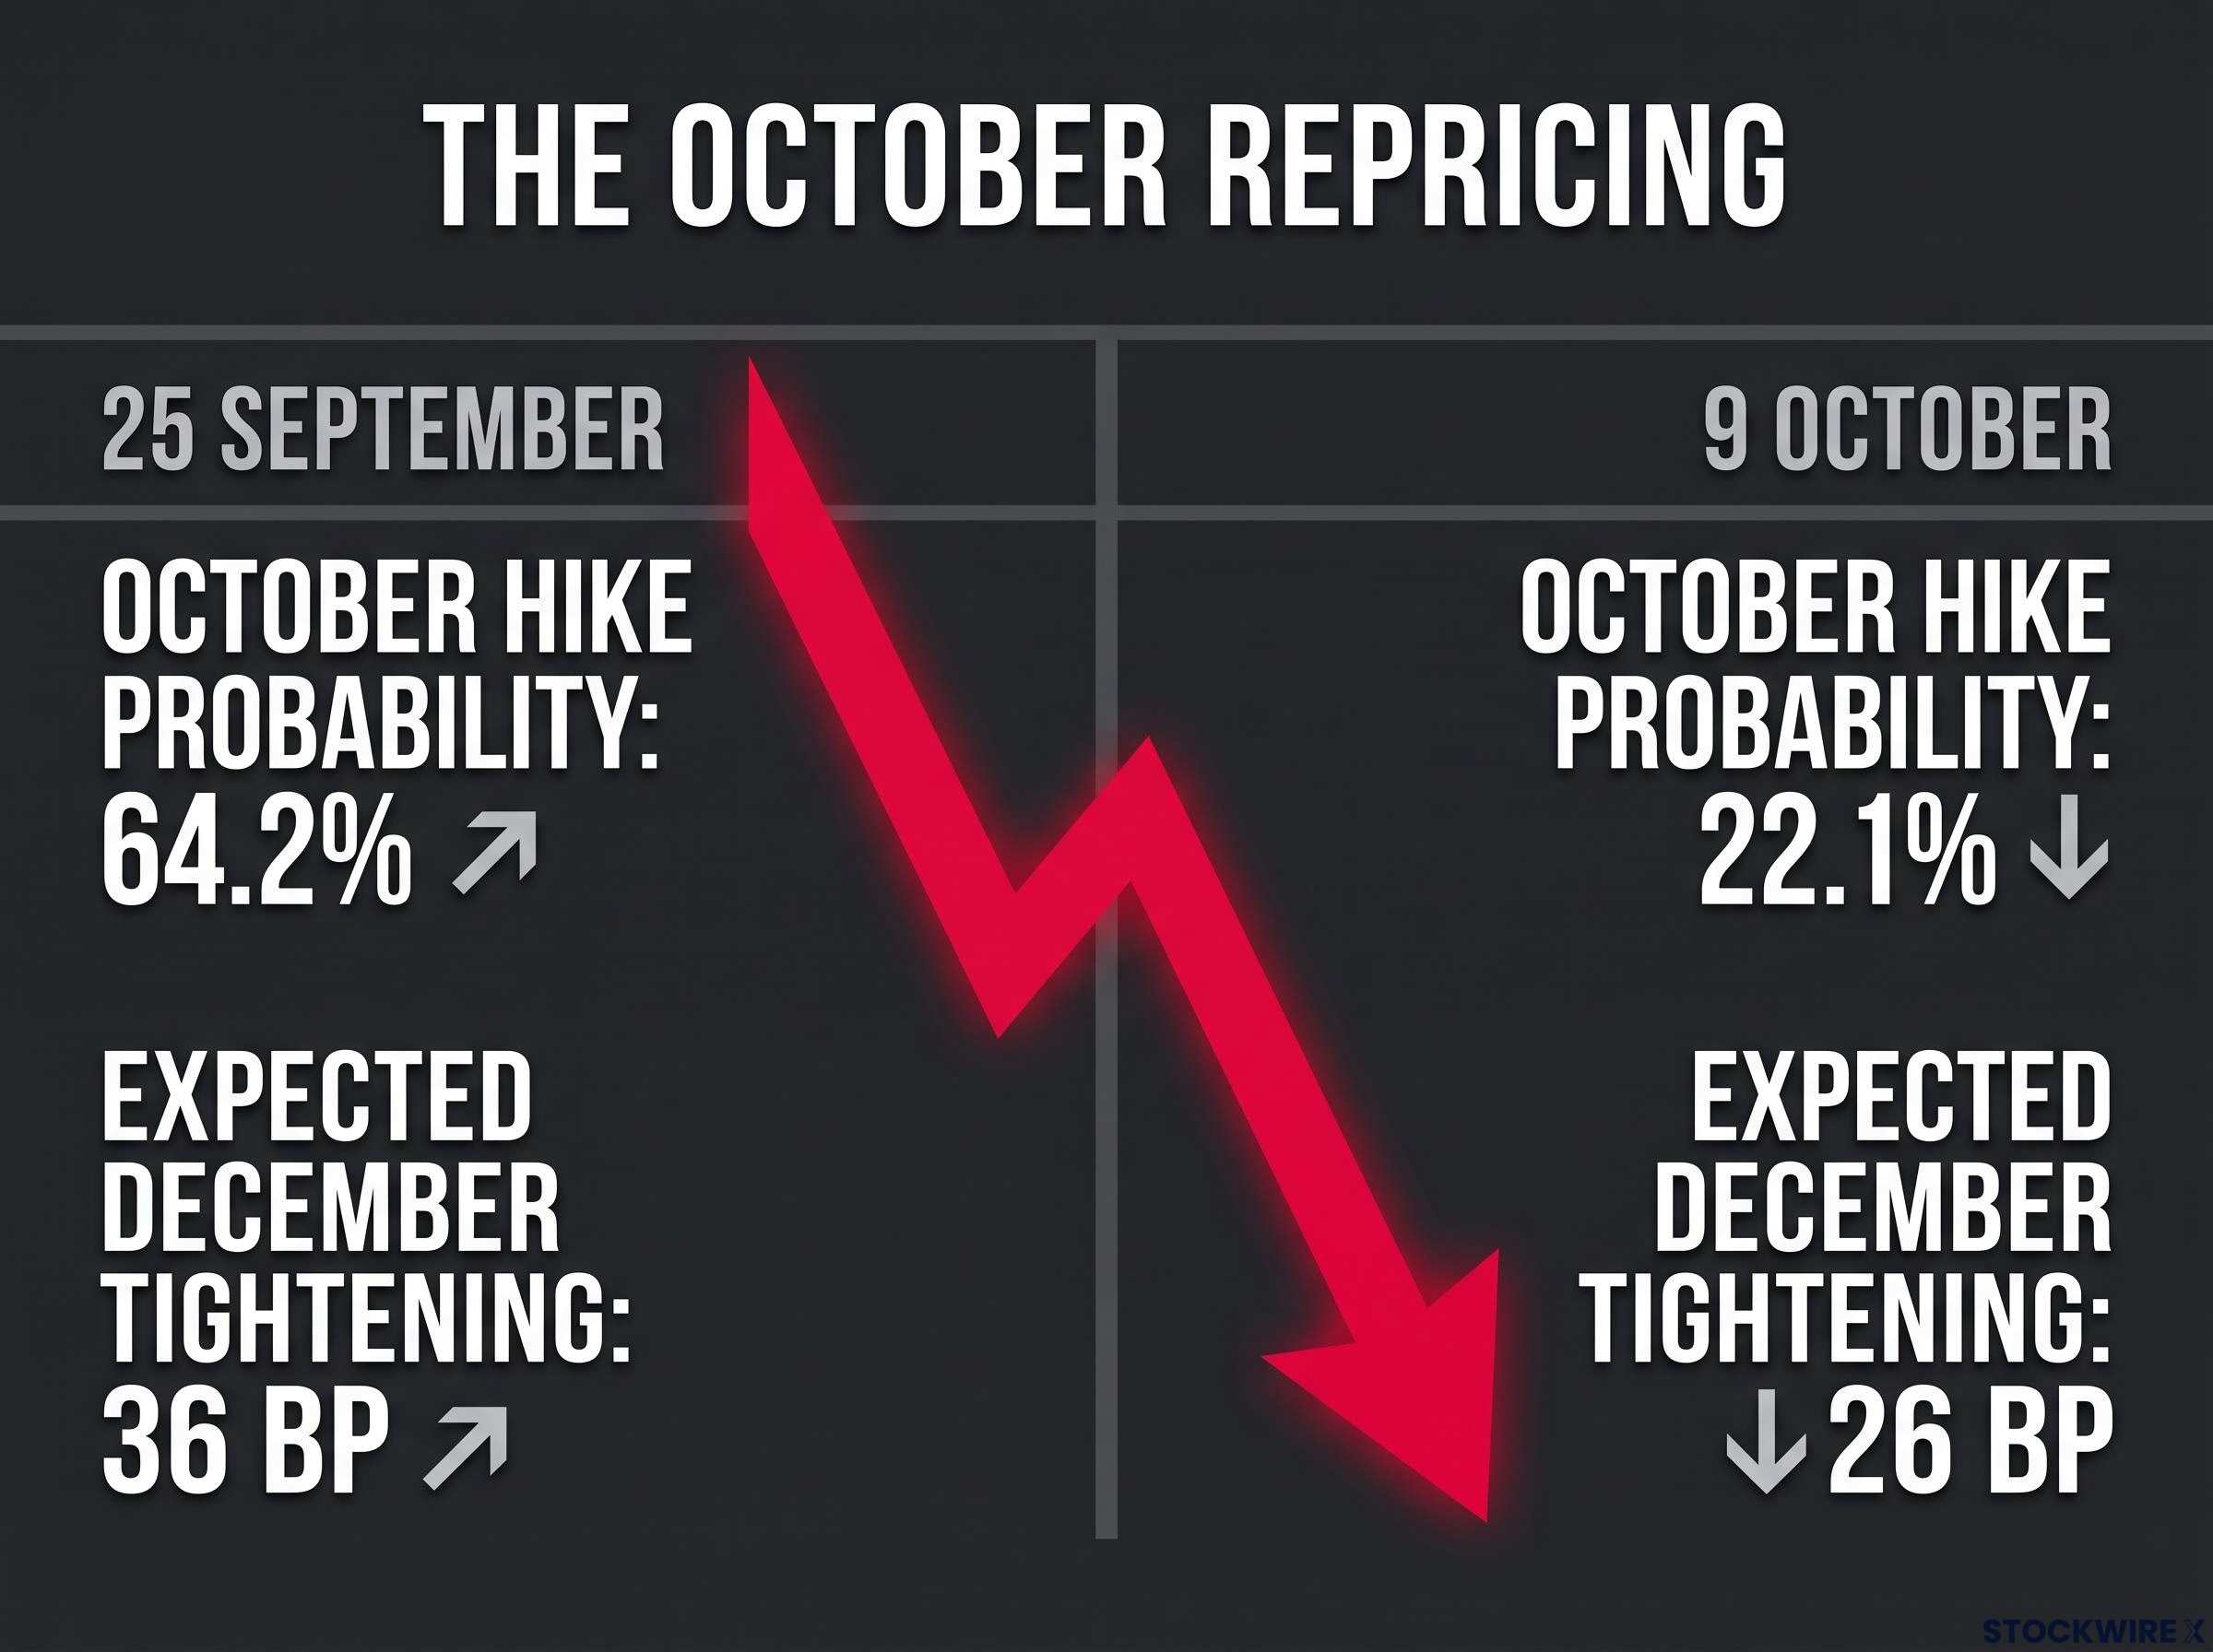
The risk of a sharp repricing is real. The probability of an October hike collapsed from 64.2% to 22.1% in just two weeks.
Here is a framework you can use this week: which line to read first in each release, which outcomes would unwind 2027 hike bets, and how stocks, bonds, oil and gold are likely to respond.
Why is oil rising while inflation expectations are not following?
The weekend delivered a run of supply shocks. Houthi forces struck Riyadh airport, tankers near the Strait of Hormuz came under attack again, and President Trump’s announced Russia-Ukraine energy ceasefire did little to calm markets. Ukraine was reportedly unaware of the deal. On 12 October, Brent’s November contract traded at $105.47, December at $97.94, and WTI at $92.82. The original source flags WTI highs above $101 as a possible upside target, not the current price.
Treasury breakevens tell a quieter story. A breakeven is the inflation rate implied by the yield gap between regular Treasuries and inflation-protected Treasuries. They sit at 2.90% for one year, 2.57% for two years and 2.41% for five years. The original source points out that breakevens usually move with crude, yet they lagged oil’s rebound in July as well.
Raw breakevens are not clean forecasts, since market-based inflation expectations embed liquidity and risk premia that can push them well away from actual inflation at shorter horizons, which is one reason their lag behind crude deserves careful reading.
The divergence has two plausible explanations, and both can hold at once.
The cyclical case: demand destruction
- Higher fuel and transport costs cut real income, so households spend less elsewhere.
- Breakevens contain real yields, liquidity and risk premia, not just expected inflation.
- A temporary pass-through to prices does not have to trigger a wage-price spiral.
The structural case: why inflation may still stick
- Tariffs push goods prices higher regardless of crude.
- Retiring baby boomers and the immigration crackdown tighten labour supply, keeping services inflation elevated.
- Deficit financing supports demand, and AI capital spending lifts demand for chips, electricity, construction and data centres.
Fed Governor Michael Barr summarised the second channel in remarks on 29 September.
Barr on inflation drivers Barr pointed to energy prices from the Middle East conflict and AI-related demand for high-tech goods and services as the forces keeping inflation elevated.
History shows how differently oil shocks can play out.
| Episode | Inflation expectations | Growth outcome |
|---|---|---|
| 1970s | Became persistent as wages and policy reinforced them | Prolonged inflation problem |
| 1990 Gulf War | No wage-price spiral | Oil spike followed by recession |
| 2008 | Fell sharply; breakevens diverged from spot crude | Demand and credit collapsed |
| 2022 | Rose, partly reversed after hikes | Tighter conditions cooled commodities |
When oil rises and inflation compensation does not, the bond market is pricing damage to demand. That means a strong headline CPI tells you less about 2027 than the core and expectations details do.
When big ASX news breaks, our subscribers know first
What are the September CPI, PPI and retail sales numbers actually testing?
Taken in the order they arrive, the releases point to one conclusion. The headline is expected to run hot, and the real test sits elsewhere.
Forecasts for headline CPI conflict. Franklin Templeton expects 0.6% month-on-month and 3.6% year-on-year. Admiral Markets expects roughly 0.5% and 3.7%, and the original source also cites 3.7%.
| Indicator | Forecast | Prior or comparison | What to watch |
|---|---|---|---|
| Headline CPI | 0.5%-0.6% m/m; 3.6%-3.7% y/y | Sources conflict | Gasoline share of the gain |
| Core CPI | 0.2% m/m; 2.4%-2.5% y/y | 0.3% m/m prior | Any print at 0.3% or above |
| PPI | Headline 0.4%-0.5%; core 0.2%-0.3% | Original source only | Pipeline pressure beyond energy |
| Retail sales | 0.3% m/m | 1.2% prior | Spending once oil distortion is removed |
Core CPI is the swing factor
Core CPI excludes food and energy, and it is expected to slow to 0.2% from 0.3%. MUFG argues that only an upside core surprise would revive serious October-hike pricing. Bloomberg Economics expects gasoline to lift the headline while underlying pressure moderates.
The prior report offers a useful template, since gasoline-driven headline gains in August masked a five-year low in core CPI, the same pattern analysts now expect September’s release to repeat.
The trend data leans the same way. According to the original source, three-month annualised PCE inflation (the Fed’s preferred measure) is already at 2%, and the Cleveland Fed nowcast points to lower core aside from the supply shock.
Reading PPI and retail sales through the oil lens
PPI tracks prices businesses receive, so it shows pressure building in the supply chain. No independent consensus was found, so treat the original source’s range with caution.
Retail sales are not adjusted for inflation. Last month’s 1.2% jump was largely pricier fuel, so a 0.3% gain may hide flatter real spending. If you see a hot headline with a soft core, the data is describing an energy story, not a reason to extend 2027 hike bets.
How weak is the consumer, and what is the growth scare really saying?
The retail sales caveat matters more once you look at how households say they feel.
What the Michigan survey is signalling
- Headline sentiment: 46.3, down from 48.1 and below the 47.6 expected
- Current conditions: 44.7, a record low
- Expectations index: 47.3
- One-year inflation expectations: 4.7%, the highest since May
- Five-year inflation expectations: 3.5%
Record low The current-conditions reading of 44.7 is the weakest in the survey’s history.
Since the pandemic, sentiment has moved inversely to one-year inflation expectations, and the relationship worsened after tariffs and the Iran war. Conference Board confidence sits at its lowest since 2014. Hiring has slowed, and the Atlanta Fed’s GDPNow estimate for third-quarter growth has eased to 3.6% (8 October), from 3.7% on 6 October and roughly 5% or more in late July and early August.
Households appear to feel the squeeze before the official data captures it. That means a soft retail sales or payrolls print should read to you as confirmation of a trend, not a one-off.
The growth picture is not one-sided, though. A 3.6% nowcast is still solid, and Barr has argued AI investment may keep supporting activity.
The AI and chip wobble as a second signal
Equities offered a cross-check. Weekend reports that China’s CXMT is developing rival server memory sent SK Hynix, Samsung and the Kospi sharply lower, dragging on the Nasdaq. CLSA initiated CXMT at outperform, projecting 14% global bit-ship share next year against 9% last year.
OpenAI added pressure. It was reportedly pacing near $50 billion in annualised revenue, below the $68-70 billion figure that had circulated, though the numbers likely reflect different definitions or reporting points. The shortfall hit AI stocks and lifted bonds.
The S&P 500 remains pinned below its mid-August highs, while weakness outside tech in July hinted at growth sensitivity masked by AI enthusiasm. Bitcoin held its level, so the mood was not uniformly risk-off. The sentiment slump and the equity wobble may share a root cause: AI capital spending supports GDP while doubts about how it gets monetised weigh on valuations.
Can the roughly 50 bp gap in 2027 hike pricing hold?
The Fed raised its target range to 3.75%-4.00% in September, and its median projection of 4.1% for end-2026 implies one more hike. CME FedWatch reporting shows an October hold at about 78%-83% and a December hike at roughly 70%-85%, depending on the date. Markets fully price a hike by April 2027 and nearly another by June.
The original source puts the gap with the Fed at about 50 bp, which was not independently confirmed. An FXStreet snapshot on 2 October showed three extra hikes by June 2027, to 4.50%-4.75%.
Three conditions for 2027 hikes to survive
- Core inflation stays sticky.
- Growth stays resilient, supported by AI, business and consumer spending.
- Inflation expectations stay high enough that the Fed does not dismiss oil as a one-off.
All three must hold together. The October repricing shows how quickly they can fail: hike odds fell from 64.2% (25 September) to 22.1% (9 October), and expected tightening by December shrank from about 36 bp to 26 bp. Goldman Sachs moved its call from October to December as jobs and market data weakened, and Reuters has described the Fed as caught between weak hiring and elevated energy costs.
Treat 2027 pricing, not the October meeting, as the most exposed part of the curve if a soft print arrives.
For readers wanting to judge which rate signal deserves more weight, our dedicated guide to the Fed dot plot versus market pricing explains why the median dot can hide a split committee.
A scenario map for the prints
| Scenario | Core CPI outcome | Rates and 2027 pricing | Equities and commodities |
|---|---|---|---|
| Hot | Above 0.2% | Yields rise; 2027 hikes firm, October odds revive | Stocks and bonds pressured together; gold capped |
| In line | Around 0.2% | December stays in play; 2027 drifts | Focus shifts to oil and retail sales |
| Soft | Below 0.2% | 2027 hike bets unwind fastest | Bonds rally; gold may bottom; crude reads as growth risk |
A split response is also possible. Short-dated inflation compensation could rise while long breakevens and real yields fall. Bonds have attempted a turn, with lower price lows and positive momentum divergence, although long-end yields also reflect deficit financing and hyperscaler competition for loanable funds. Fed Chair Warsh’s fireside chat with the IMF managing director adds a second event risk.
These scenarios are speculative and subject to change as market conditions develop. Past performance does not guarantee future results.
Reading the week without overreacting to the headline
Headline CPI will likely be noisy from energy. The signal sits in core inflation and expectations, while weakness in sentiment and spending is what could unwind 2027 hike bets. Three variables deserve your attention:
- Core CPI month-on-month against 0.2%
- Retail sales after stripping out the oil distortion
- How fast breakevens and Treasuries move after each print
Conflicting headline forecasts and an unconfirmed 50 bp gap are reasons to think in scenarios rather than certainties. Your view should shift on a core surprise or a spending miss, not on a gasoline-driven headline.
This article is for informational purposes only and should not be considered financial advice. Investors should conduct their own research and consult with financial professionals before making investment decisions.