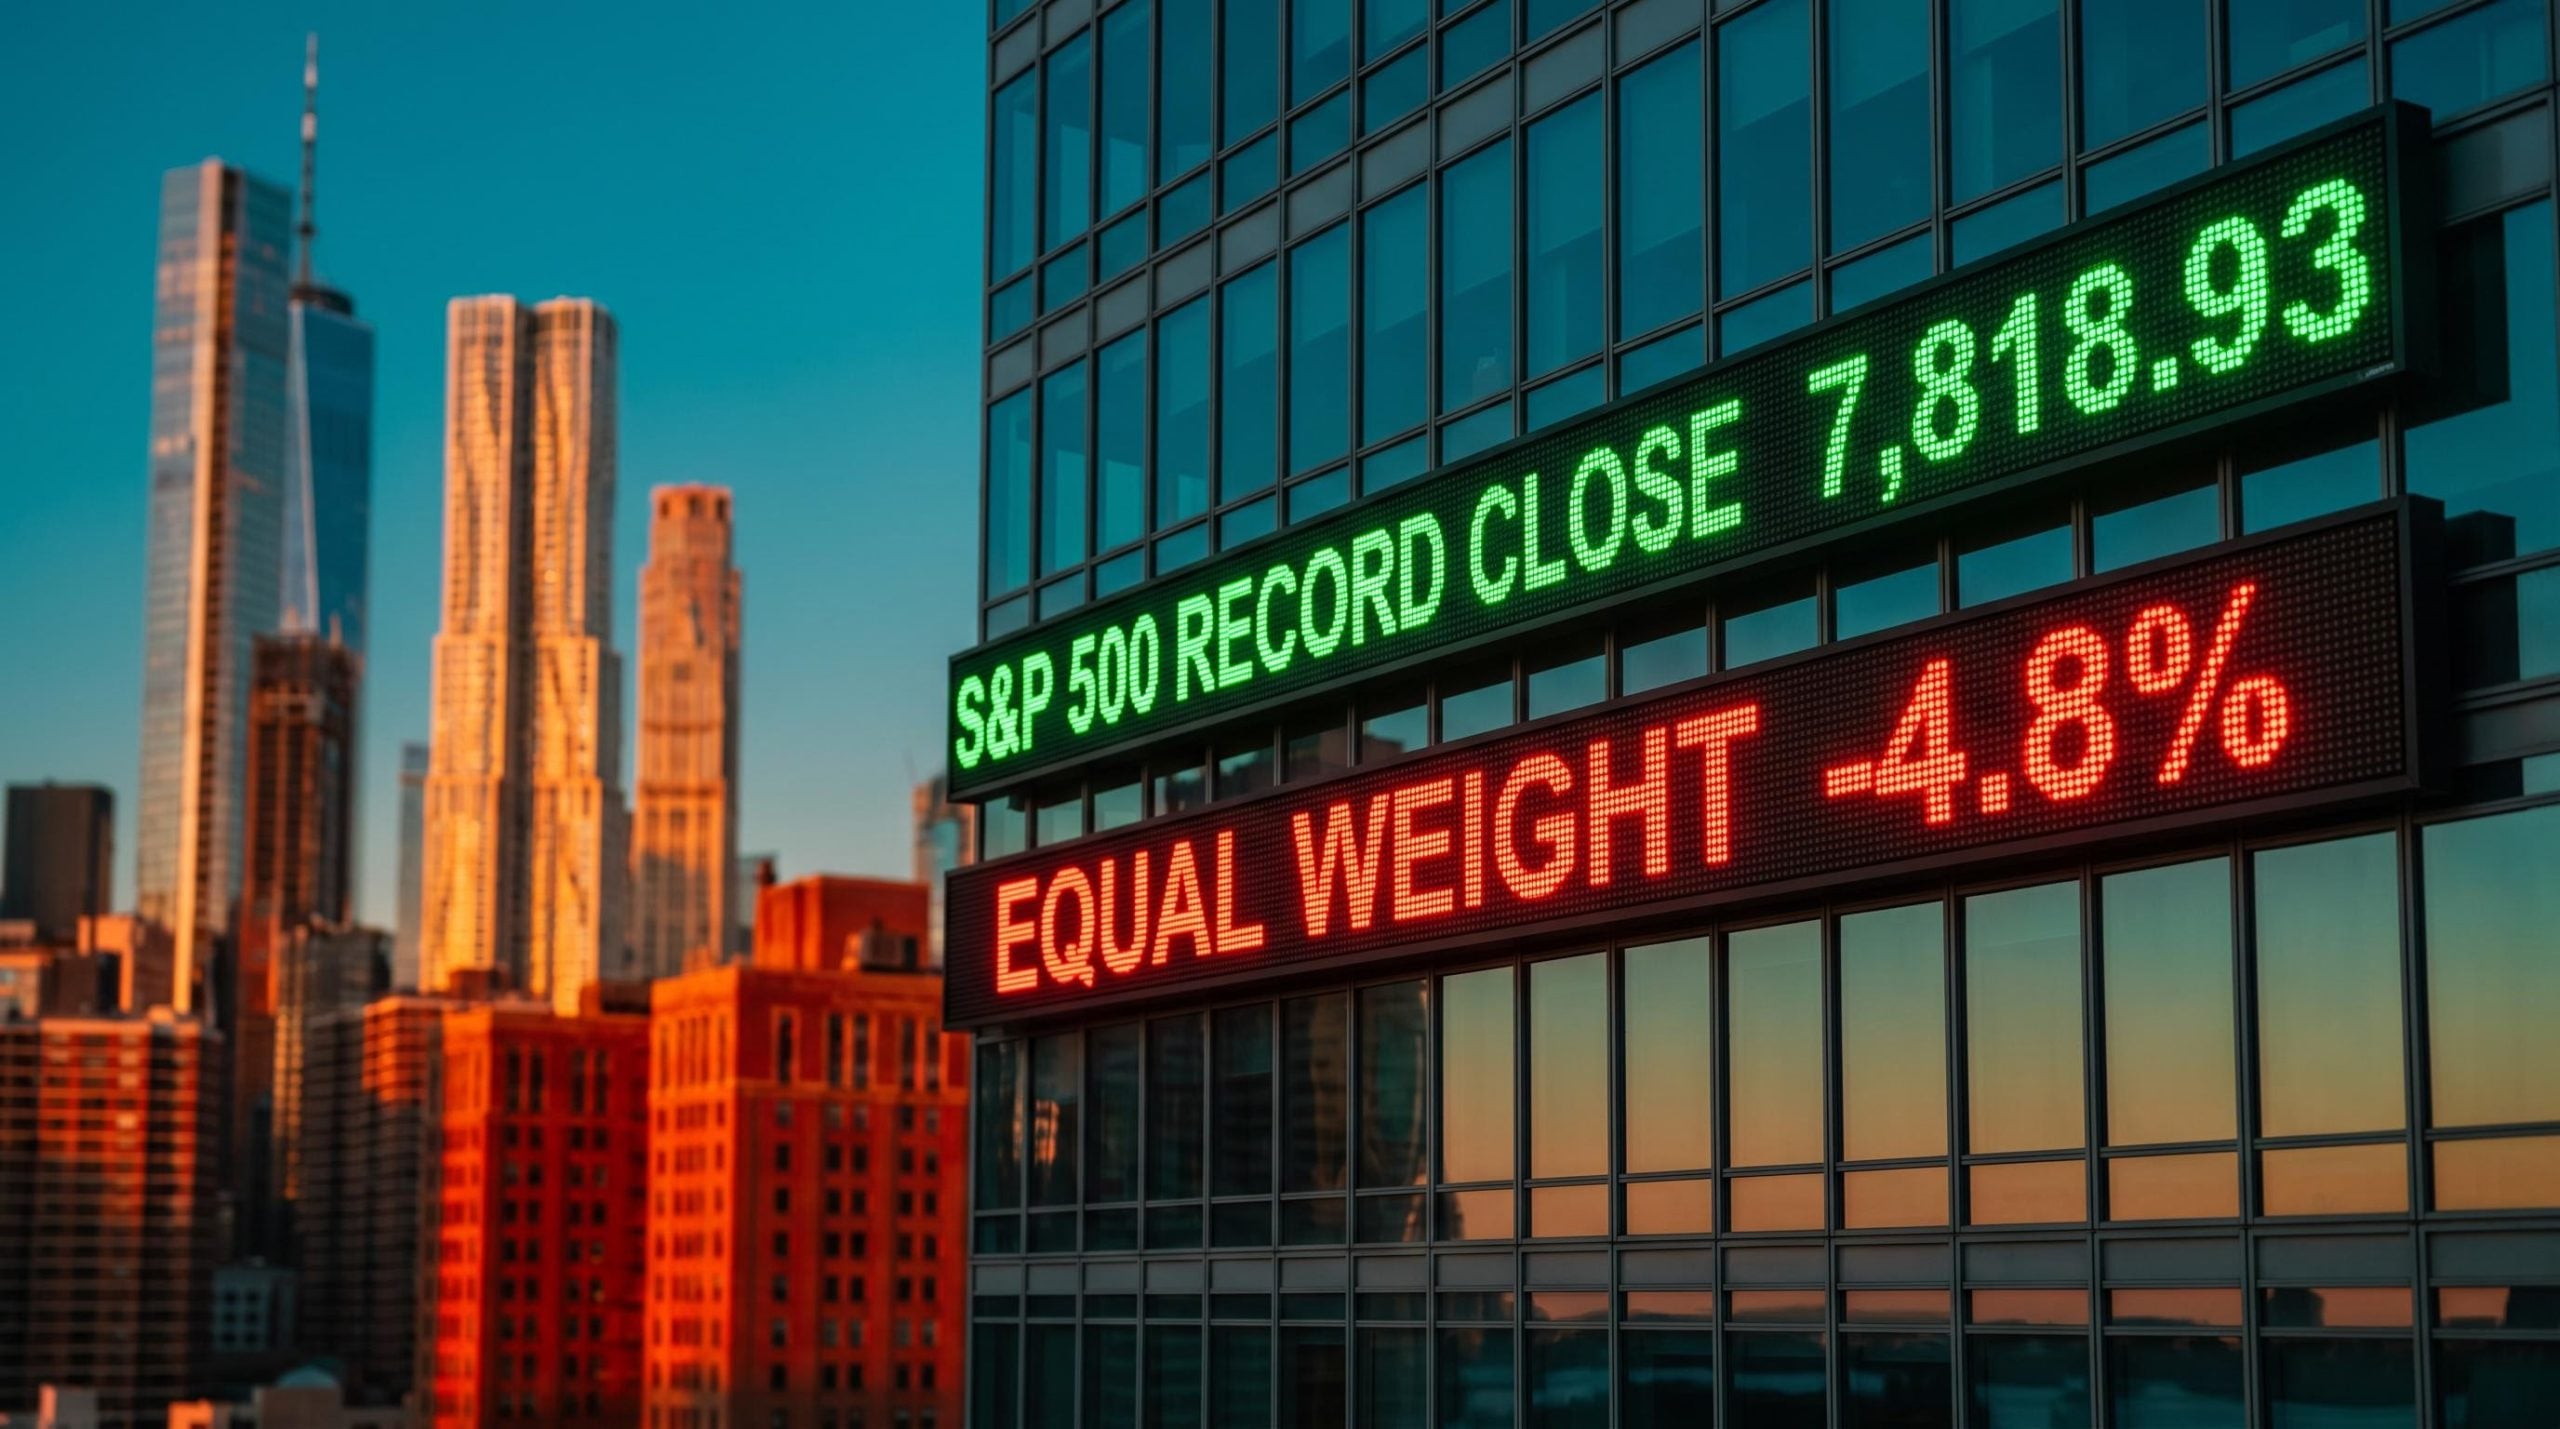
The S&P 500 closed at a record 7,818.93 on 6 October 2026, touching 7,844.52 intraday. That headline hides a weaker market underneath: the equal-weight version of the index fell 4.8% in September while the cap-weighted index slipped just 0.3%, and that gap sits at the centre of the case for bearish market positioning.
The timing makes the gap matter. September inflation data lands on 14 October, the Federal Reserve decides on rates on 28 October, and the midterm elections follow on 3 November. Three catalysts in three weeks leave little room for a misread market.
One independent trader, whose session commentary forms the basis of this analysis, reads the divergence as a warning and has built a book of short positions around it. His claims are his own. They are tested here against verified data and the institutional views that point the other way.
You will see which signals support a defensive stance, which argue against it, and how short exposure is actually risk-managed when momentum turns.
Why are record index highs hiding weakness underneath?
A record close sounds like broad strength. It is really a statement about the largest companies, because a cap-weighted index gives the biggest stocks the biggest say.
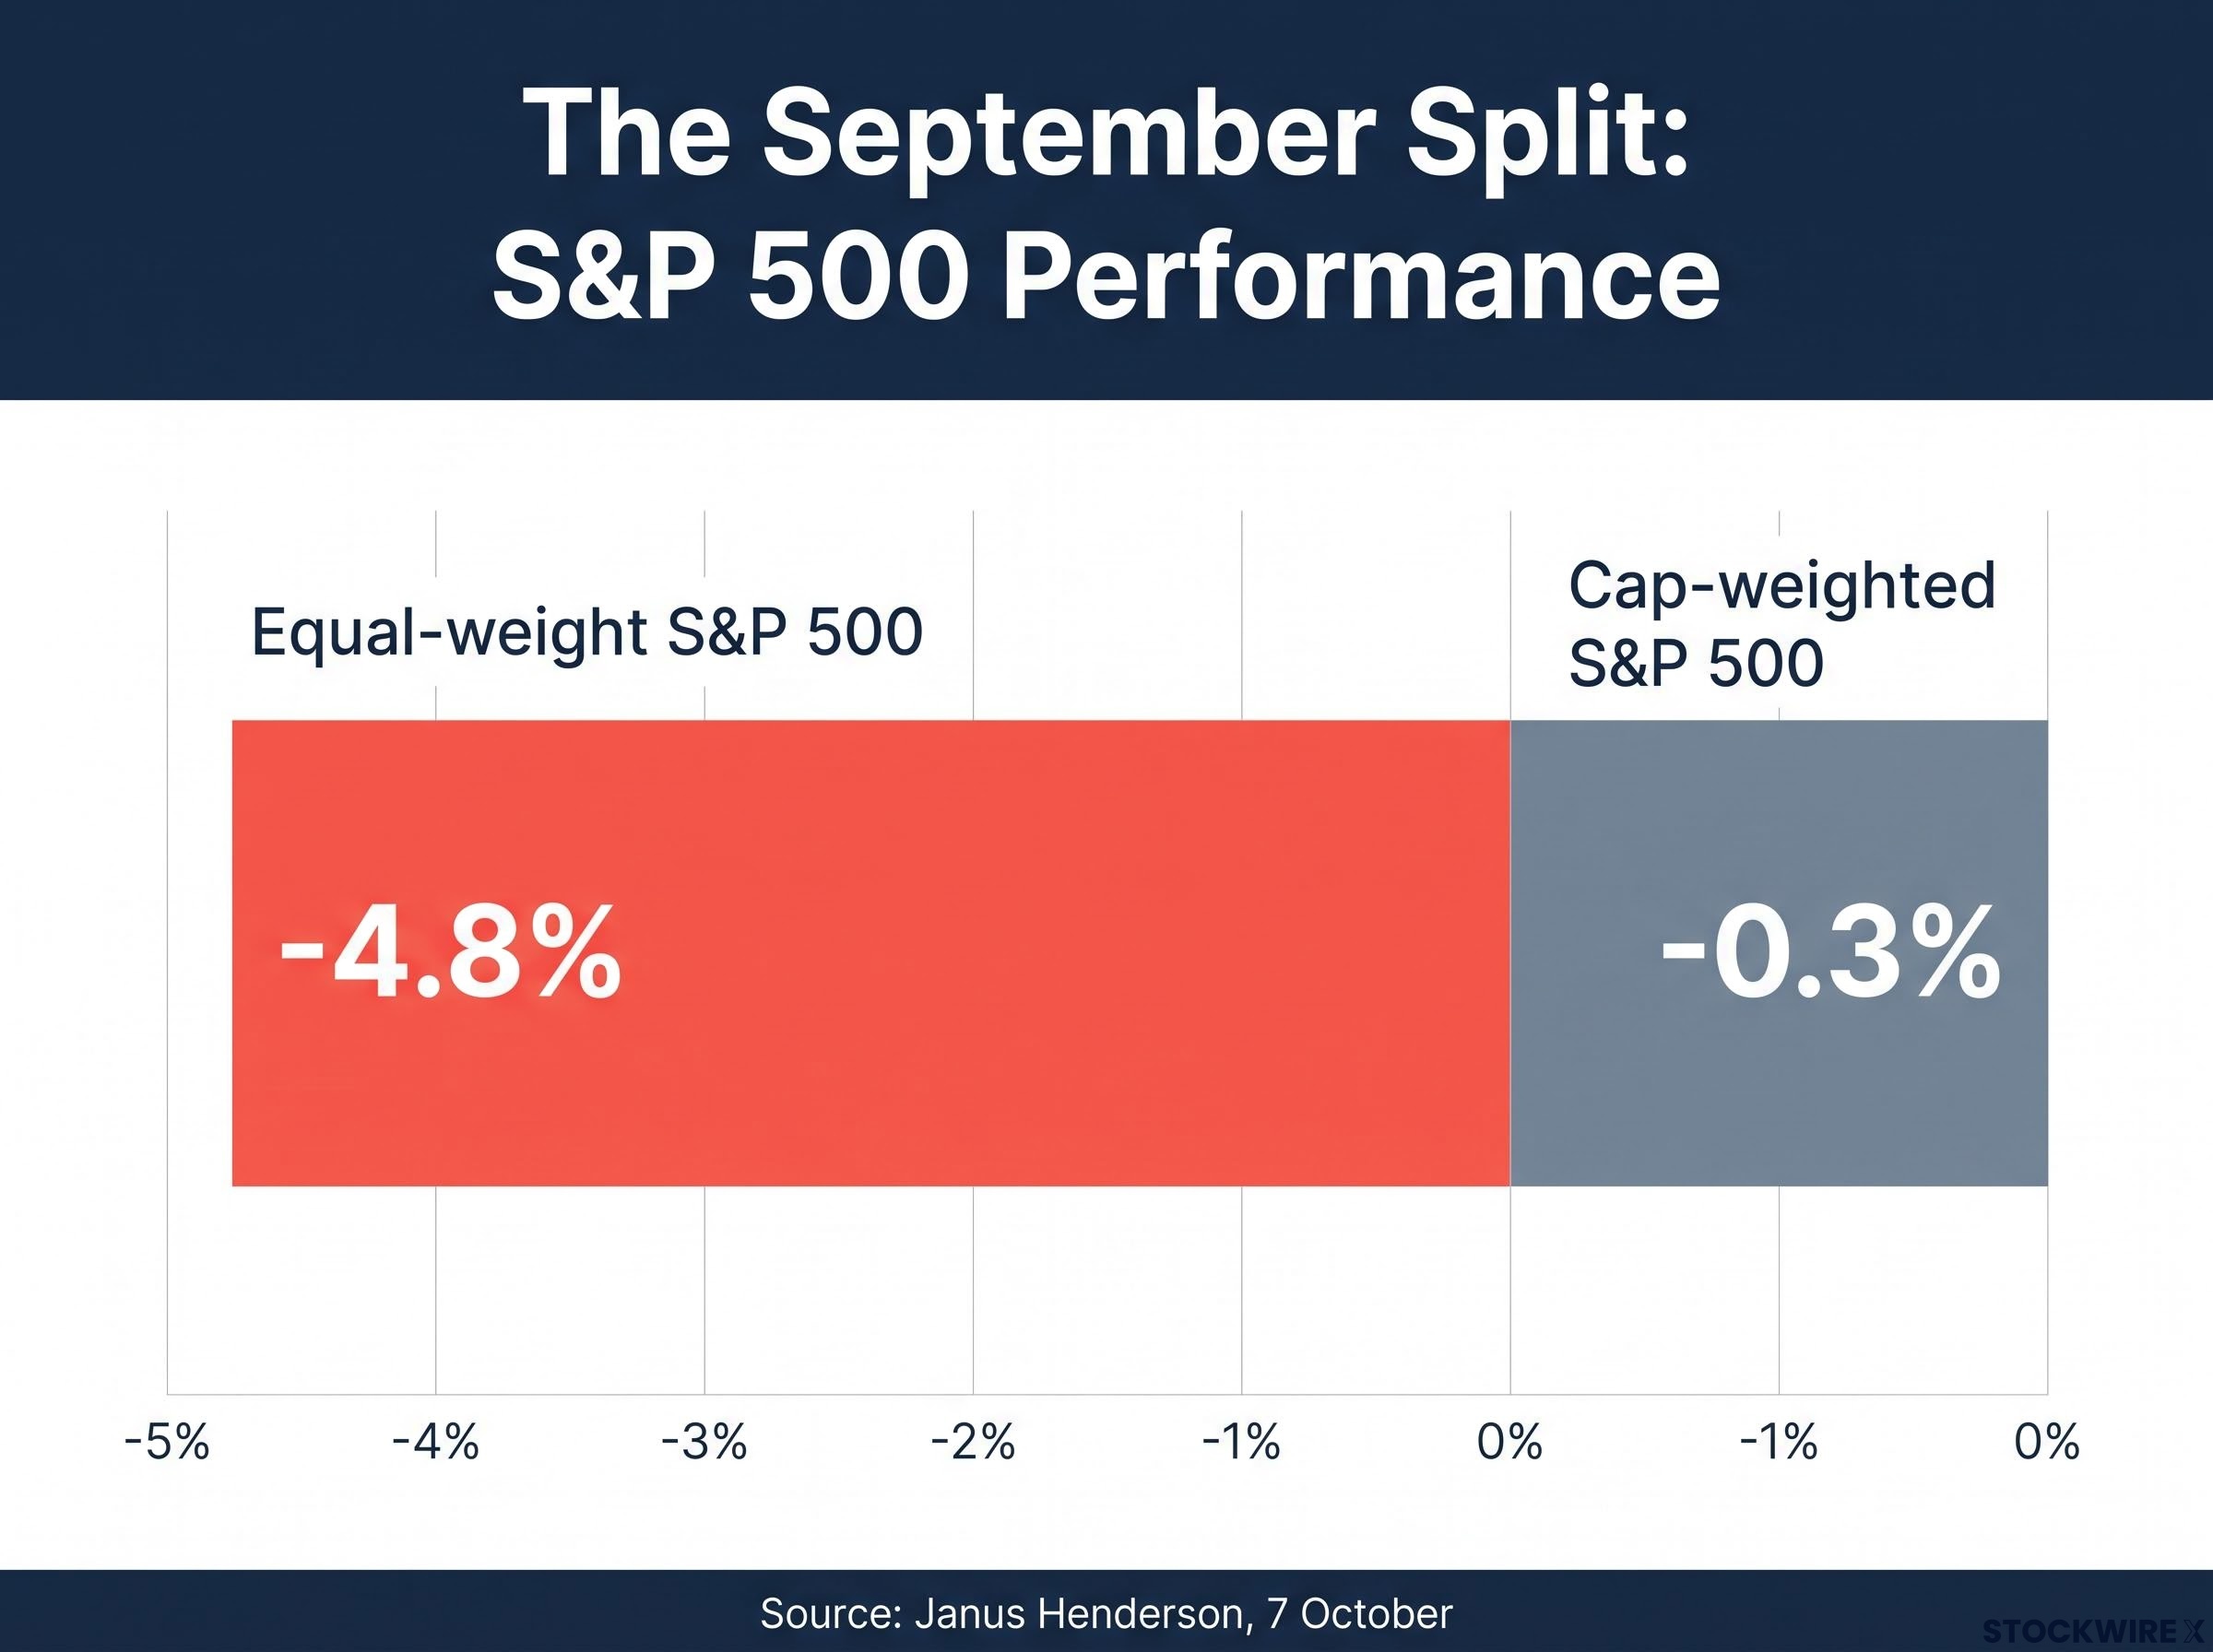
The equal-weight index removes that bias by giving every company the same weighting. Its September performance tells a different story.
The September split Equal-weight S&P 500: down 4.8%. Cap-weighted S&P 500: down 0.3%. Source: Janus Henderson, reported 7 October.
Janus Henderson used the comparison to show how heavily a handful of mega-cap technology and AI names carry the headline number. Charles Schwab’s 9 October technical outlook went further, pairing record indexes with negative momentum divergences (prices rising while the strength behind the moves fades) and rising new lows. Schwab called the combination a “stealth correction”, while conceding that some shorter-term breadth measures had improved.
Mega-cap concentration has reached levels above the 1930s peak, with five stocks controlling roughly 23% of the broad US market index, so a record close says little about the average holding.
The constructive reading has evidence too. The 9 October market report showed nine of eleven sectors higher even as semiconductors stayed weak. Schwab’s Kevin Gordon has reportedly described the market as rotational rather than correctional, with about two-thirds of S&P 500 companies above their 200-day averages, although that figure is lightly sourced. The trader himself sees money leaving memory and chip stocks for industrials such as Caterpillar, lifting the Dow.
| Reading | Evidence cited | Who holds it |
|---|---|---|
| Stealth correction | Record index, momentum divergences, rising new lows, equal-weight down 4.8% | Schwab technical outlook; the trader |
| Rotation, not correction | Nine of eleven sectors higher; about two-thirds of stocks above 200-day averages | Kevin Gordon, Schwab (reported); 9 October market report |
Both readings fit the facts, which is the point. A record index tells you the largest stocks are holding up, not that your holdings are, so check how much of your portfolio sits outside mega-cap tech.
When big ASX news breaks, our subscribers know first
Where is the pressure concentrated: chips, quantum, Korea and crypto?
If the index is masking weakness, the weakness has to be somewhere. It is clustering in the market’s most speculative recent winners.
Semiconductors and Cerebras
The iShares Semiconductor ETF (SOXX) fell about 3.35% on 8 October, closing at 563.28. The trader reports a separate session with SOXX down about 2.75% and SMH down 2.2%, so the figures describe different days rather than conflicting ones.
The semiconductor cycle adds a structural layer to this weakness, since locked-in capital budgets at TSMC and Samsung point to a supply wave in 2027-2029, with memory the most exposed segment.
Cerebras shows how quickly expectations can deflate. It listed in May at $185, closed its first day at $311.07, then closed at $166.43 on 2 October, a post-IPO low that CNBC partly tied to the expiry of the lock-up (the period in which insiders are barred from selling shares).
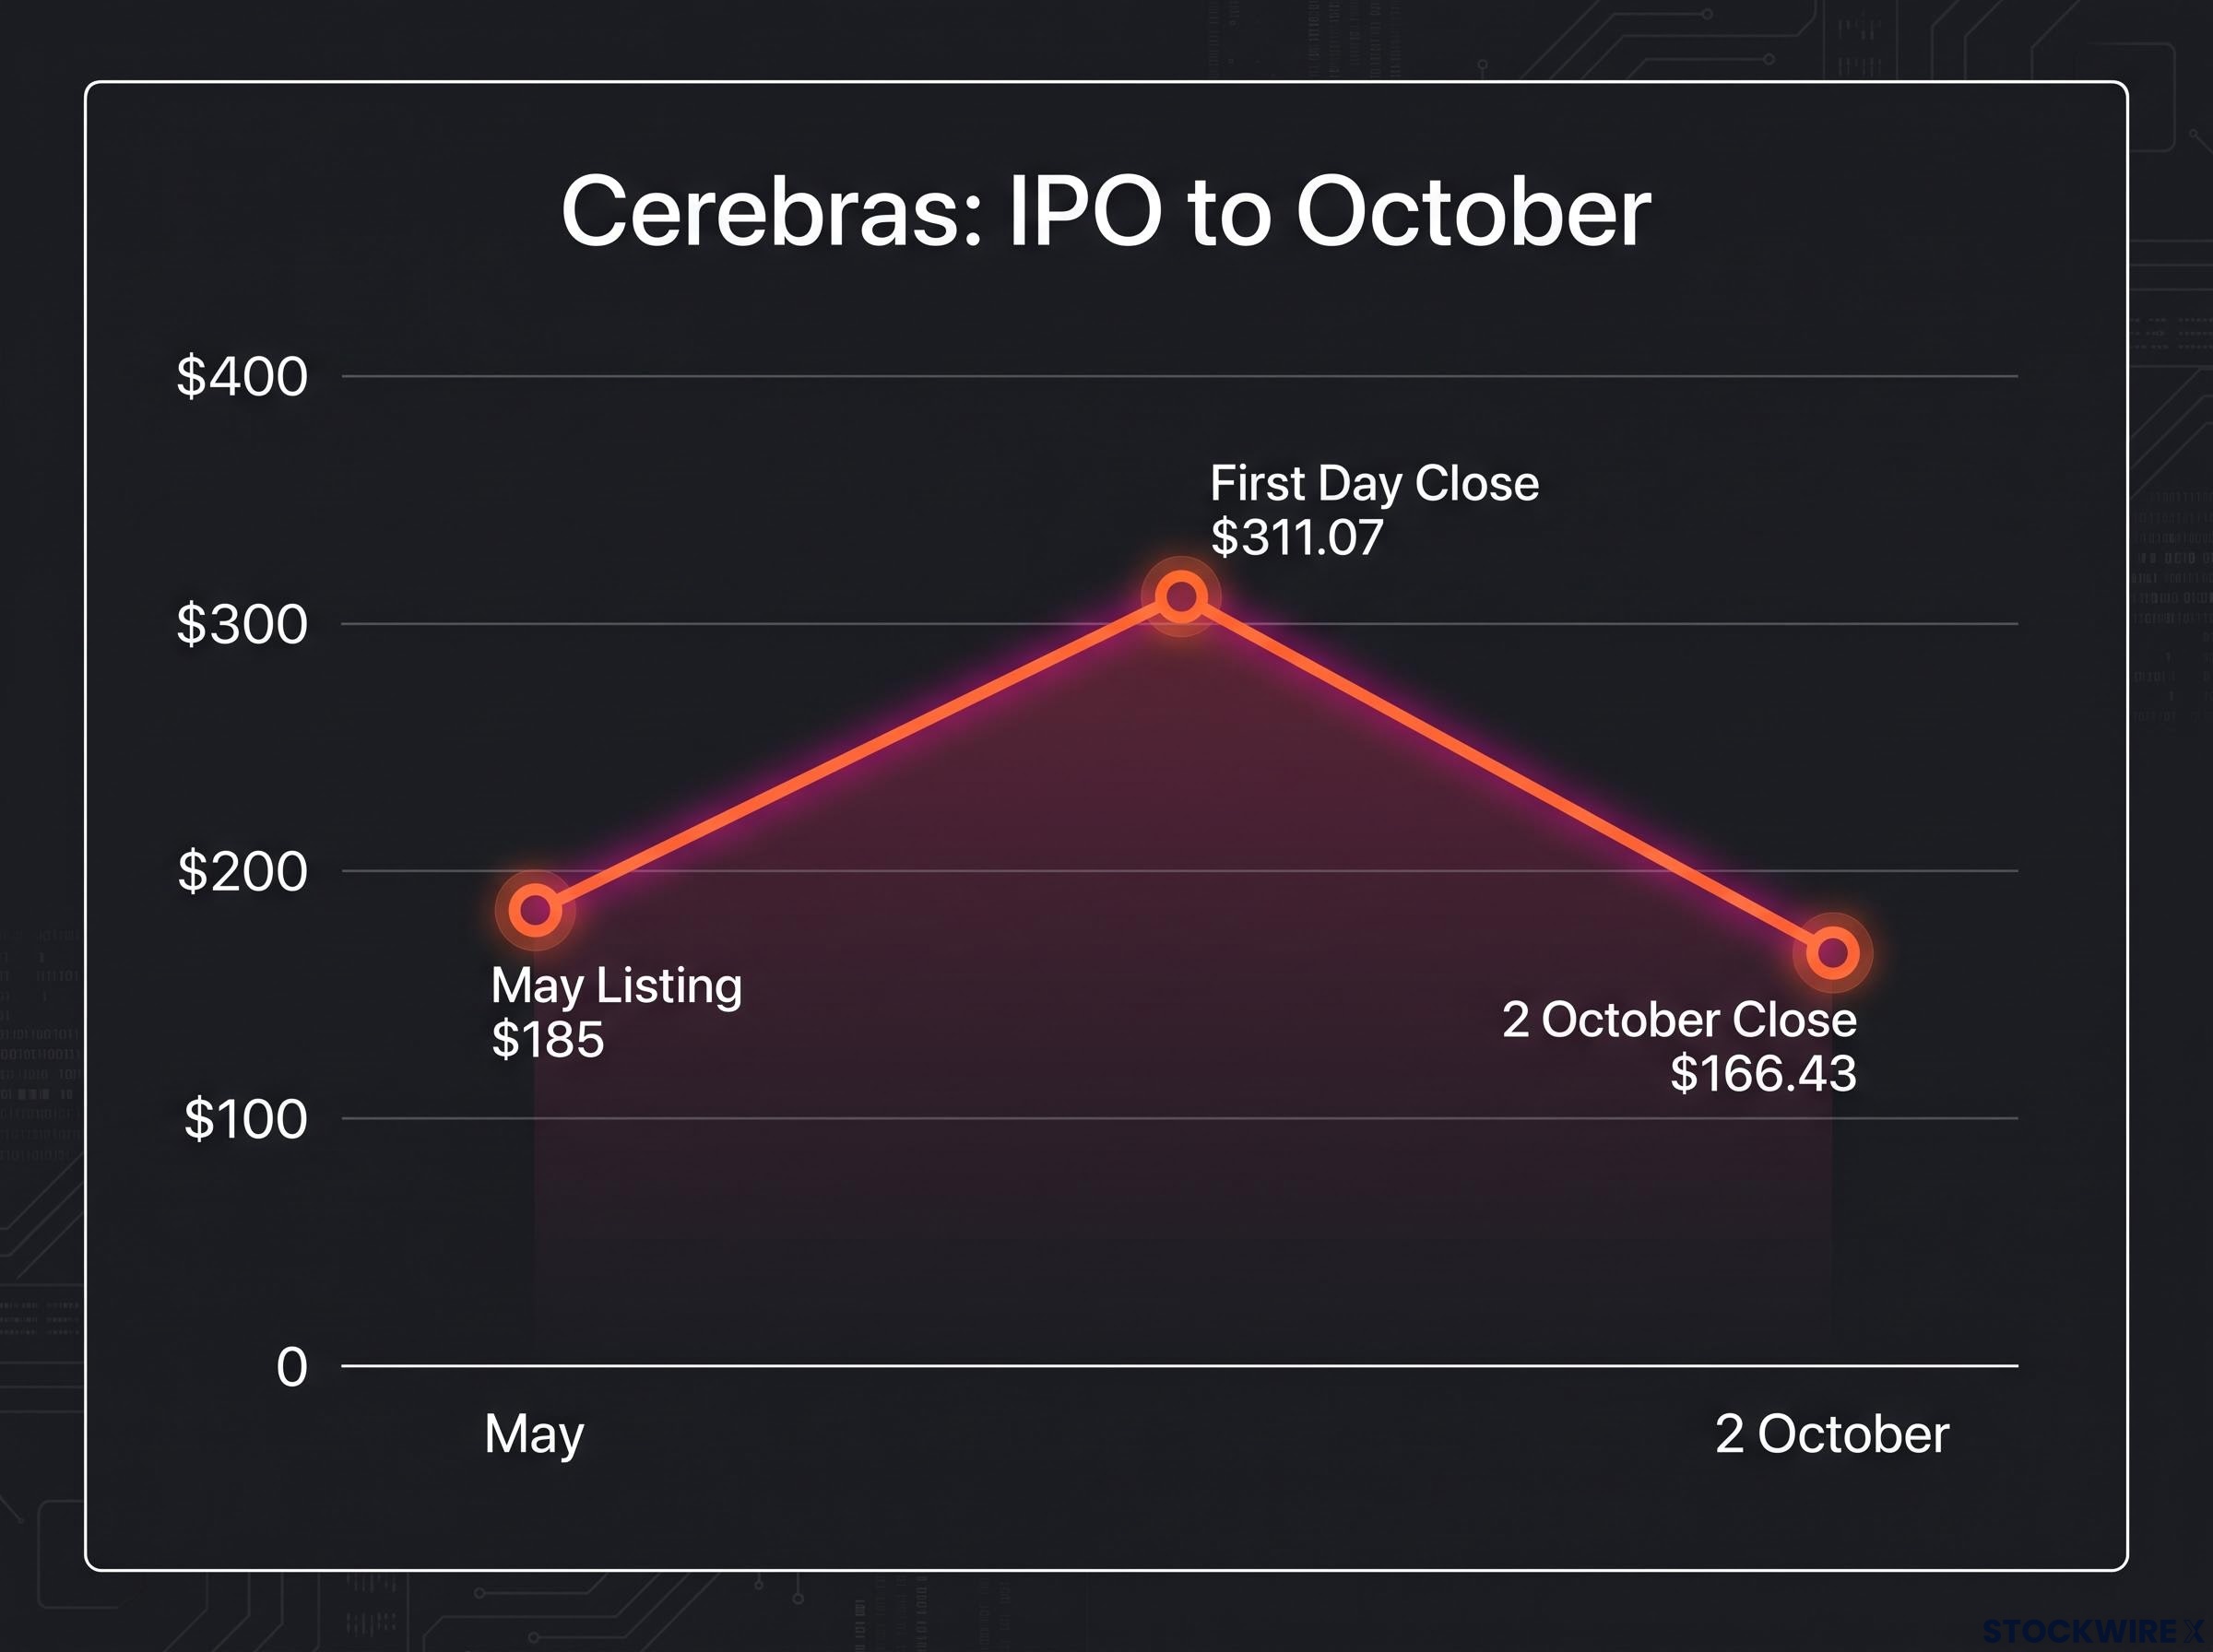
Sources differ on the extremes. The trader cites a peak near $400, probably intraday, and a recent price of about $147. Analyst consensus remains Moderate Buy with average targets of about $292-$300, a gap he attributes to employer incentives, which is his opinion and not a verified claim.
Quantum, Korea and crypto-linked names
IonQ fell 9.07% to $36.27 today, and D-Wave Quantum dropped 5.70% to $13.74, leaving it down about 45% year to date according to MarketBeat. The trader mentions weekend reports of federal quantum funding; the research found nothing to corroborate them.
In Korea, Samsung closed lower on 8 October despite a record profit forecast, Reuters reported. The trader cites EWY down about 4% and the triple-leveraged KORU down more than 12%, unwinding the retail speculation that peaked in June.
Bitcoin sat near $83,500 on 7 October, gold near $4,070 and silver below $60. The trader holds only physical metal and would reconsider below roughly $3,500 gold.
| Name or theme | Recent move | Date | Source type |
|---|---|---|---|
| SOXX | Down about 3.35% to 563.28 | 8 October | Market data |
| Cerebras | $166.43, below $185 IPO price | 2 October | CNBC |
| IonQ | Down 9.07% to $36.27 | 12 October | Market data |
| D-Wave | Down 5.70% to $13.74 | 12 October | Market data |
| KORU | Down more than 12% | Trader’s session | Trader’s account |
| Bitcoin | Near $83,500 | 7 October | CoinDesk |
When the riskiest corners fall together while the index holds, appetite for risk is being withdrawn selectively. That is an early signal worth tracking, not yet proof of a broad downturn.
How do sector rotation, breadth divergence and island reversals actually work?
Each of these signals has a recognisable shape on a chart. Knowing the mechanics behind them tells you when to trust them.
Sector rotation is money moving from one group of industries to another, as with chips into industrials. Breadth divergence occurs when an index rises while fewer of its members participate, which is exactly the equal-weight versus cap-weight gap above.
Reading an island reversal
An island reversal forms when prices gap up (open well above the prior close), trade in an isolated cluster, then gap down. The cluster looks like an island cut off on both sides, and it can mark buyer exhaustion.
The trader posted an island reversal on the Invesco QQQ chart last Wednesday and drew heavy bullish pushback. QQQ fell about 0.8% in his session, and he wants it to push deeper into his target zone.
One pattern is not a verdict An island reversal can signal exhaustion, but it is not conclusive on its own and needs follow-through to confirm.
What would confirm the signal, and what would weaken it:
- QQQ breaks below the island’s lower boundary (strengthens).
- Semiconductor weakness broadens beyond the leaders (strengthens).
- Credit conditions deteriorate (strengthens).
- The equal-weight index keeps underperforming (strengthens).
- Leadership broadens, the election clears uncertainty, and the Fed holds (weakens).
What 2000 and 2022 do and do not tell us
In 2000, narrow leadership met earnings disappointments and tighter financial conditions, and the result was a prolonged bear market. In 2021-2022, rate-driven multiple compression (investors paying less for each dollar of earnings) spread from speculative growth to the broader market.
The same type of divergence is visible now, but it is not proof of a repeat. Treat the chart pattern as a hypothesis that prompts you to define what would confirm or cancel the view, not as a forecast.
What do the next three weeks and the election really change?
The calendar is tight, and each date tests the bearish case differently.
| Date | Event | What to watch |
|---|---|---|
| 14 October, 8:30 a.m. ET | September CPI | Consensus about 0.6% m/m and 3.6% y/y headline; core about 0.2% m/m and 2.5% y/y |
| 28 October | FOMC decision | CME FedWatch prices about an 80-81% chance of a hold |
| 3 November | Midterm elections | Volatility and policy direction |
One preview puts headline inflation at 3.7%, so a hot print could test the hold expectation. The trader argues that official supports, including bond buybacks and yen intervention, fade after 3 November. Japan and the US did reportedly coordinate yen-buying on 10 October, the first joint action since 2011 according to the Economic Times citing Reuters, but the research found no specific new Treasury buyback measure.
Institutions split sharply on what comes next:
- Morgan Stanley: seasonality turns more supportive from October, with limited legislative change expected.
- BNY: volatility tends to rise about a month before midterms, and equities have historically rebounded afterwards.
- Nomura’s Charlie McElligott: the VIX has fallen about 4% on average once results remove uncertainty.
- Reuters: the usual positive Q4 backdrop is threatened by yields, AI spending dependence, the Fed and the election.
- JPMorgan: expects higher volatility into the midterms.
With credible voices pointing in opposite directions, avoid treating any single forecast, including the bearish one, as your base case. Past seasonal patterns do not guarantee future results, and these projections remain subject to market conditions.
In midterm election years since 1950, the S&P 500 has averaged a 14.5% gain from late August through March, though 1978, 2002 and 2018 broke the pattern on macro shocks rather than politics.
How is a short position protected when momentum can turn violently?
A bearish view is only as good as its exit plan. Short positions can lose more than their starting value, because a stock has no ceiling.
Where stops go and why
The trader anchors stops to price gaps and daily highs, tightening them as trades move his way, across 33 positions. His IWM short has a stop at a price gap; his FXI stop sits above Friday’s high. He added to a semiconductor short after a new gap anchored to Friday’s low and is tightening his KORU stop.
His reported shorts, including Corning, Credo, Oracle, Planet Labs and Seagate, illustrate the method only. They are not recommendations.
Risks that stops cannot solve
The gap problem Stops do not guarantee execution at the stop price in a gap.
- Short squezes: crowded shorts rushing to cover can lift weak stocks, so size smaller in heavily shorted names.
- Event gaps: news such as IonQ’s roughly $1.8 billion SkyWater deal can jump past a stop overnight, so assume the worst fill.
- Leveraged-ETF decay: daily resets erode value in choppy markets, so expect leveraged funds to drift from the path of your thesis.
- Stop placement: too tight invites false triggers, too loose invites large losses, so set the stop before entering.
- Borrow costs: fees can rise and shares can be recalled under pressure, so check borrow terms regularly.
- Narrow markets lasting: indexes can keep rising while most stocks weaken, so allow for being early.
- Management load: dozens of positions need constant attention, so keep the book to a size you can monitor.
Truist Wealth cites oversold conditions and a historically supportive Q4 as reasons the setup could improve. A stop limits the loss you plan for, not the loss you can get, so size each short for the gap scenario rather than the stop price. This is educational analysis, not trade advice.
Investors exploring how to size shorts will find our dedicated guide to short setups, stop placement and position sizing explains why size should come from ATR and maximum loss.
What this positioning gets right, and what would prove it wrong
The divergence is real and documented. Whether it resolves as a correction or a rotation is still open, and the post-election thesis remains one trader’s view set against institutional seasonality arguments.
Four markers will settle much of the debate:
- QQQ’s behaviour at the island’s lower boundary
- Semiconductor breadth beyond the largest names
- Equal-weight versus cap-weighted performance
- The 14 October CPI print and the 28 October Fed decision
If those break lower together, a defensive stance gains weight. If leadership broadens and the Fed holds steady, the bearish case loses its footing, and your positioning should reflect whichever evidence arrives, not the forecast you prefer.
This article is for informational purposes only and should not be considered financial advice. Investors should conduct their own research and consult with financial professionals before making investment decisions. These statements are speculative and subject to change based on market developments and company performance.