USD/JPY is trading around 158.35, and a 363 bp carry keeps pulling it towards 160. The catalyst many expected to halt that drift, an imminent Bank of Japan (BoJ) hike, has faded to roughly 12% odds for October. If you read the weak yen as a reaction to one bad data print, you may be missing the real signal: a gap in how fast the two central banks are moving.
The Federal Open Market Committee (FOMC) Minutes land today, and the BoJ meets on 30 October. Over the next few weeks, both the hawkish Fed narrative and the cautious BoJ narrative face a direct test.
Japanese authorities have also defended the 160 area repeatedly, which makes the zone just above current levels one of the most contested in currency markets.
This analysis sets out the levels, events and scenarios that matter most for the USD/JPY outlook from here, so you can judge whether the next move towards 160 is likely to extend or reverse.
Why the BoJ’s caution is keeping the yen under pressure
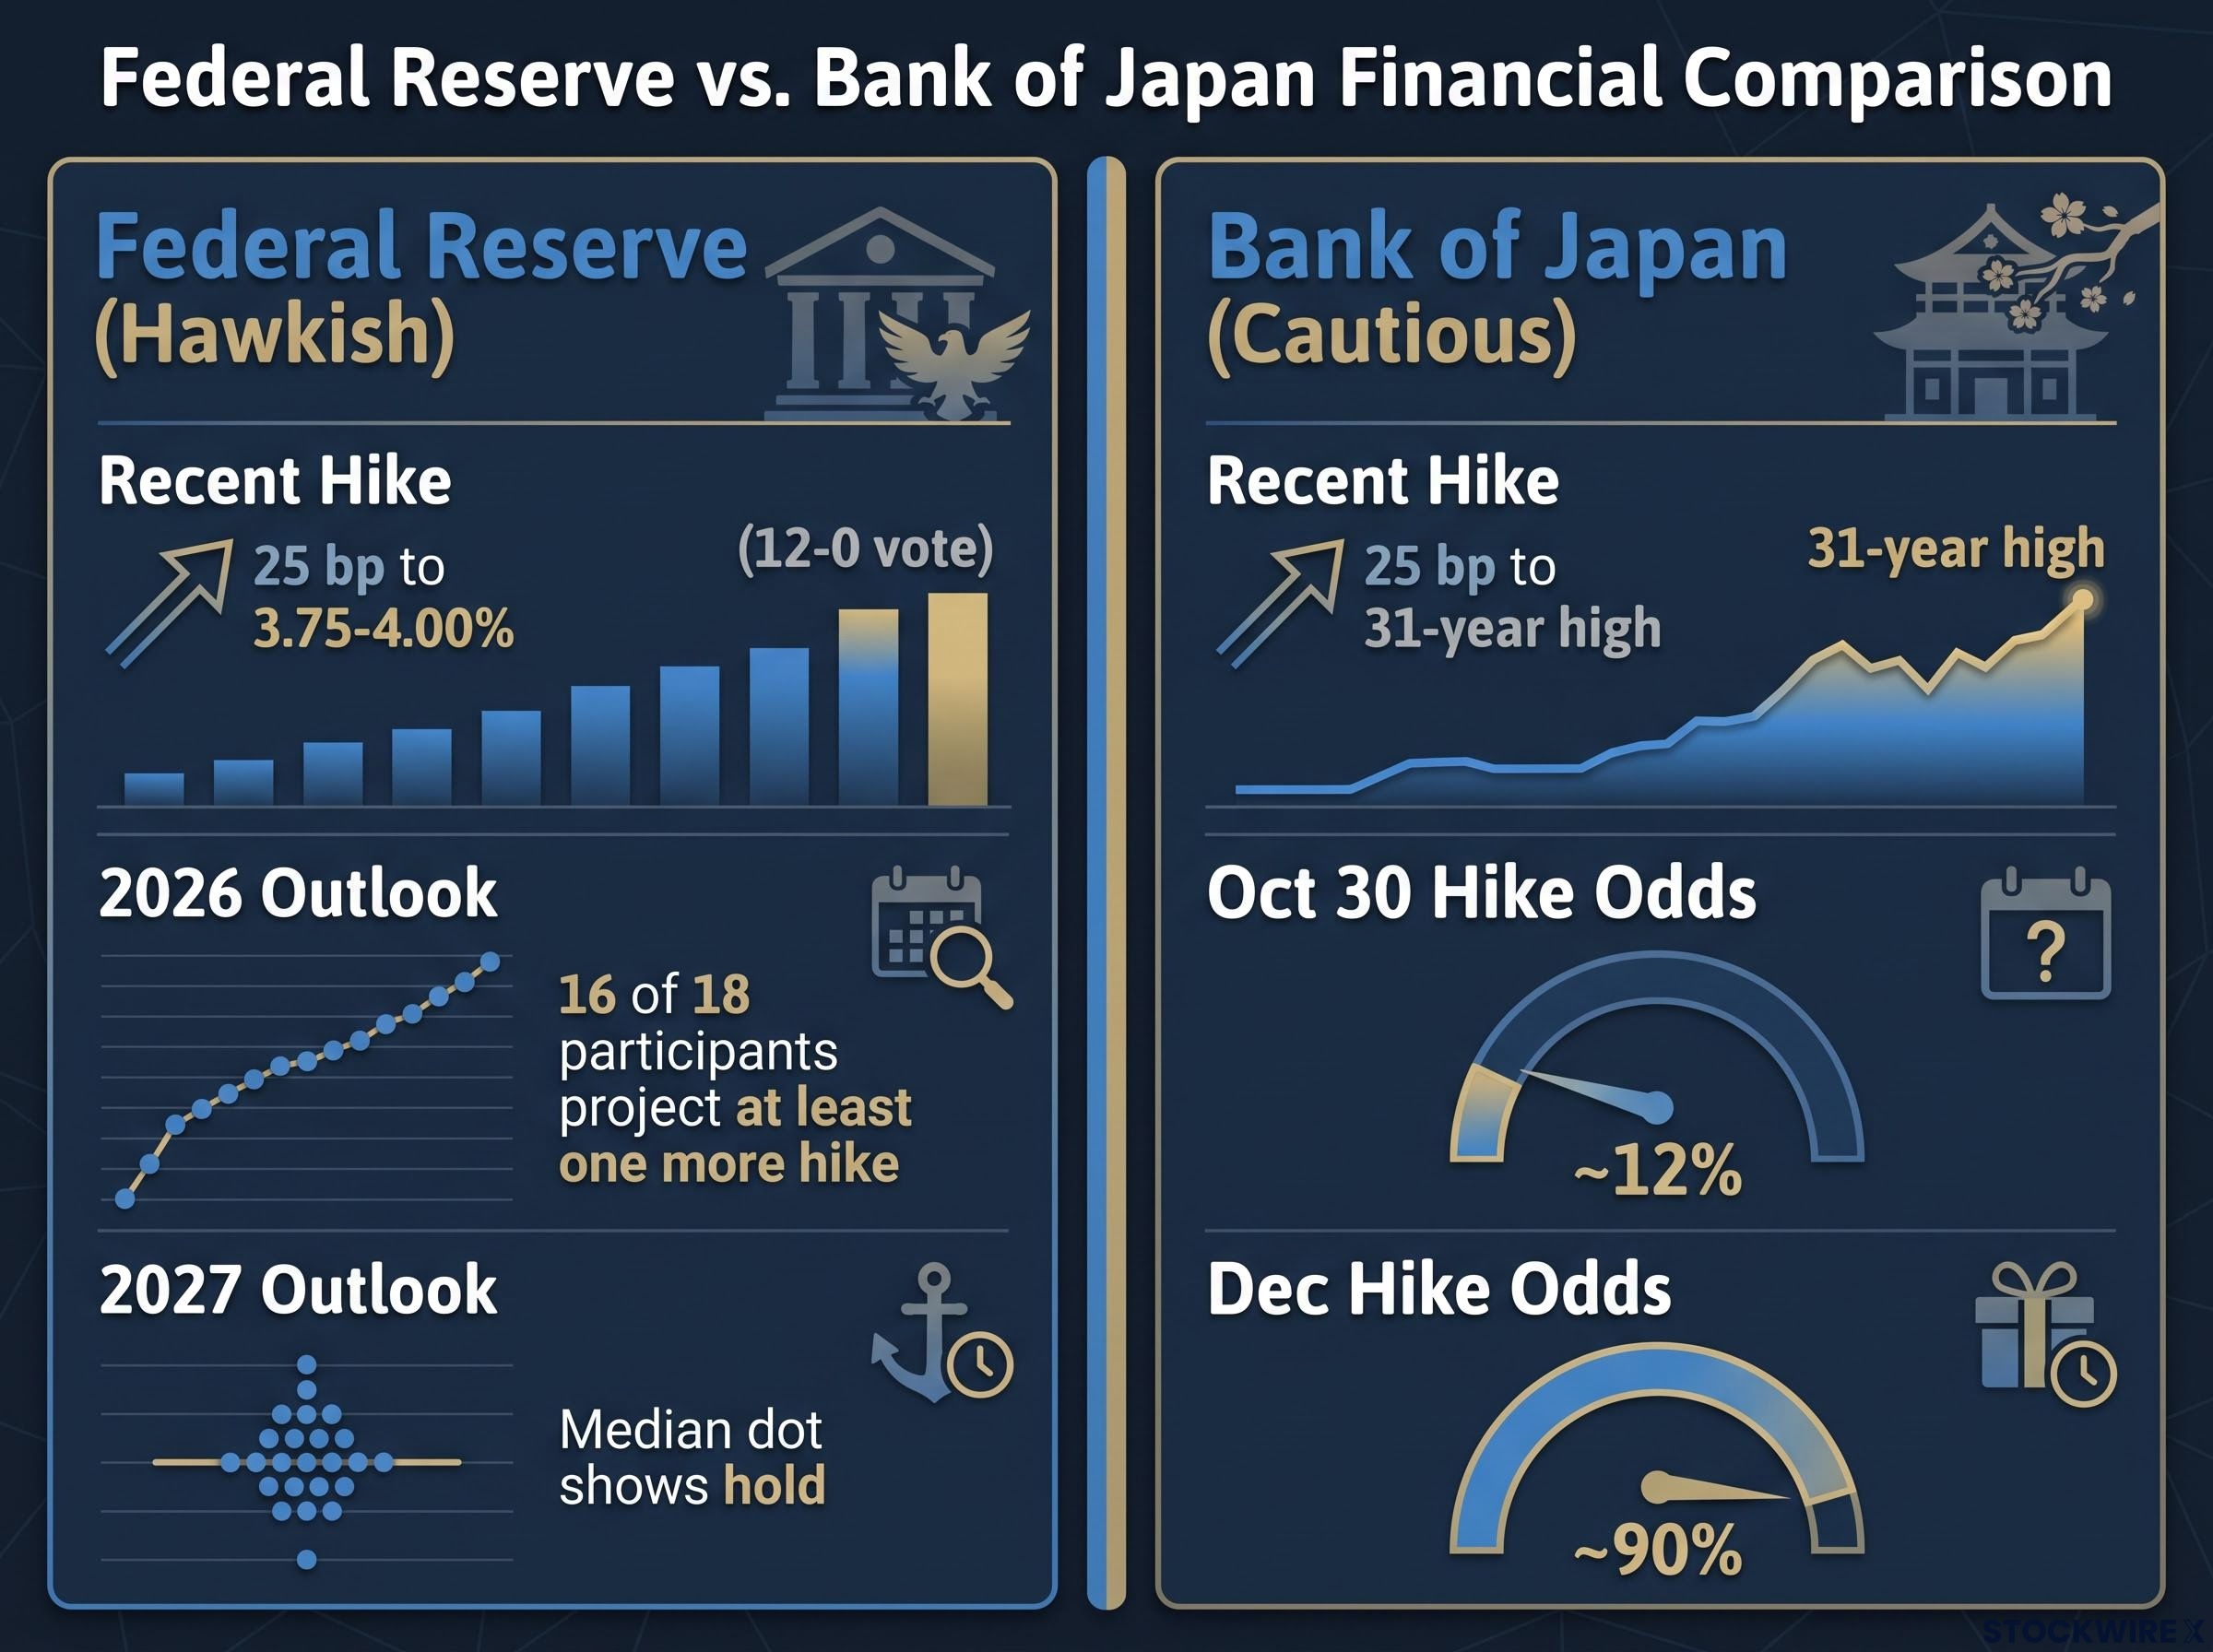
Last month the BoJ raised rates by 25 bp to a 31-year high. The yen weakened anyway, sliding beyond 158 per dollar.
That reaction makes sense once you see what markets wanted. Traders were looking for evidence of a faster tightening cycle, and the hike alone did not provide it. Officials carried out rate checks in overseas markets, where they ask dealers for prices as a warning of possible intervention. The yen briefly firmed, then gave the gains back.
The repricing since then has been sharp. Overnight index swaps (OIS), contracts that let traders bet on future central bank rates, now imply about 12% odds of a hike on 30 October, down from a peak near 40% early last week, according to Bloomberg. Include December and the probability rises to about 90%.
Three signals explain the shift:
- Governor Kazuo Ueda said yesterday the BoJ will weigh the probability and risks of its baseline outlook materialising before setting the speed and timing of further hikes.
- Ayano Sato, a new board member, said she favours raising rates in multiple stages.
- Market pricing has moved the focus to December, a view Rabobank shares, arguing consecutive hikes are unlikely.
Lazard Asset Management adds a further layer: Japanese officials appear more concerned with how fast the yen depreciates than with its exact level. That points to a policy mix of tolerance plus smoothing, not a dramatic shift.
The 2024 experience shows how this plays out.
Russell Investments on 2024 The BoJ “failed to live up to the market’s rate hike expectations,” and the yen weakened again.
What this tells you is that the yen responds to the pace the market expects, not to whether the BoJ hikes at all. A hold on 30 October is already priced and would likely be a non-event. A surprise hike would not, and with December carrying the weight of expectations, pressure on the yen is likely to persist through the October meeting.
A shift in the BoJ rate decision framework matters here, because officials who accept acting on incomplete information lower the threshold for a December move even if October passes quietly.
When big ASX news breaks, our subscribers know first
Hawkish Fed, weak payrolls: how mixed US signals are repricing the dollar side
On the other side of the pair, the signals point in opposite directions. September nonfarm payrolls rose just 29K, and unemployment climbed to 4.2% from 4.1%, against a consensus of 4.1%, according to the Bureau of Labor Statistics. Sources differ on the payrolls consensus and on the August comparison, but the headline was clearly soft.
Yet only three weeks earlier, the FOMC raised its target range by 25 bp to 3.75-4.00% on a unanimous 12-0 vote. Sixteen of 18 participants projected at least one more hike in 2026, and the median dot (the midpoint of officials’ rate projections) shows one more hike, then a hold through 2027.
“Inflation is too high, and has been for too long,” said Kevin Warsh, Chair of the Federal Reserve.
Fed official Jeffrey Schmid reinforced that tone, calling inflation frustrating and saying the Fed has further to go. FXStreet’s Speechtracker scored him 8/10 against a 7.5/10 historical average.
| Indicator | Latest reading | Market reaction | Direction for USD/JPY |
|---|---|---|---|
| September payrolls | 29K | Dovish surprise | Lower |
| Unemployment rate | 4.2% (from 4.1%) | Above consensus | Lower |
| October Fed hike odds | 16% (from 24%) | Focus shifts to December | Modestly lower |
| FXS Fed Sentiment Index | 137.91 (neutral 100) | Firmly hawkish | Higher |
The contradiction resolves once you separate timing from intent. Weak data has trimmed the odds of an October move, per Newsquawk, and pushed expectations towards December, but it has not dented the Fed’s stated direction. Rabobank argues markets are overpricing Fed tightening next year and sees USD/JPY potentially falling into 2027 if that hike risk is priced out.
For you, today’s Minutes are the swing factor. A hawkish read confirms the dollar side of the yield gap; a softer one gives the first real crack in it.
Why the yen keeps weakening: the structural drivers behind the move
Strip away the headlines and one number explains most of the pressure: 363 bp of carry at USD/JPY near 158, according to TradingNews.
Structural forces
A carry trade means borrowing in a low-interest currency, such as the yen, and investing in a higher-yielding one, such as the dollar. The rate differential, the gap between the two countries’ interest rates, is what you earn for holding the position. When that gap is wide, selling the yen pays you simply to wait.
The carry trade mechanics behind the yen’s weakness also explain why rebounds fade: when leveraged positions sit across equities, bonds and emerging-market assets, any unwind spreads well beyond the currency pair itself.
That gap has deep roots. Ultra-loose BoJ policy from 2013 to 2024 weakened the yen, and the gradual unwind has offered only partial support. Russell Investments also cites fiscal concerns under Prime Minister Takaichi as eroding the durability of yen rebounds.
Cyclical swings
Cyclical forces interrupt the trend without ending it. Intervention and rate checks deliver short bursts of yen strength. Risk sentiment matters too, because the yen is treated as a safe haven and tends to firm during market stress, while remaining sensitive to US-Japan yield differentials (specific 10-year yield levels were not available).
The biggest cyclical shock came between July and September 2024. Intervention, the BoJ’s first hike and soft US data triggered a carry unwind that took USD/JPY from 158 to about 140. The yen then weakened again.
| Driver | Type | How it moves the yen | Current status |
|---|---|---|---|
| Rate differential | Structural | Rewards short-yen carry | 363 bp carry |
| Policy divergence | Structural | Slow BoJ versus hawkish Fed | Persisting |
| Fiscal concerns | Structural | Erodes rebound durability | Cited by Russell |
| Intervention | Cyclical | Sharp, temporary yen strength | Ready near 160 |
| Carry unwinds and risk sentiment | Cyclical | Rapid yen buying in stress | Event-dependent |
Russell’s conclusion is blunt: sustained yen strength requires tighter BoJ policy. Unless the policy gap narrows, any rebound you see from a single event is likely to be borrowed time.
The 160 line: technical levels, intervention history and scenarios
The structural pressure runs straight into a zone where both the chart and the Ministry of Finance (MoF) push back.
Technical map
According to FXStreet’s daily chart read, the pair is capped below its 100-day simple moving average (SMA), the average closing price over 100 sessions. Bollinger Bands, which plot a range around a moving average, frame the rest.
| Level | Value | Role | Note |
|---|---|---|---|
| Upper Bollinger Band | 159.80 | Resistance | Just below 160 |
| 100-day SMA | 159.55 | Resistance | Current cap |
| Pivot | 158.38 | Reference | Near spot |
| Middle band | 156.90 | Support | Price trades above |
| Lower band | 154.00 | Support | Deeper floor |
The 14-day Relative Strength Index (RSI), a momentum gauge running from 0 to 100, sits at 56.27. That reads as capped but constructive.
What intervention has and has not done
- April-May 2024: ¥9.79 trillion after the 160.245 high.
- 11-12 July 2024: ¥5.53 trillion, moving the pair from 161.76 to 157.30.
- April-May 2026: a record ¥11.73 trillion, yet the pair was near 162.5 by June.
- 30-31 July 2026: coordinated Japan-US operation; cumulative 2026 operations exceed ¥27 trillion, with the largest campaign at ¥15,399.3 billion, per FXCM.
Russell Investments estimates about US$225 billion spent since the start of 2024. On 24 September, Finance Minister Satsuki Katayama said the principles behind the 31 July operation “remain in place.”
Scenarios into 30 October
The upside case is a hawkish Minutes read and a BoJ hold, with intervention overwhelmed as it was in June. The downside case pairs joint intervention with a hawkish BoJ surprise and weaker US data, the mix behind the 2024 slide to about 140. Rabobank’s 3-month target is 155.00.
Treat 159.5-160 as a zone where a sharp, short-lived reversal is plausible, not a hard ceiling. Planning around event risk serves you better than anchoring to one price.
Tokyo’s response appears to depend on the velocity of the move more than the price level, so a fast sprint to 160 carries far higher reversal risk than a slow drift to the same number.
Past performance does not guarantee future results. Financial projections are subject to market conditions and various risk factors.
What to watch before 30 October, and what would change the picture
USD/JPY is held up by a policy gap, capped by intervention risk near 160, and exposed to two near-term events. These variables carry the most weight:
- The tone of today’s FOMC Minutes
- December BoJ hike pricing in OIS markets
- The next round of US labour and inflation data
- Any MoF rate check or escalation in verbal warnings
A drift higher would be confirmed by hawkish Minutes, steady December BoJ odds and firm US data. A reversal would need the opposite: softer Fed signals, a BoJ leaning faster, and official action that coincides with weak data rather than fighting strong data.
This article is for informational purposes only and should not be considered financial advice. Investors should conduct their own research and consult with financial professionals before making investment decisions.