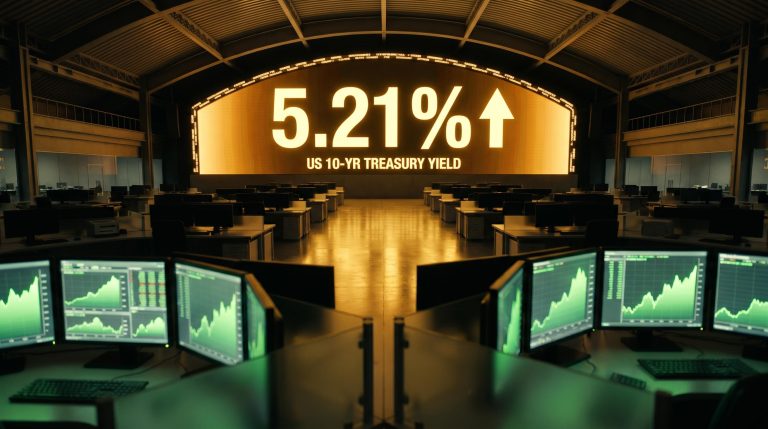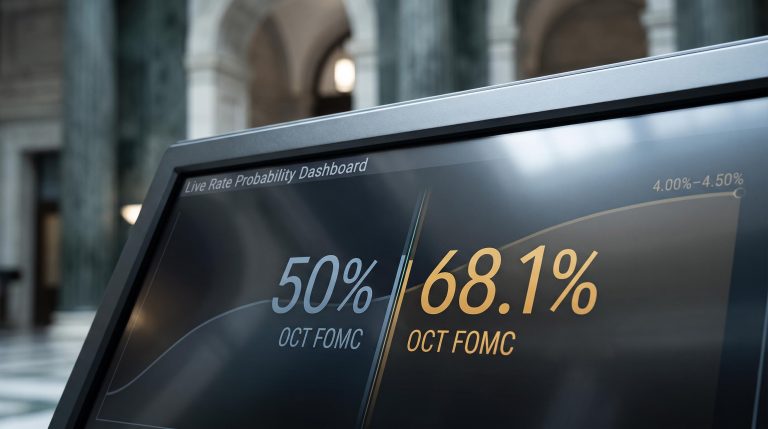
Four straight months of slowing job growth have been repricing Federal Reserve expectations for weeks, and now the moment of confirmation arrives. The July 2026 nonfarm payrolls report lands this Friday with equity markets, bond traders, and rate-watchers all watching to see whether the labour market’s recent softness represents a genuine trend or a temporary dip.
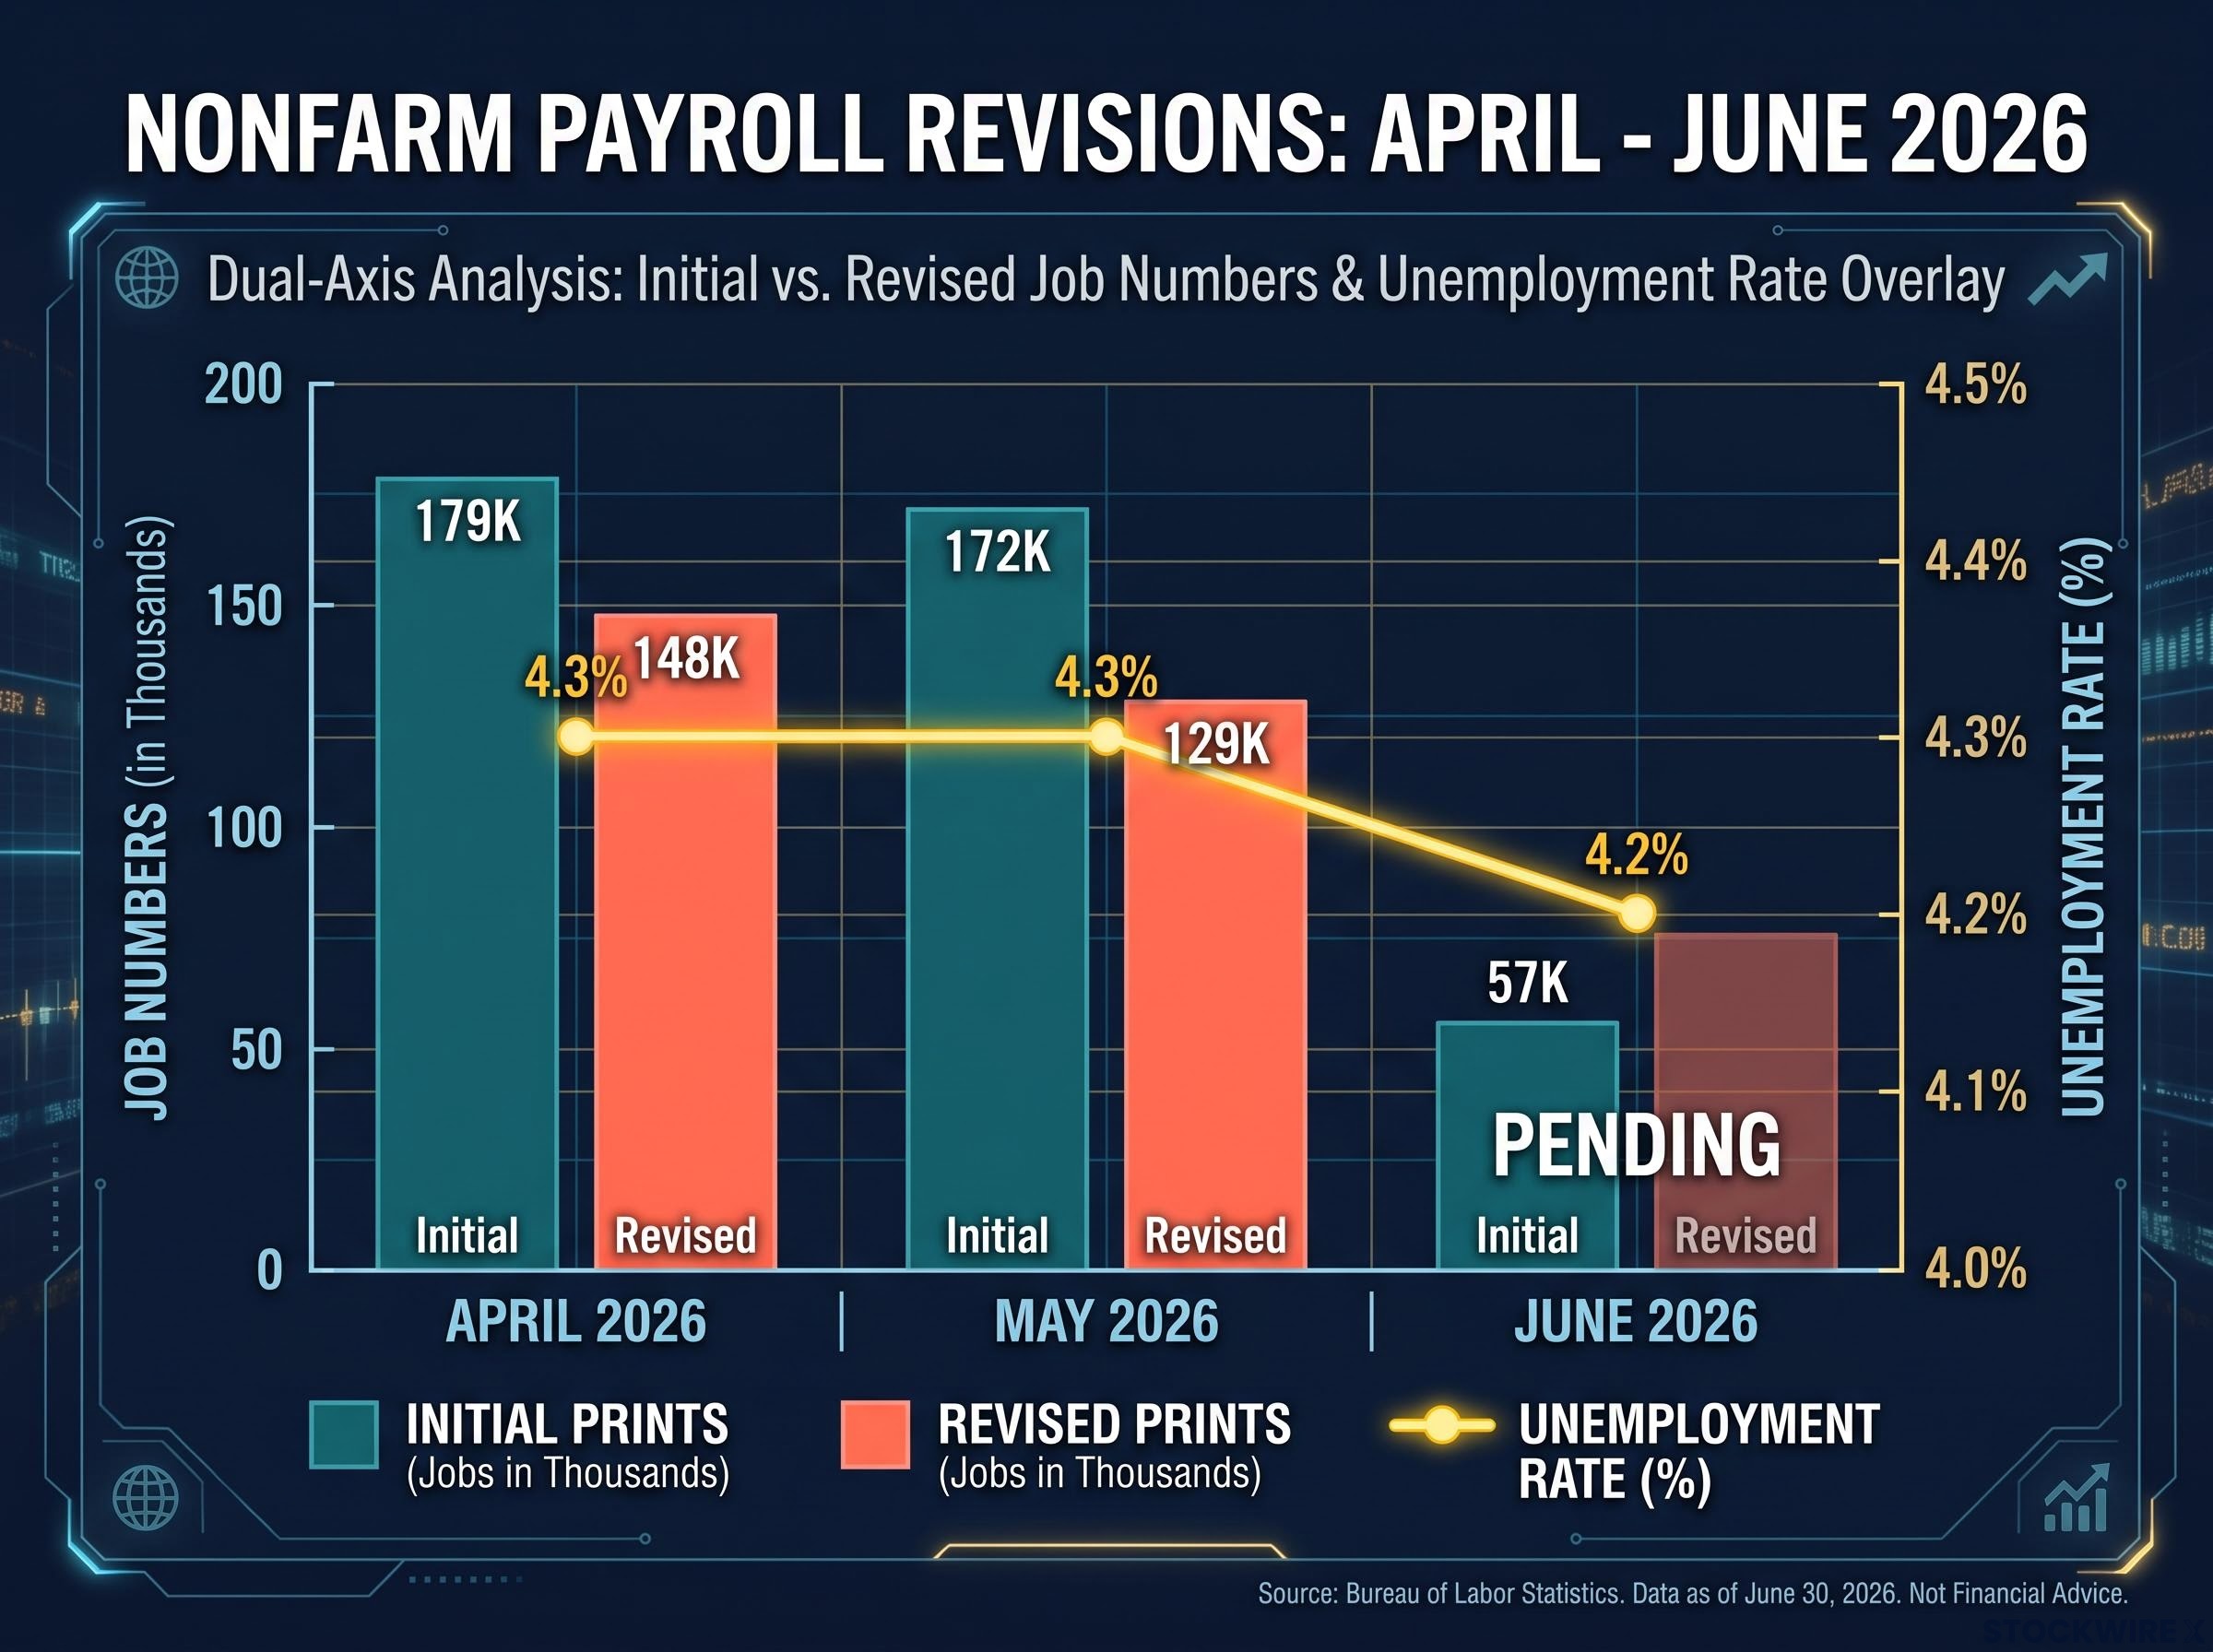
June’s print of 57,000 new jobs came in at less than half the consensus forecast, adding to a sequence of underwhelming figures. May was revised down to 129,000 from an initial 172,000. April settled at 148,000 after a first read of 179,000. Treasury yields dipped and stock futures rose after June’s miss as traders trimmed rate-hike probabilities. Whatever number drops Friday either confirms that repricing or scrambles it.
Here is the framework for interpreting whatever comes out: what the trend actually signals, which components of the report carry the most weight, where the Fed stands, and how to think about the AI disruption narrative without letting media framing do the analytical work for you.
Decelerating job growth: the four-month trend in context
The numbers, laid out in sequence, tell the story more clearly than any single headline can.
| Month | Initial Print | Revised Figure | Unemployment Rate |
|---|---|---|---|
| April 2026 | 179,000 | 148,000 | 4.3% |
| May 2026 | 172,000 | 129,000 | 4.3% |
| June 2026 | 57,000 | Pending | 4.2% |
Every initial print over the past three months was revised lower. The direction is unambiguous. But note what has not happened: the unemployment rate actually fell to 4.2% in June, its lowest in roughly a year. Initial jobless claims remain near 215,000, which means firms are hiring more slowly, not shedding workers. Year-over-year employment is still up approximately 0.3%.
That distinction, between a cooling labour market and a collapsing one, is not semantic. Cooling is consistent with a soft-landing scenario where inflation eases without a recession. Collapsing is the leading edge of something far worse. The data, so far, sits firmly in the cooling camp. Everything that follows in this piece depends on understanding that difference correctly.
The June payrolls miss delivered a headline unemployment drop to 4.2% that masked a simultaneous fall in the labour force participation rate to 61.5%, a divergence that illustrates precisely why the unemployment rate alone cannot carry the full weight of labour market interpretation.
When big ASX news breaks, our subscribers know first
Why jobs data is the last thing equity markets actually trade on
There is a widespread assumption that a weak payroll number is bad for stocks and a strong one is good. The reality is more complicated, and getting it right matters more than the headline figure itself.
Employment data is a lagging indicator. It captures the outcome of decisions businesses had already made, reflecting the state of the economy as it was rather than as it stands now. Equity markets, by contrast, are forward-looking. They incorporate anticipated earnings trajectories, credit conditions, and shifts in monetary policy across a roughly 3-to-30 month horizon. The two are operating on completely different clocks.
History confirms this mismatch repeatedly. Labour markets often continue deteriorating well after equities have already bottomed and begun recovering, because employment adjusts to changes in sales and profits with a delay, not in real time. Throughout 2026, financial media coverage has repeatedly overstated the significance of individual payroll misses, framing each weak release through the lens of geopolitical tension and job losses tied to AI adoption.
If you are adjusting your portfolio based on a payroll number in isolation, you are likely trading on yesterday’s news while the market is already pricing tomorrow’s conditions.
The Federal Reserve is the real transmission channel
So if labour data does not directly drive equities, how does it move markets? Through the Fed.
The primary way a jobs report affects asset prices is by shifting expectations about what the Federal Reserve will do with interest rates. June’s weak print made this mechanism visible in real time. Stock futures rose. Treasury yields fell. The 2-year Treasury yield, which is particularly sensitive to Fed expectations, dropped approximately 3.5 basis points to 4.13%. Traders were not celebrating a weak economy; they were pricing in reduced odds of further tightening.
Commentary from a major asset manager following June’s report noted that slower job growth “reinforces the view that the Federal Reserve is under little pressure to tighten policy.”
Sticky wage growth at 3.5% year-over-year is the variable most capable of keeping the Fed’s hiking debate alive even as headline job creation cools, because sustained wage pressure at that level remains inconsistent with a return to 2% inflation regardless of how soft the payroll prints run.
For Friday, three scenarios matter:
- Confirmation of the slowdown (payrolls in the 50,000-130,000 range, unemployment stable): Likely supportive for equities and bonds. The Fed stays on hold, and the current consensus holds.
- Strong upside surprise (payrolls above 200,000, wages accelerating): Re-ignites rate-hike fears. Both equities and bonds could sell off as traders reprice the policy path.
- Sharp deterioration (payrolls negative or near zero, unemployment jumping above 4.5%): Recession pricing enters the picture. Defensive sectors and duration trades gain, cyclicals sell.
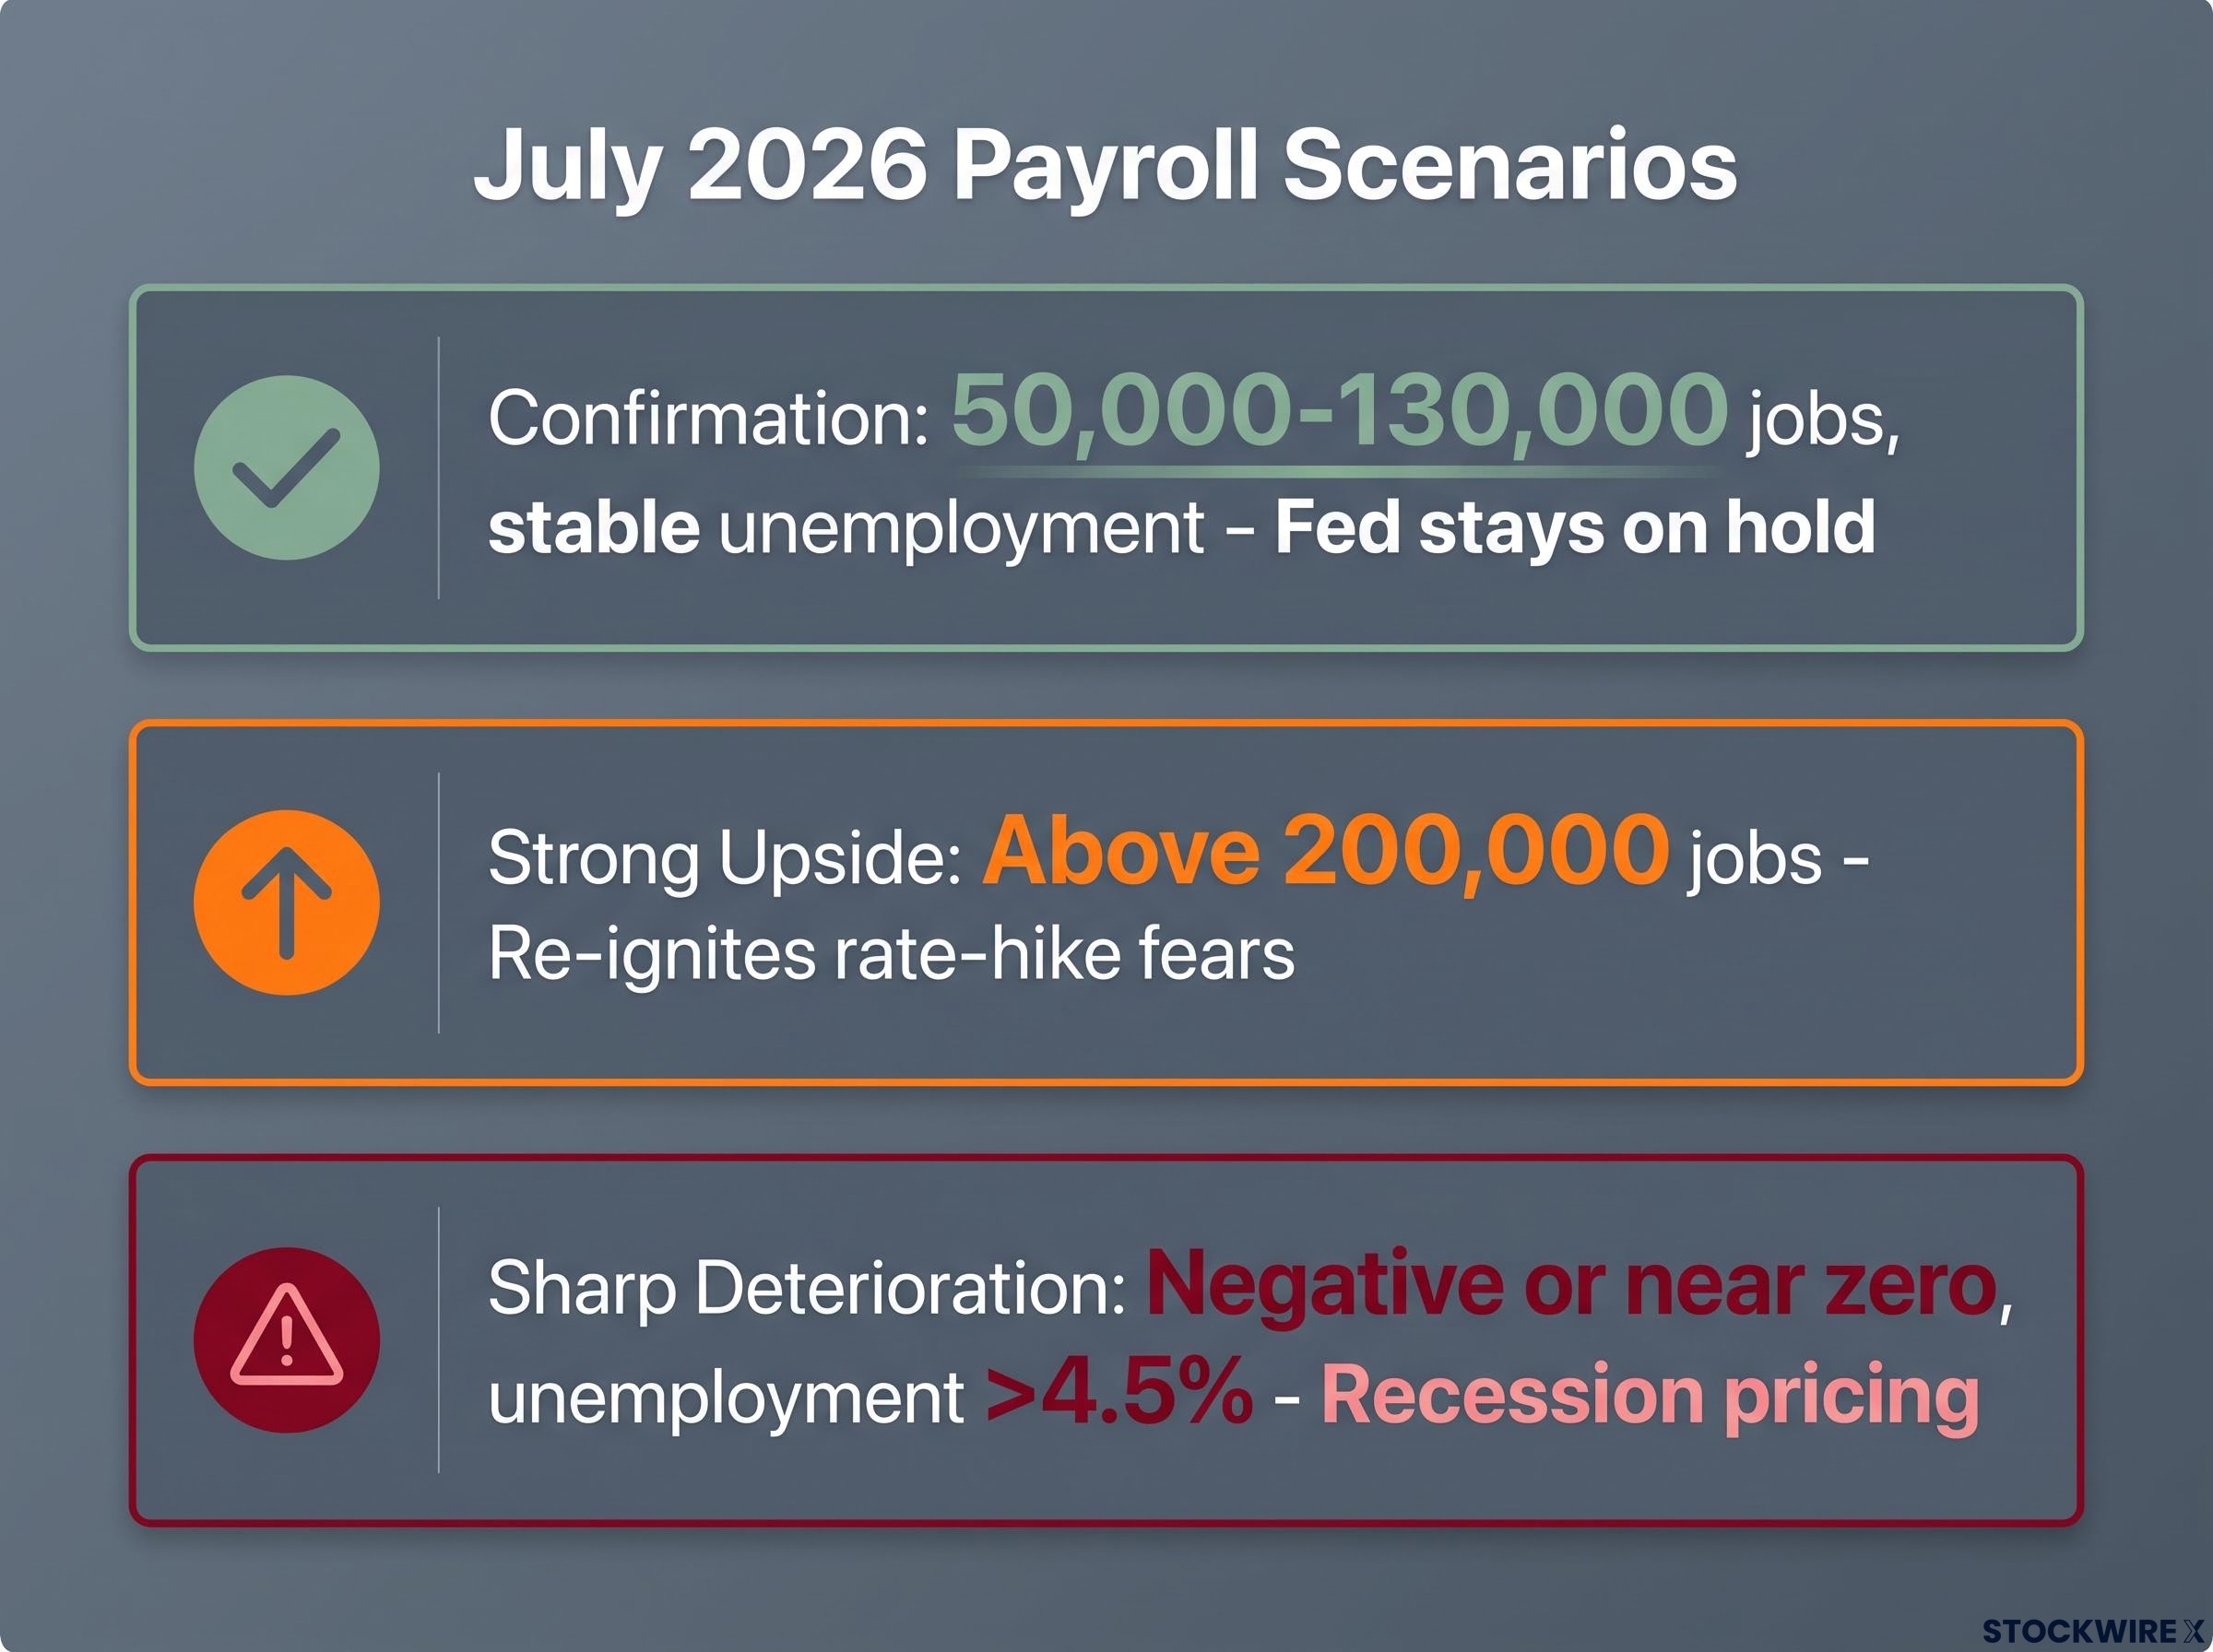
The June reaction is not ancient history. It established the baseline that Friday’s number will either validate or disrupt. Knowing which scenario you are watching for turns the release from noise into a useful signal.
Beyond the headline: the components that carry the real information
Most investors will see one number on Friday morning. The ones who read the report properly will focus on four or five that matter more.
- Wage growth: June average hourly earnings rose 0.3% month-over-month and 3.5% year-over-year. If wages stay firm while hiring slows, it tells you labour market tightness persists beneath the surface, which keeps the Fed cautious about declaring victory on inflation. Watch both the monthly and annual figures.
- Labour force participation rate: This fell from 61.8% to 61.5% in June, the lowest since the late 1970s outside the COVID period, with the labour force shrinking by approximately 72,000 people. A falling participation rate can make the unemployment rate look better than it actually is. If workers are leaving the labour force rather than finding jobs, a low unemployment rate is masking weakness, not confirming strength.
- Sector composition: Professional and business services added 36,000 jobs in June, including 9,300 in temporary help services, marking five straight months of temp-work growth. Leisure and hospitality saw its biggest decline since 2020. If weakness in July concentrates in a handful of sectors, that points to targeted disruption. Broad-based softness would be more concerning.
- Prior-month revisions: May and April were both revised substantially lower. That means June’s figure and July’s figure could both move after initial release. An upward revision to June would soften the apparent slowdown. A further downward revision would reinforce it.
A participation rate decline that masks flat unemployment is not the same as genuine labour market strength. That distinction matters enormously for how you should read whatever headline number appears Friday morning.
AI and the jobs slowdown: structural disruption or transitional adjustment?
Every weak payroll print in 2026 has been accompanied by the same question: is AI killing jobs? The answer is more nuanced than either the optimists or the pessimists tend to acknowledge.
AI and automation are plausibly contributing to slower white-collar hiring. Corporate commentary consistently references doing more with fewer people, even if the Bureau of Labor Statistics (BLS) data does not itemise the cause. The effect is real, but its permanence is the open question.
Goldman Sachs economists identify 2026 as the year AI displacement in payroll data becomes clearly visible at the aggregate level, with their research estimating a reduction of roughly 16,000 jobs per month attributable to automation, a figure that sits directly inside the range of recent monthly misses.
Fisher Investments views technology as operating on two fronts at once: it displaces certain roles, but it also brings entirely new job categories into existence, typically in ways that neither investors nor analysts manage to foresee in advance.
Economic history supports this framing. Mechanised agriculture, factory automation, and computerisation each displaced specific jobs but ultimately produced new sectors and occupational categories rather than permanent mass unemployment. Some businesses have already begun signalling renewed hiring intentions tied to demand for workers who can operate new technologies, including developers, data specialists, and human-AI workflow designers.
For investors, the question is not whether AI eliminates jobs. The question is whether the companies you own are capturing the productivity gains, and whether those gains translate into margin expansion and reinvestment in growth initiatives. The answer to that question lives in earnings calls and capital expenditure disclosures, not in the nonfarm payrolls report.
What Friday’s number actually changes, and what it does not
Friday’s report is most useful as macro context, not as a portfolio timing signal. Most of the deceleration trend is already priced into rates markets and equity multiples. A modest beat or a modest miss is unlikely to materially shift the investment thesis for most portfolios.
The indicators that deserve more weight than the payroll headline are forward-looking:
- Corporate earnings and guidance over the next six weeks of reporting season
- Capital spending plans, particularly around AI and automation
- Credit conditions and lending standards
- Consumer spending trends and sentiment data
The most likely baseline scenario remains a slow-growth, disinflationary environment where the Fed stays on hold and index-level returns depend more on earnings resilience and sector rotation than on any single monthly data release. That consensus holds unless Friday delivers a genuine outlier, either sharply positive or sharply negative.
If the number falls within the range of recent months, the bigger question is not what happened in July but what company guidance tells you about where the economy is actually heading.
For investors wanting to translate the soft-landing baseline into a concrete portfolio framework, our full explainer on H2 2026 portfolio positioning covers the Sahm Rule signals, specific trigger levels that would shift the macro environment from amber to red, and how major institutions are structuring for genuine uncertainty in both directions.
This article is for informational purposes only and should not be considered financial advice. Investors should conduct their own research and consult with financial professionals before making investment decisions. Past performance does not guarantee future results, and financial projections are subject to market conditions and various risk factors.