More than 380 points have been stripped from the S&P/ASX 200 in a matter of weeks, and as of today, 10 September 2026, the damage has spread wide enough to drag dozens of established Australian companies into confirmed technical weakness.
This is not a rout confined to speculative small caps. Banking giants, retail conglomerates, and market-darling technology names are all sitting in the same downtrend scan.
The selling is being driven by a familiar cluster of anxieties: oil prices pushing toward US$95 per barrel, consumer sentiment falling off a cliff, and renewed market fears of a Reserve Bank of Australia rate hike as soon as November.
Here is the useful separation between the noise of a market sell-off and the actual underlying data. This piece breaks down the hardest-hit sectors, spotlights the 22 stocks under the most intense pressure, and gives you a framework for reading current portfolio risk rather than reacting to it.
What a confirmed technical breakdown actually signals today
Before you look at the list of names, it helps to know exactly what a technical downtrend scan is telling you, and what it is not.
The scan referenced here is the ChartWatch Daily ASX Scans, run by Market Index’s Carl Capolingua, using a trend-following methodology. When a stock appears on it, that means its trailing price structure has deteriorated. It does not mean the underlying business has failed.
That distinction matters more than most investors realise during a sell-off.
Technical signals like moving-average crossovers are lagging indicators. They confirm a move only after it is already underway, which is why they often flag a stock right as a pullback is happening rather than before it.
Lagging technical signals like moving-average crossovers carry a well-documented limitation: the S&P 500 has posted positive 12-month returns approximately 72% of the time following a death cross since 1950, a figure that reframes the signal as a risk-awareness prompt rather than a directional forecast.
The limitations are well documented in the research on trend-following systems:
- Lagging indicators confirm price moves after they have begun, not before.
- False signals and whipsaws are common in sideways or volatile markets, leading to overtrading.
- High transaction costs eat into returns, which is why realistic real-world excess returns are typically constrained to just 1-3% annually after fees.
Quantitative backtests reinforce the caution. Signals lasting less than one month have historically been unprofitable, and they account for roughly 40% of occurrences in some strategy tests.
So what does it mean when heavyweights like Commonwealth Bank turn up on this scan? It means institutional momentum has turned against them. Capital is rotating out. That is real, and worth knowing.
But price action is not the same as fundamental value. For a long-term holder, a major stock appearing here is a prompt to review the valuation, not an automatic instruction to sell.
The historical record supports keeping a level head.
Since 2000, the S&P/ASX 200 has experienced 15 separate episodes where the index fell at least 10%. In the vast majority of those cases, the subsequent one-year return was positive. The standout exception was the 2008-09 Global Financial Crisis.
Read the following list as a data point, then, not a forecast. It tells you where momentum has broken. It does not tell you where the businesses are heading.
The 22 ASX heavyweights and mid-caps exhibiting maximum selling pressure
Of the stocks flagged in the 10 September scan, 22 are showing the most concentrated selling pressure. They cluster heavily in three places: consumer discretionary, property, and technology. That clustering tells you exactly where the market perceives the greatest vulnerability to rate hikes right now.
The context is stark. The S&P/ASX 200 A-REIT Index fell 6.67% over the month to 31 August 2026. Consumer discretionary dropped 1.6% on 8 September alone. And Commonwealth Bank, trading at a roughly 34% premium to its peer banks, was not spared.
1. Commonwealth Bank (CBA)
Down 10.7% over the month despite reporting record earnings. The institutional concern is purely valuation: CBA was trading at 25-26x earnings, well above peers.
2. Wesfarmers (WES)
A 17.1% monthly drop, with mid-2026 broker data showing a complete absence of Buy ratings amid the pressured retail environment.
3. Wisetech Global (WTC)
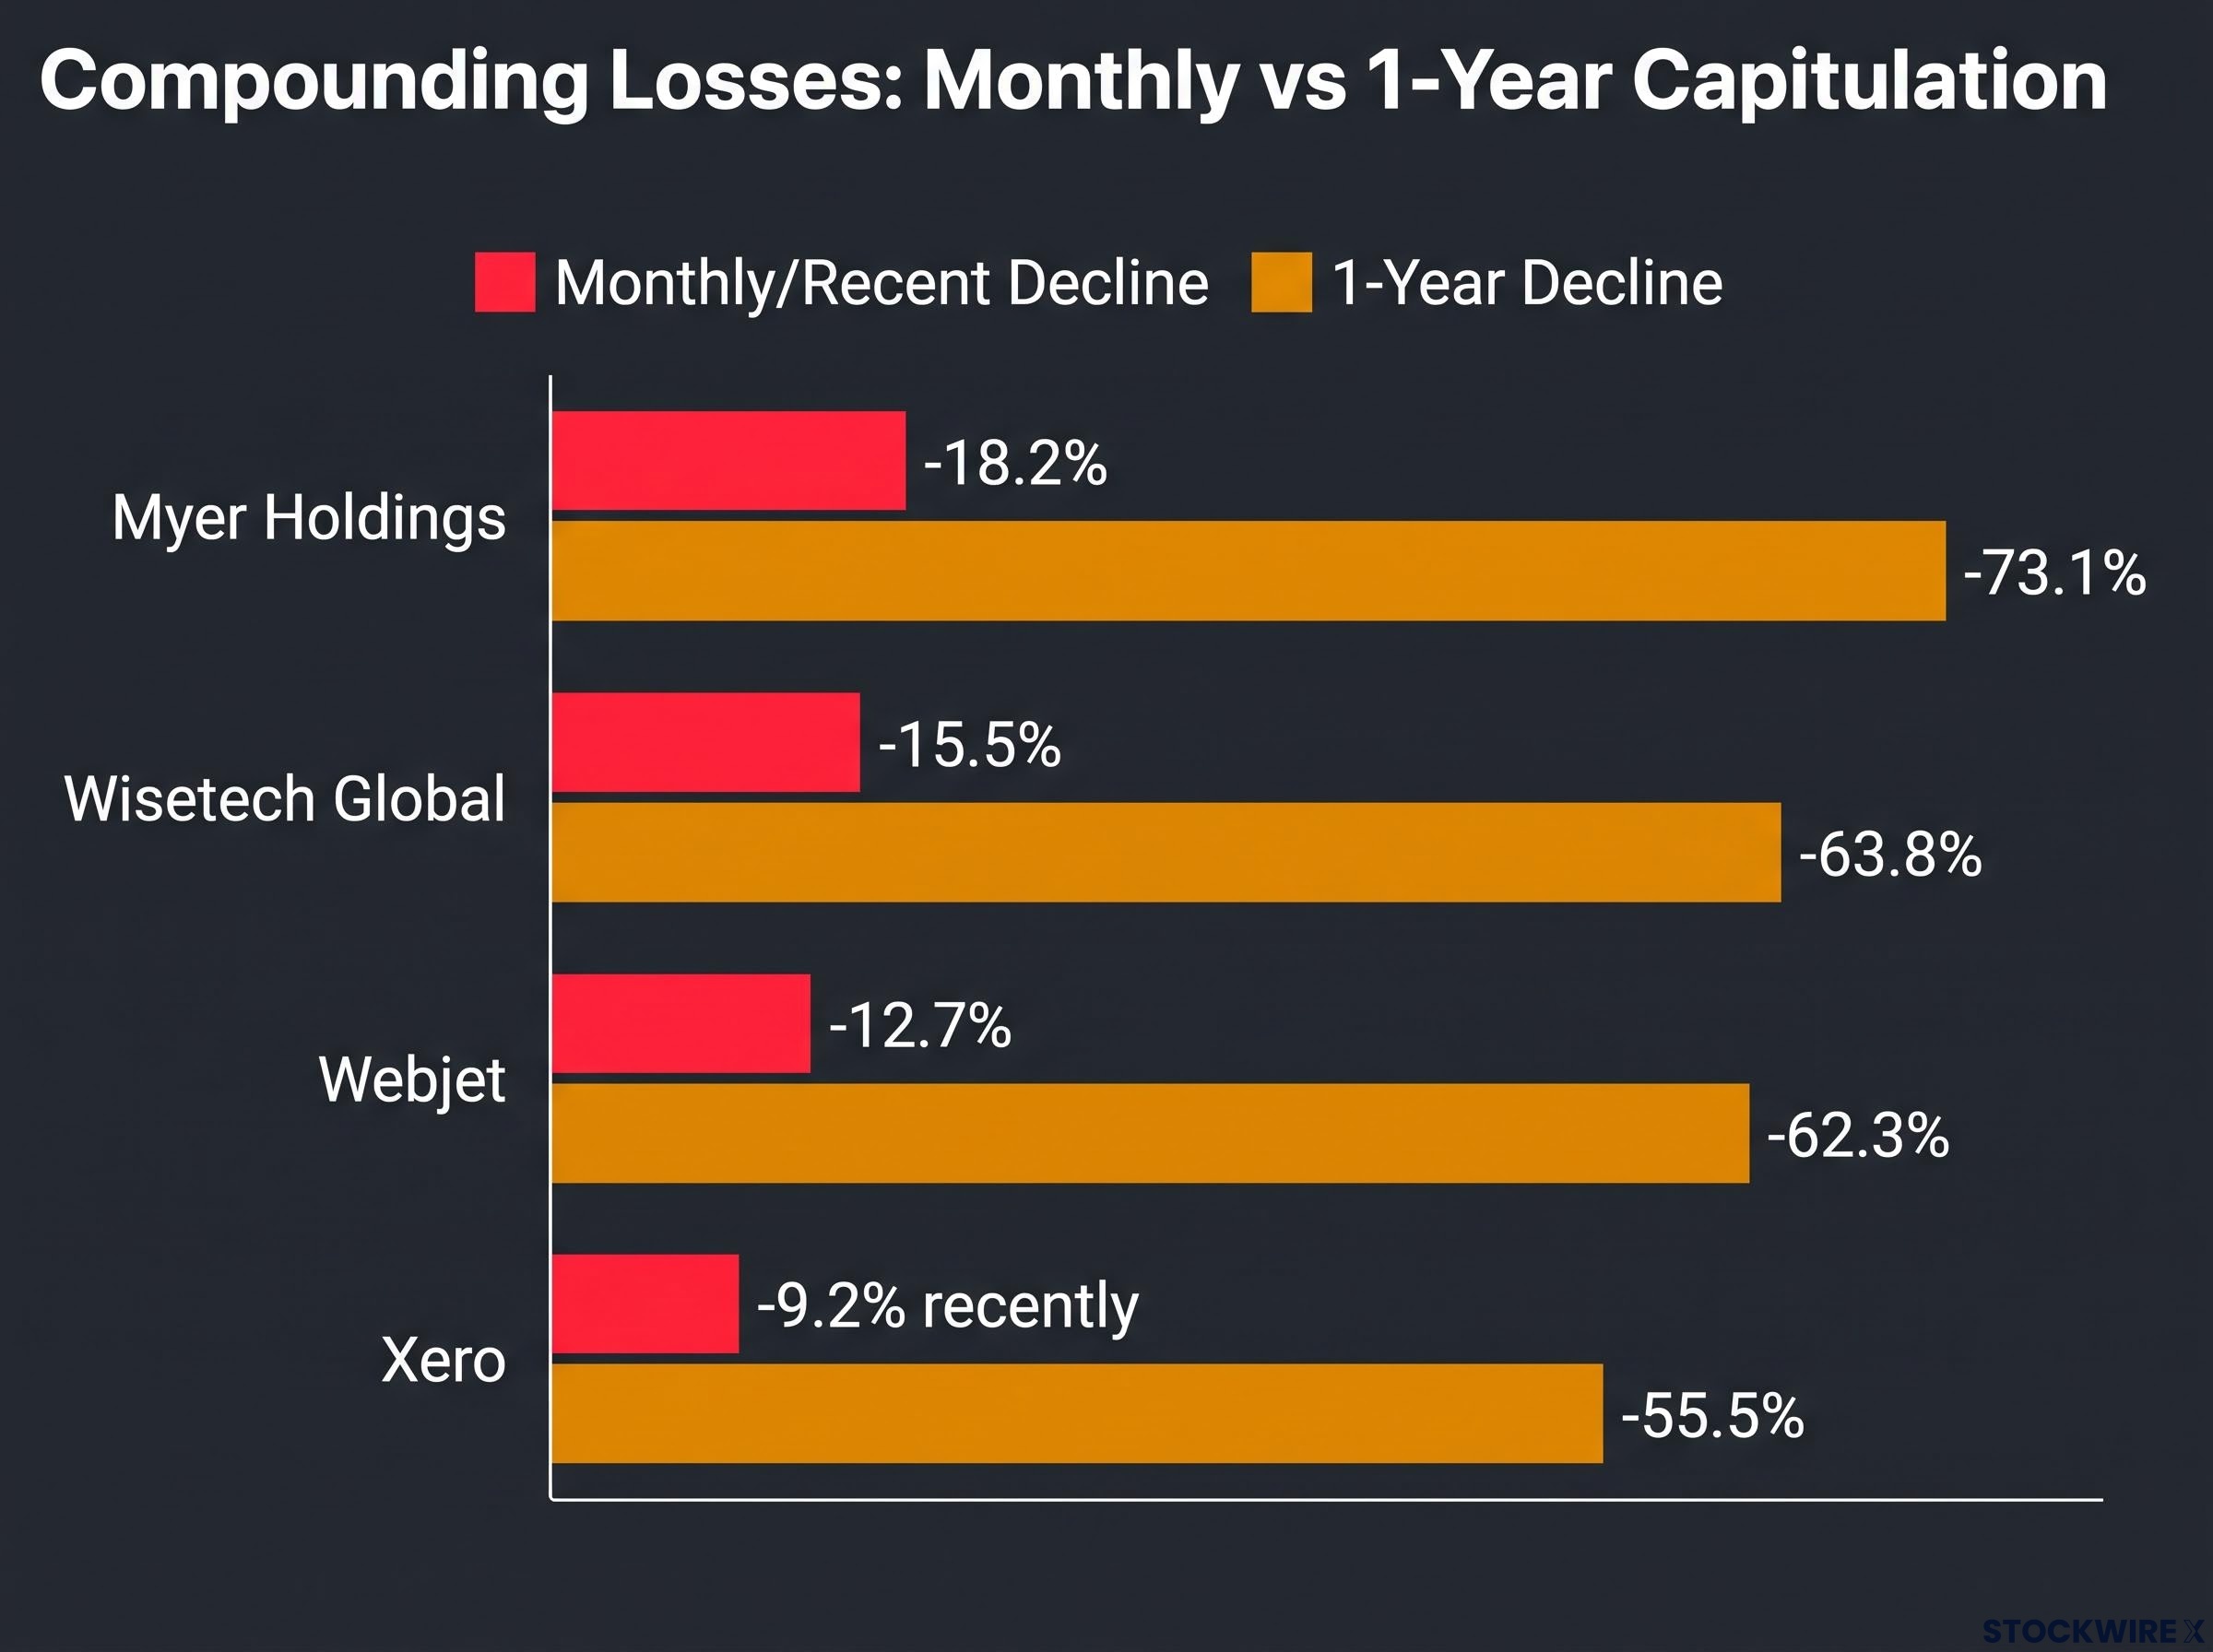
The logistics technology heavyweight fell 15.5% over the month, extending a much larger 63.8% one-year decline.
4. Xero (XRO)
Down 9.2% recently, a modest move set against a punishing 55.5% one-year fall.
5. Seek (SEK)
A severe 20.3% one-month pullback for the employment classifieds operator.
6. Charter Hall (CHC)
Down 22.9% over the month, the sharpest fall among the heavyweights and a clear signal of REIT vulnerability to rising yields.
7. Ebos Group (EBO)
The healthcare and pharmacy distributor slid 10.9% over the month.
8. Flight Centre Travel (FLT)
A 17.2% monthly fall as discretionary travel spending faces renewed scrutiny.
9. Harvey Norman (HVN)
Down 15.8% over the month, tied directly to squeezed household budgets and the broader retail squeeze.
10. Metcash (MTS)
An 8.6% monthly decline for the consumer staples wholesale distributor.
11. Myer Holdings (MYR)
An aggressive 18.2% monthly drop on top of a staggering 73.1% one-year capitulation.
12. Nine Entertainment (NEC)
Down 17.3% over the month, reflecting weakness in traditional media and advertising spend.
13. Propel Funeral Partners (PFP)
A 12.0% monthly decline in what is usually a defensive corner of the market.
14. Zip Co. (ZIP)
Down 16.8% over the month as rate-sensitive fintechs face renewed pressure.
15. Abacus (ABG)
An 11.8% monthly fall, part of the wider sell-off in retail shopping centre landlords.
16. Adairs (ADH)
The homewares retailer dropped 16.1% over the month.
17. Australian Finance Group (AFG)
Down 13.8%, linked to slowing home-loan market dynamics.
18. Eagers Automotive (APE)
A 19.5% monthly fall as large discretionary auto purchases slow.
19. Autosports Group (ASG)
Down 15.2% over the month, facing the same headwinds as the broader automotive retail space.
20. MA Financial Group (MAF)
A 14.1% monthly pullback in the financial services sector.
21. Premier Investments (PMV)
The retail conglomerate fell 16.3% over the month.
22. Webjet (WJL)
Down 12.7% over the month, deepening a severe 62.3% one-year decline.
Run your own portfolio against these three sectors. If your holdings are concentrated in discretionary retail, property, or high-multiple tech, you are sitting exactly where the current macroeconomic squeeze is hitting hardest.
The macro reality behind the broader 65-stock sell-off
Widen the lens, and the 22 names above are just the sharpest edge of a much bigger move. A total of 65 companies were caught in the 10 September downtrend scan, spanning banking, retail, property, technology, travel, and media.
That breadth is the point. When repricing is happening across the entire exchange, individual stock picking alone cannot fully shield a portfolio.
Four core drivers explain the pressure:
The RBA tightening cycle that began earlier in 2026 has already delivered three consecutive hikes to 4.35%, and with trimmed mean CPI still above the target band, the market’s pricing of a November hike reflects a genuine continuation risk rather than speculative positioning.
- Oil and global yields: Oil climbed toward US$95-96 per barrel amid Middle East tensions, while global bond yields surged, pressuring equity valuations.
- RBA rate hike anxiety: Higher oil-driven inflation risk reinforced forecasts, including from Westpac, of a possible RBA rate increase by November 2026.
- Deteriorating sentiment: The Westpac-Melbourne Institute Consumer Sentiment Index fell 5.2% in September to 84.4, nearly 12% below its level a year earlier.
- Earnings and valuations: A retail-led earnings sell-off in mid-August compounded existing concerns that equities were mildly overvalued.
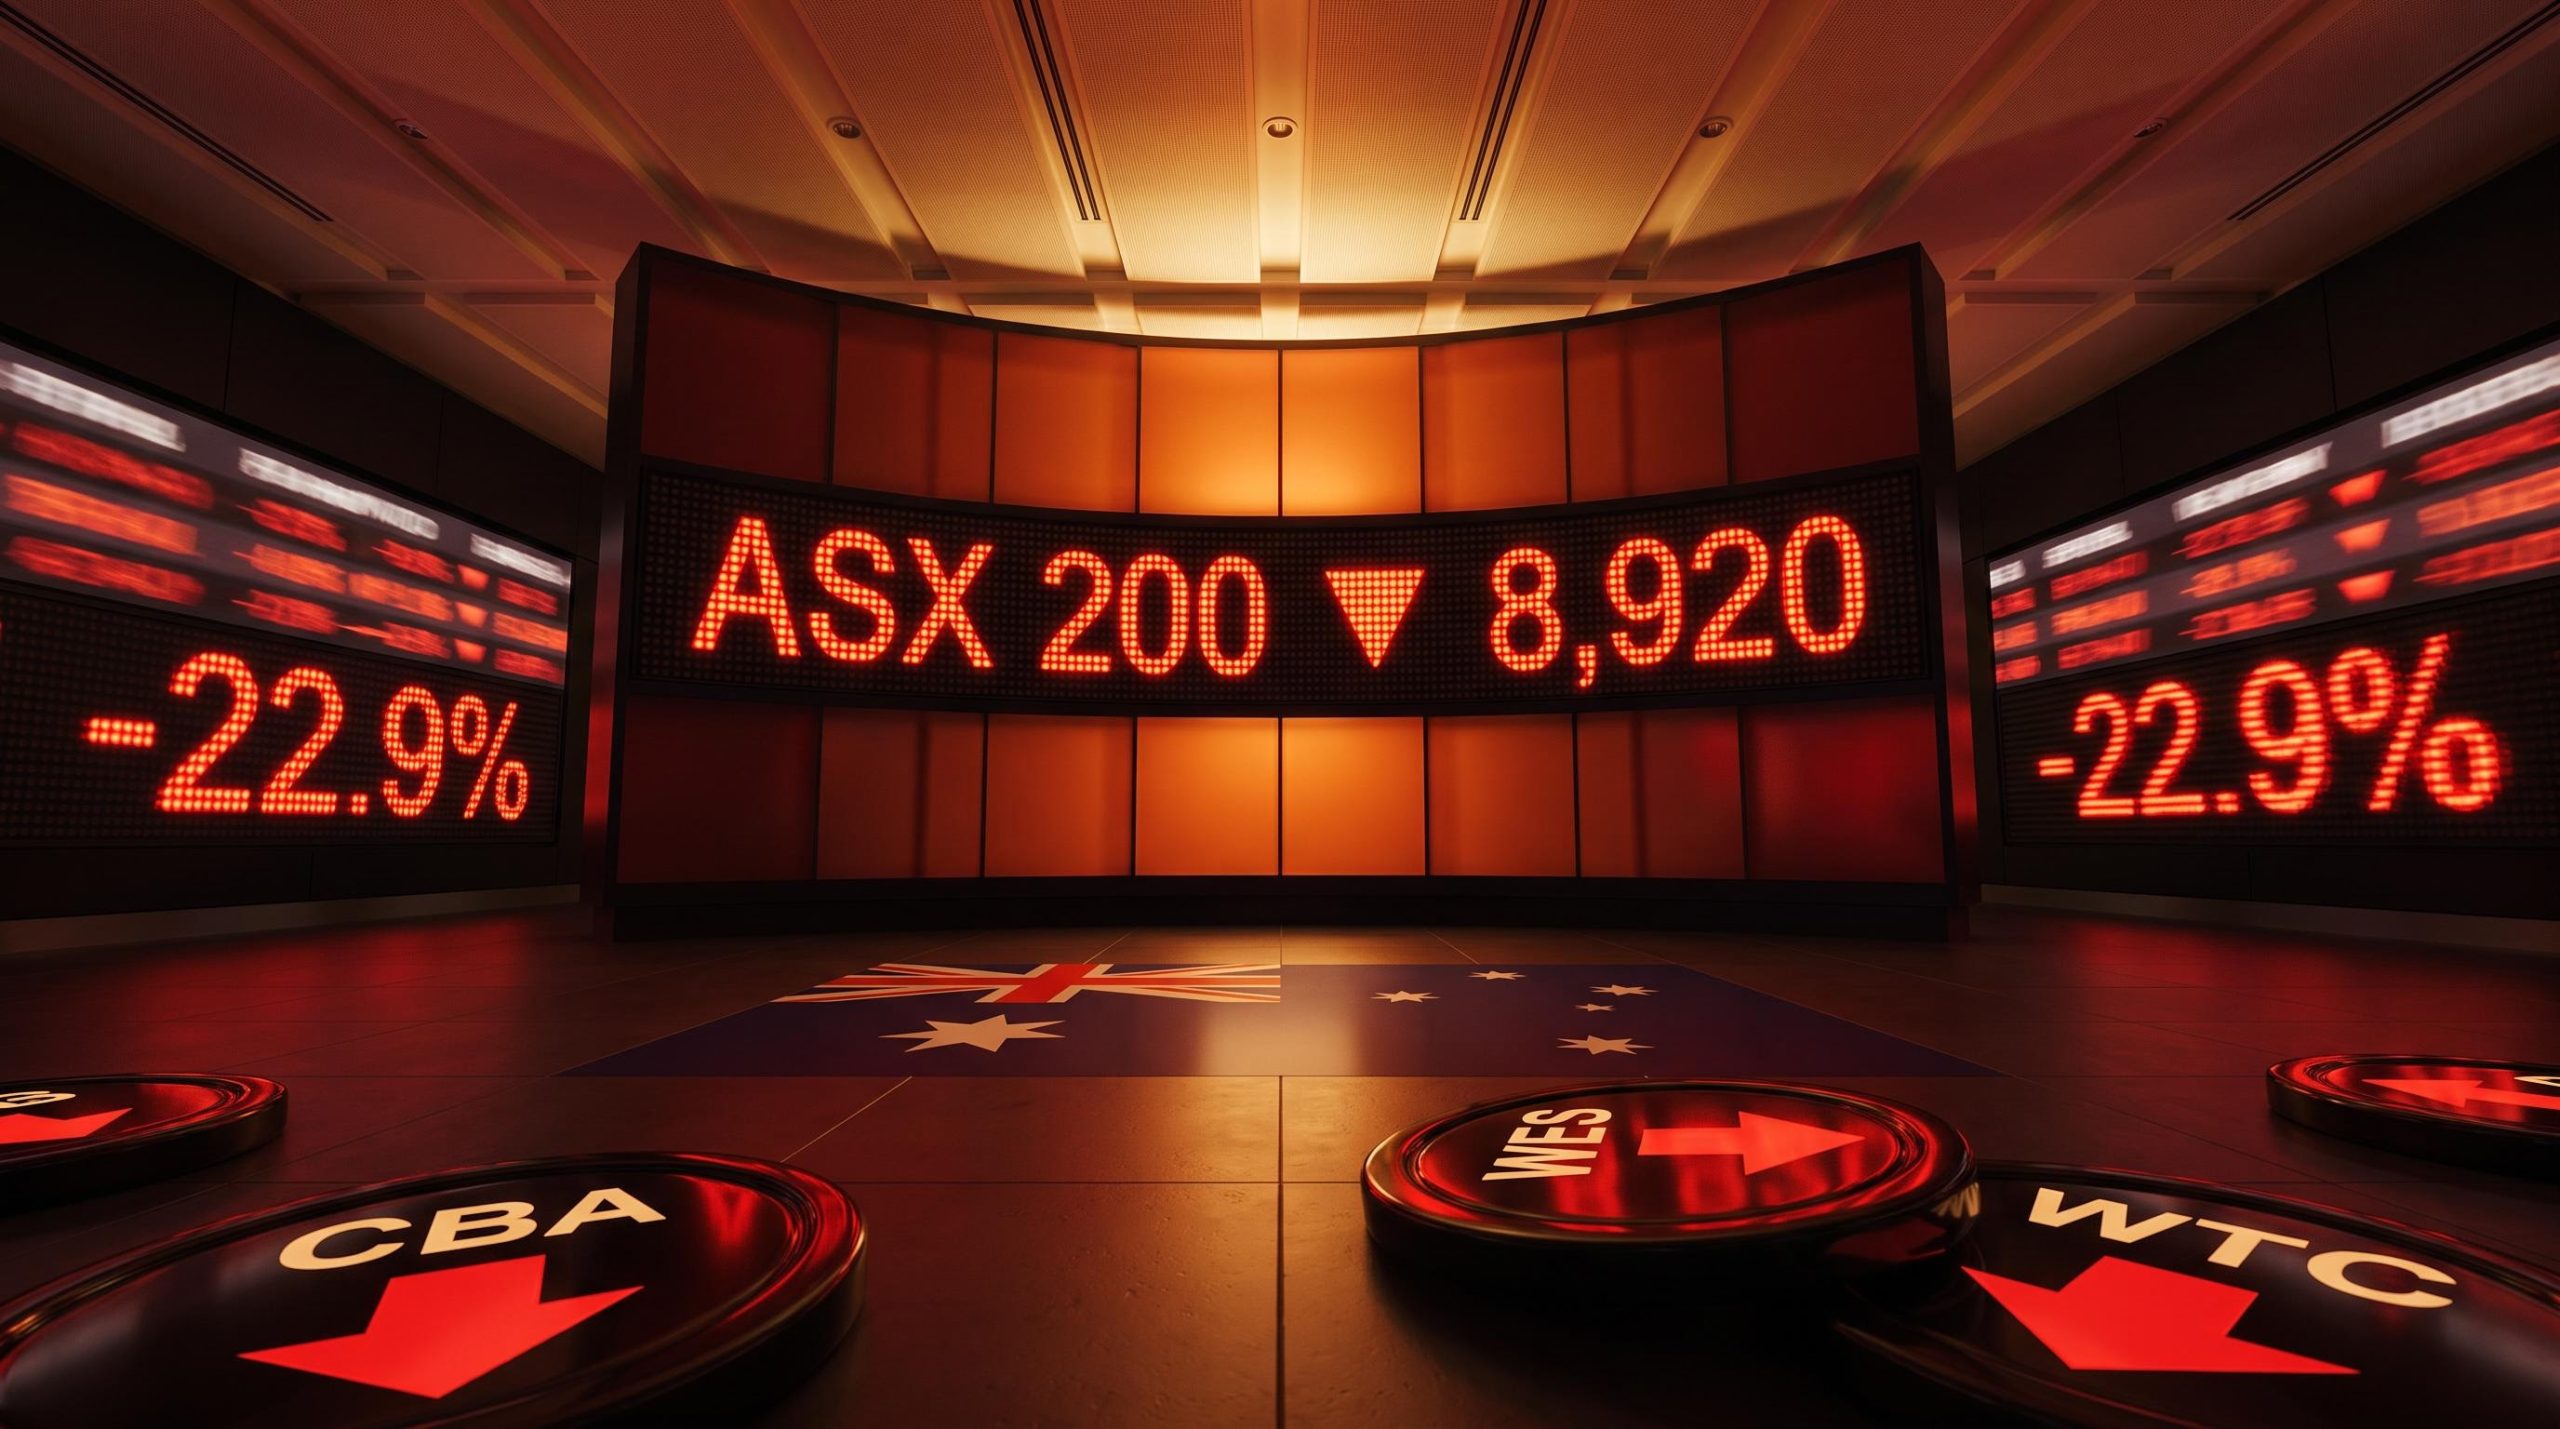
The index numbers make it concrete. On 8 September 2026, the ASX 200 dropped 90.1 points, closing near 8,920, its lowest finish in six weeks.
Here is a representative slice of the broader 65-stock list so you can see how the damage spreads across market caps.
| Company (Ticker) | Current Price | 1-Month Return | 1-Year Return |
|---|---|---|---|
| Commonwealth Bank (CBA) | $155.25 | -10.7% | -7.7% |
| Wesfarmers (WES) | $74.16 | -17.1% | -17.7% |
| REA Group (REA) | $155.36 | -12.3% | -34.8% |
| Qantas Airways (QAN) | $9.13 | -9.8% | -22.1% |
| IDP Education (IEL) | $1.57 | -29.6% | -70.4% |
| Kogan.com (KGN) | $3.28 | -30.4% | -15.2% |
| Lovisa Holdings (LOV) | $22.36 | -14.6% | -46.6% |
September is historically a volatile month for Australian equities. With the index still up roughly 2% year-to-date, market analysts have described this as a moderate correction, not a crash. That framing matters for how you position from here.
ASX 200 September seasonality is the most persistent negative pattern in Australian equities, with the index averaging a -0.65% return in the month since 2001 and posting losses in five consecutive recent years, which means the current selling pressure arrives on schedule rather than as a structural departure from historical norms.
Positioning defensively during the September market rotation
The technical scan and the fundamental economy are telling the same story from two directions. Momentum has broken across rate-sensitive sectors precisely because oil, yields, sentiment, and RBA anxiety are all pushing the same way at once.
The historical pattern offers a counterweight. The sectors showing the deepest technical damage now, technology and consumer discretionary, are the same ones that have traditionally participated most strongly in recoveries once monetary policy uncertainty recedes.
Prior ASX market cycles provide an instructive reference point here: in the 2022-2024 drawdown and recovery, Information Technology and Consumer Discretionary posted the sharpest initial declines before leading the subsequent recovery by the widest margins, a pattern that carries direct relevance for how investors read the current sector-concentrated selling.
That is why blindly selling on a lagging technical signal can be the wrong move. The scan tells you where momentum has turned, not where value ultimately sits.
The practical action is to review your own holdings against these macro themes. Ask whether you are comfortable holding quality businesses through a known cyclical correction, or whether your risk profile genuinely needs adjusting based on the RBA outlook.
This article is for informational purposes only and should not be considered financial advice. Investors should conduct their own research and consult with financial professionals before making investment decisions.
Past performance does not guarantee future results. Financial projections are subject to market conditions and various risk factors.