JB Hi-Fi shares have shed roughly 26% since the start of 2025, a decline steep enough to force a question that every investor watching Australian retail must eventually answer: is one of the country’s most recognised consumer brands now a bargain, or is the market telling a story that the share price has not yet finished writing?
The decline has not occurred in isolation. Australian household budgets remain under sustained pressure from elevated mortgage costs and persistent inflation, and the broader consumer discretionary sector has faced a structural reassessment by the market through 2025 and into 2026. For investors sizing their exposure to JB Hi-Fi, the distinction between a cyclical selloff and a genuine re-rating carries real capital consequences.
What follows is an evidence-based examination of the verified share price data, the company’s three-division operating structure, the macro forces weighing on the sector, and what the current price-to-sales ratio actually signals relative to JBH’s five-year valuation history. The goal is a framework for assessing whether the current price represents opportunity or overhang, not a verdict delivered without the reader’s participation.
From peak to trough: unpacking JBH’s 2025 share price slide
At the close on 15 May 2026, JB Hi-Fi shares traded at approximately $71.33. Against an early-2025 reference range of approximately $91-$96, the stock has lost more than a quarter of its value in roughly 16 months.
That headline figure deserves context before it becomes an investment thesis.
- Early 2025 reference price: approximately $91-$96
- Current price (15 May 2026 close): approximately $71.33
- Approximate decline: 26%, with the precise figure depending on the specific starting date used
- Broader context: Australian discretionary retail has underperformed the wider ASX through the same period, with household spending redirected toward essentials
Reference anchor: JBH closed at approximately $71.33 on 15 May 2026. All valuation multiples in this analysis are calculated from that price.
The magnitude of the fall is clear. What it means is not. A 26% decline could reflect a market correcting an overvalued stock toward fair value, or it could represent an overshoot on a fundamentally sound business caught in a cyclical downdraft. The rest of this analysis exists to interrogate which reading the evidence supports.
When big ASX news breaks, our subscribers know first
Three divisions, one stock: how JB Hi-Fi’s business actually works
Investors often treat JB Hi-Fi as a single-category electronics retailer. The group’s actual structure is broader than that assumption, and the distinction matters for how revenue and earnings should be read during a downturn.
JB Hi-Fi Group operates three core retail divisions spanning consumer electronics, home appliances, and commercial channels, supported by a network of over 340 stores across Australia and New Zealand. Founded in 1974, the company has expanded well beyond its original consumer electronics identity.
| Division | Primary product focus | Key demand driver |
|---|---|---|
| JB Hi-Fi Australia | Consumer electronics, gaming, audio, computing | Consumer discretionary spending, technology upgrade cycles |
| JB Hi-Fi New Zealand | Consumer electronics (NZ market) | NZ consumer confidence and discretionary budgets |
| The Good Guys / e&s | Whitegoods, home appliances, cooking, laundry | Housing turnover, renovation activity, replacement cycles |
The group also generates revenue through commercial, insurance, and education channels, providing some insulation from pure consumer foot traffic cycles. Revenue has expanded across the preceding three years, meaning the current selloff is not a story of top-line collapse.
The Good Guys and whitegoods exposure
The acquisition of The Good Guys in 2016 diversified JBH’s revenue base into whitegoods and home appliances, categories that carry different demand drivers to consumer electronics. Whitegoods demand is partly linked to housing turnover and renovation activity, giving The Good Guys a different cyclical profile to the JB Hi-Fi electronics banner.
On 9 September 2025, a court approved an agreement between the ACCC and The Good Guys. The existence of the agreement is confirmed through JBH’s investor announcements page, though the specific financial impact warrants investigation by investors conducting detailed due diligence.
Why Australian households are spending less on the things JBH sells
The headwinds facing JB Hi-Fi are not primarily about management execution. They are structural and sector-wide, a distinction that carries direct implications for when a recovery could materialise.
The Reserve Bank of Australia (RBA) maintained the cash rate at restrictive levels through 2024 and into 2025. RBA statements through early 2025 were explicit about the pressure this was placing on consumers.
Australian inflation data through March 2026 showed headline CPI surging to 4.6%, nearly double the top of the RBA’s 2-3% target band, a reading that crystallised the central bank’s case for continued tightening and directly extended the period during which household discretionary budgets face compression.
RBA, through early 2025: The central bank acknowledged “considerable pressure on household budgets” and weak per-capita consumption growth, linking restrictive monetary policy directly to reduced discretionary retail spending.
Australian Bureau of Statistics (ABS) retail trade data through 2025 confirmed the pattern: flat to modest growth in overall retail turnover, with discretionary categories underperforming essentials as households redirected spending toward necessities.
ABS retail trade data for January 2025 recorded a 4.4% fall in household goods retailing, one of the sharpest single-category contractions in the release, confirming that discretionary spending on the products JBH sells was under measurable pressure before the broader rate cycle began to ease.
Three macro headwinds are compounding simultaneously:
- Restrictive rate environment and household budgets: High mortgage repayments, elevated rents, and energy costs have forced spending reallocation away from discretionary categories
- Post-COVID demand normalisation: Pandemic-era purchases of electronics and appliances pulled forward future demand, leaving a softer replacement cycle through 2024-2026
- Promotional intensity and margin pressure: Retailers have competed for subdued consumer demand through increased discounting, compressing margins even where revenue has held
Investors who attribute JBH’s decline solely to company-level execution risk may be underestimating how much of the headwind is systemic. If the environment, rather than management, is the primary constraint, then the timing of any recovery depends more on RBA policy and consumer confidence than on operational changes within JBH’s control.
What the price-to-sales ratio tells you (and what it does not)
Before applying a valuation lens to JBH’s current share price, it is worth understanding exactly what that lens can and cannot show.
The price-to-sales (P/S) ratio measures how much investors are paying for each dollar of a company’s revenue. It is calculated by dividing a company’s market capitalisation by its trailing twelve-month revenue. A P/S of 1.0x means investors are paying $1 for every $1 of annual sales the company generates.
Comparing a company’s current P/S to its own five-year historical average is more informative than comparing it to a sector or market average. The historical comparison controls for the company’s specific business model, margin profile, and growth characteristics, isolating whether the market is pricing the stock more optimistically or pessimistically than has been typical.
- Calculate the current multiple: Divide the company’s current market capitalisation by trailing twelve-month revenue
- Identify the historical average: Take the average P/S over the preceding five years to establish a baseline
- Assess the premium or discount: A reading above the five-year average implies investors are paying more per dollar of sales than has historically been typical; a reading below suggests they are paying less
Where P/S ratios fall short
The P/S ratio does not capture profitability, margin compression, or debt. A company can appear cheaper on a P/S basis over time even as investment risk increases, because revenue may hold while margins collapse.
In JBH’s case, revenue has grown over the preceding three years. This means the current P/S premium relative to the five-year average is not driven by revenue contraction, an important clarification. The elevated multiple reflects market expectations about future earnings power, not a declining top line.
Investors seeking a more complete valuation picture should layer the P/S with earnings-based multiples such as the price-to-earnings (P/E) ratio, and, where full-year results permit, a Discounted Cash Flow (DCF) model or Dividend Discount Model.
Earnings-based multiples such as P/E and EV/EBITDA each correct specific blind spots that a revenue-only metric like P/S cannot address, including the effect of margin compression, capital structure differences, and one-off item exclusions that can make reported net profit an unreliable signal of underlying business economics.
JBH’s valuation at $71.33: premium, fair, or a trap?
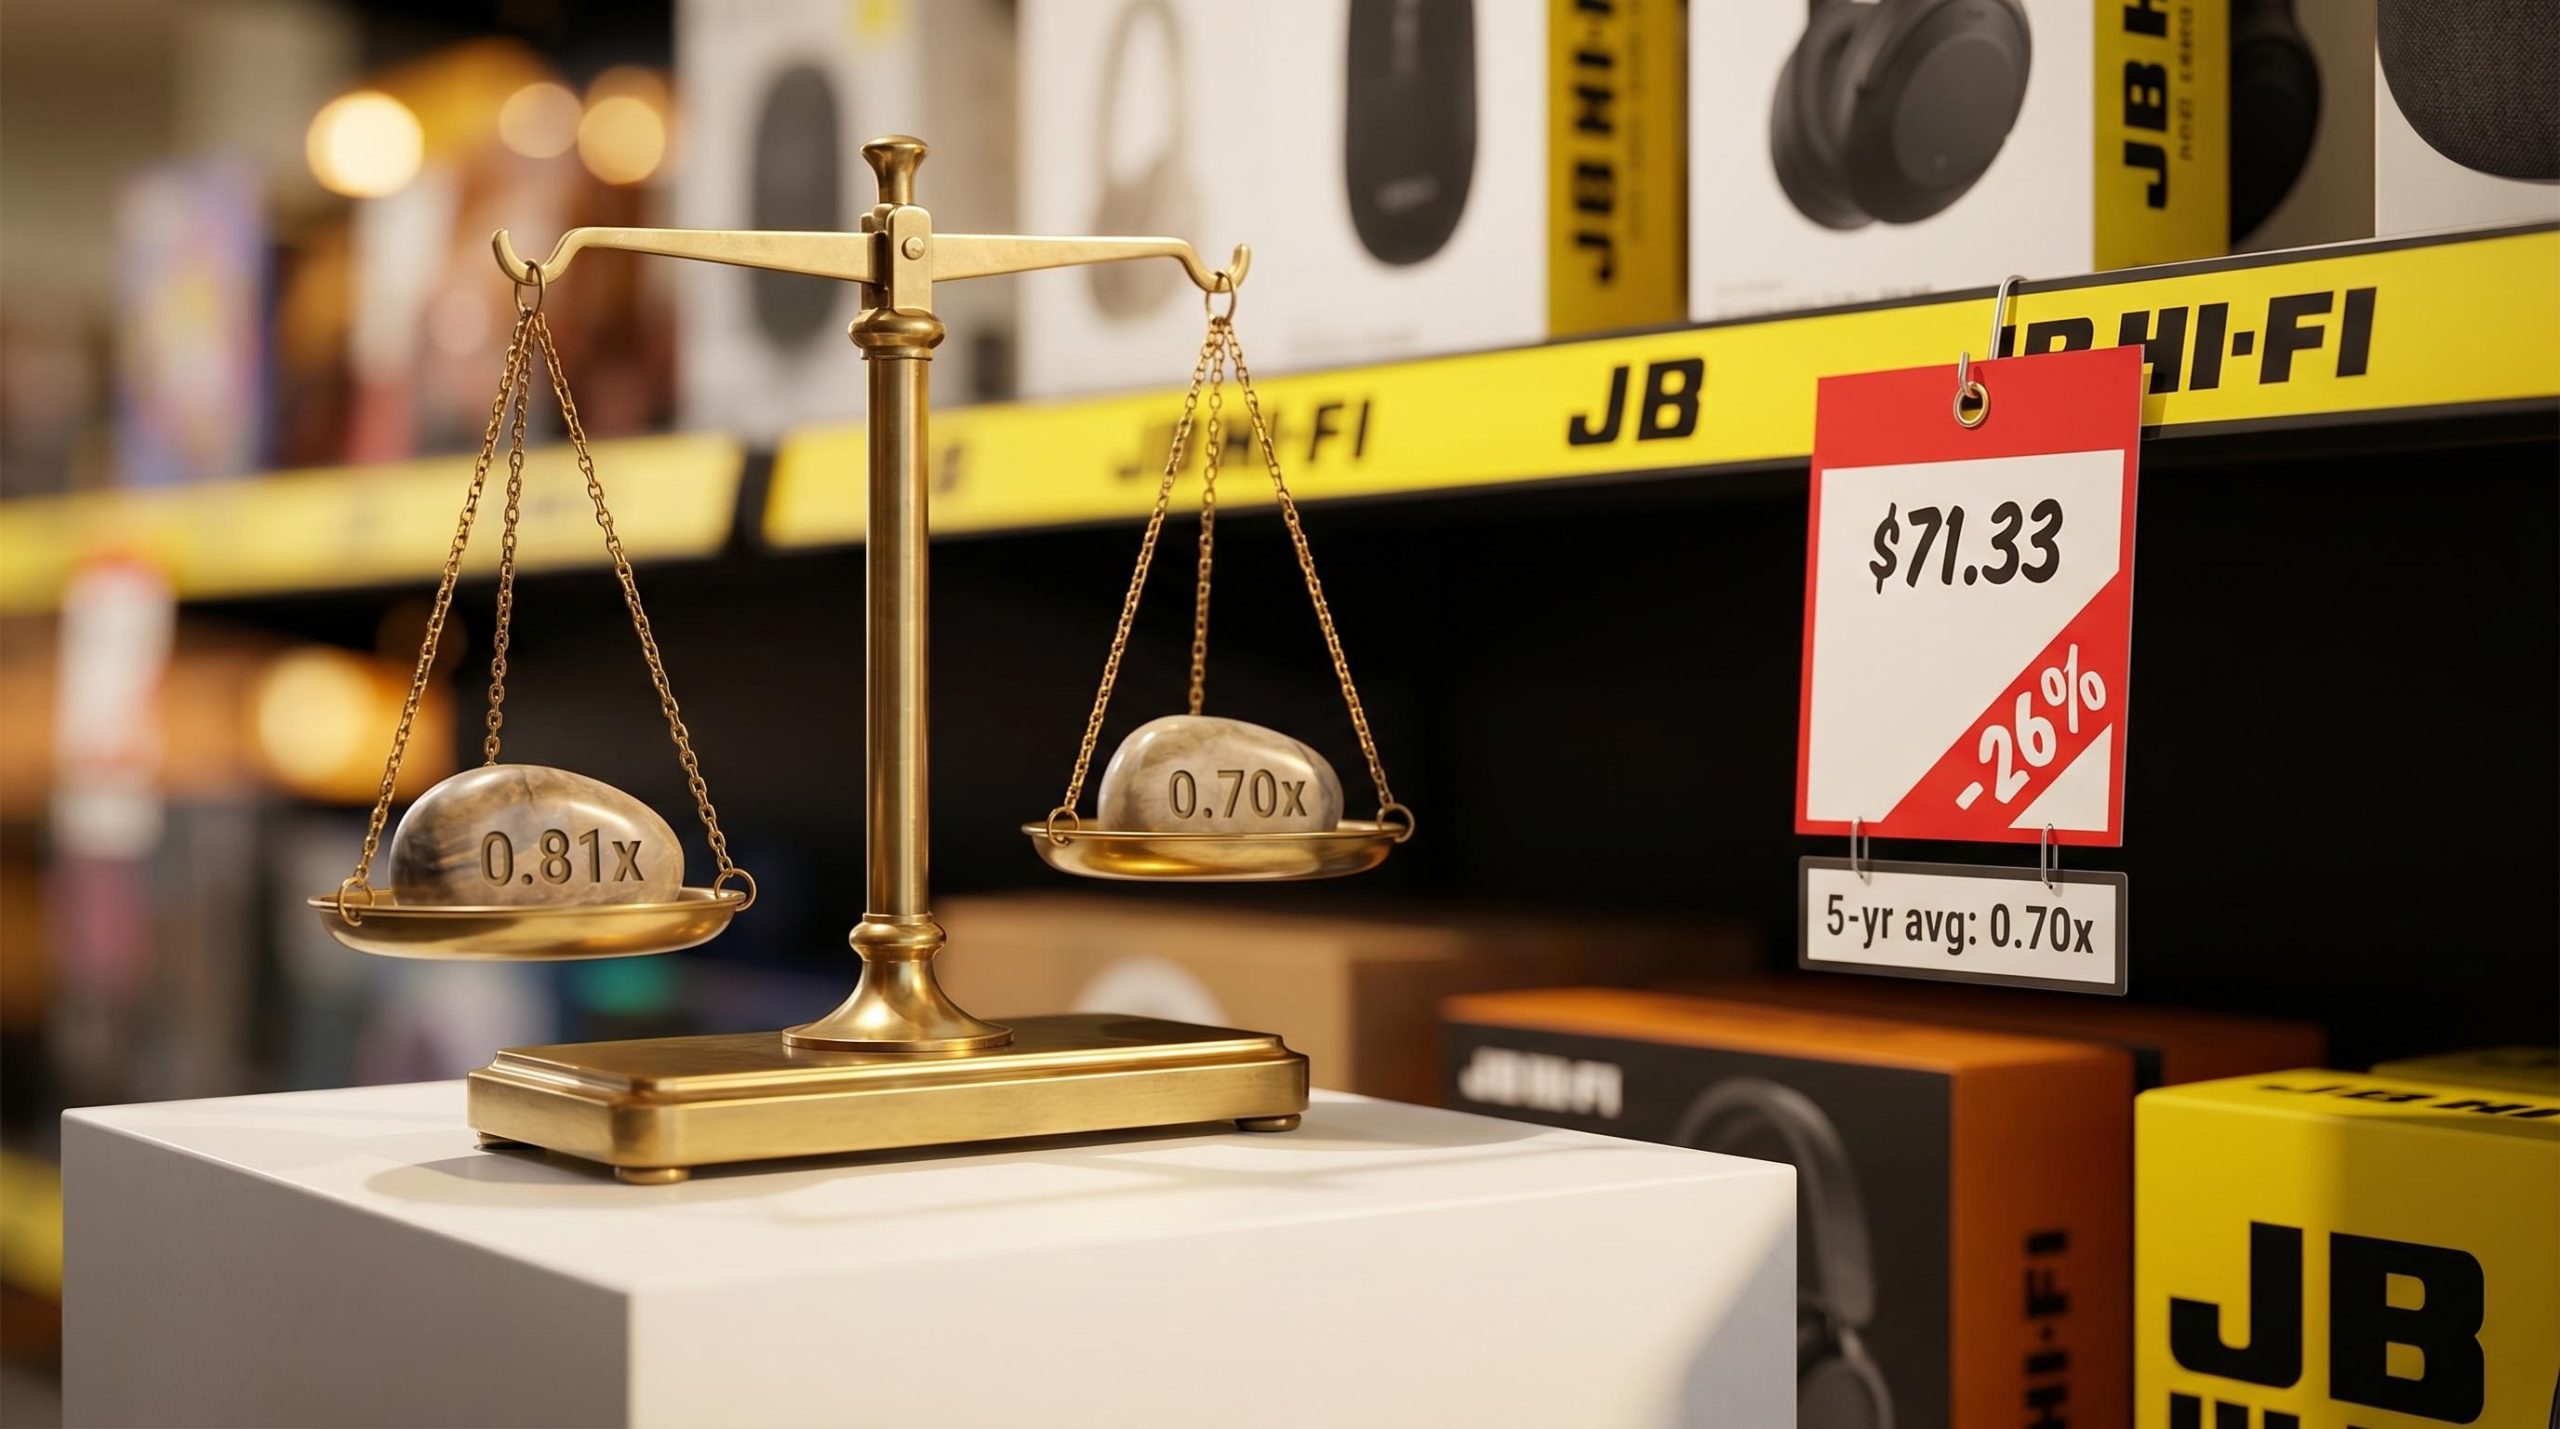
At a share price of approximately $71.33, JB Hi-Fi carries a price-to-sales ratio of approximately 0.81x. The five-year historical average sits at approximately 0.70x.
| Metric | Current | Five-year average | Premium to average |
|---|---|---|---|
| Price-to-sales ratio | 0.81x | 0.70x | ~16% |
“At 0.81x sales, JBH is still trading above its five-year average of 0.70x, even after a decline of roughly 26% since the start of 2025.”
In plain terms, investors are still paying more per dollar of JBH’s sales than has historically been typical. A 26% share price decline sounds dramatic, yet the valuation multiple has not compressed to the levels that value-oriented investors typically associate with a historically cheap entry point.
The counterpoint is real. If revenue continues to grow and margins stabilise as the rate cycle turns, the premium may be justified by a higher earnings base rather than irrational optimism. JBH’s brand strength, pricing discipline, and multi-division revenue diversification could reasonably command a premium to the historical average even in a softer environment.
The tension is worth holding rather than resolving prematurely. The selloff has compressed the multiple from peak levels, but the current reading sits in a middle ground: cheaper than six months ago, yet not yet at the discount that historical data associates with strong forward returns. Revenue growth over the preceding three years confirms the premium is not a revenue-collapse artefact, which narrows the question to margin trajectory and earnings power over the next 12-18 months.
Past performance does not guarantee future results. Financial projections are subject to market conditions and various risk factors.
A selloff with unfinished business: what investors should monitor next
The valuation question for JB Hi-Fi will not be resolved by today’s data alone. Several specific releases and macro developments will test whether the current price reflects an appropriate discount or continued overvaluation.
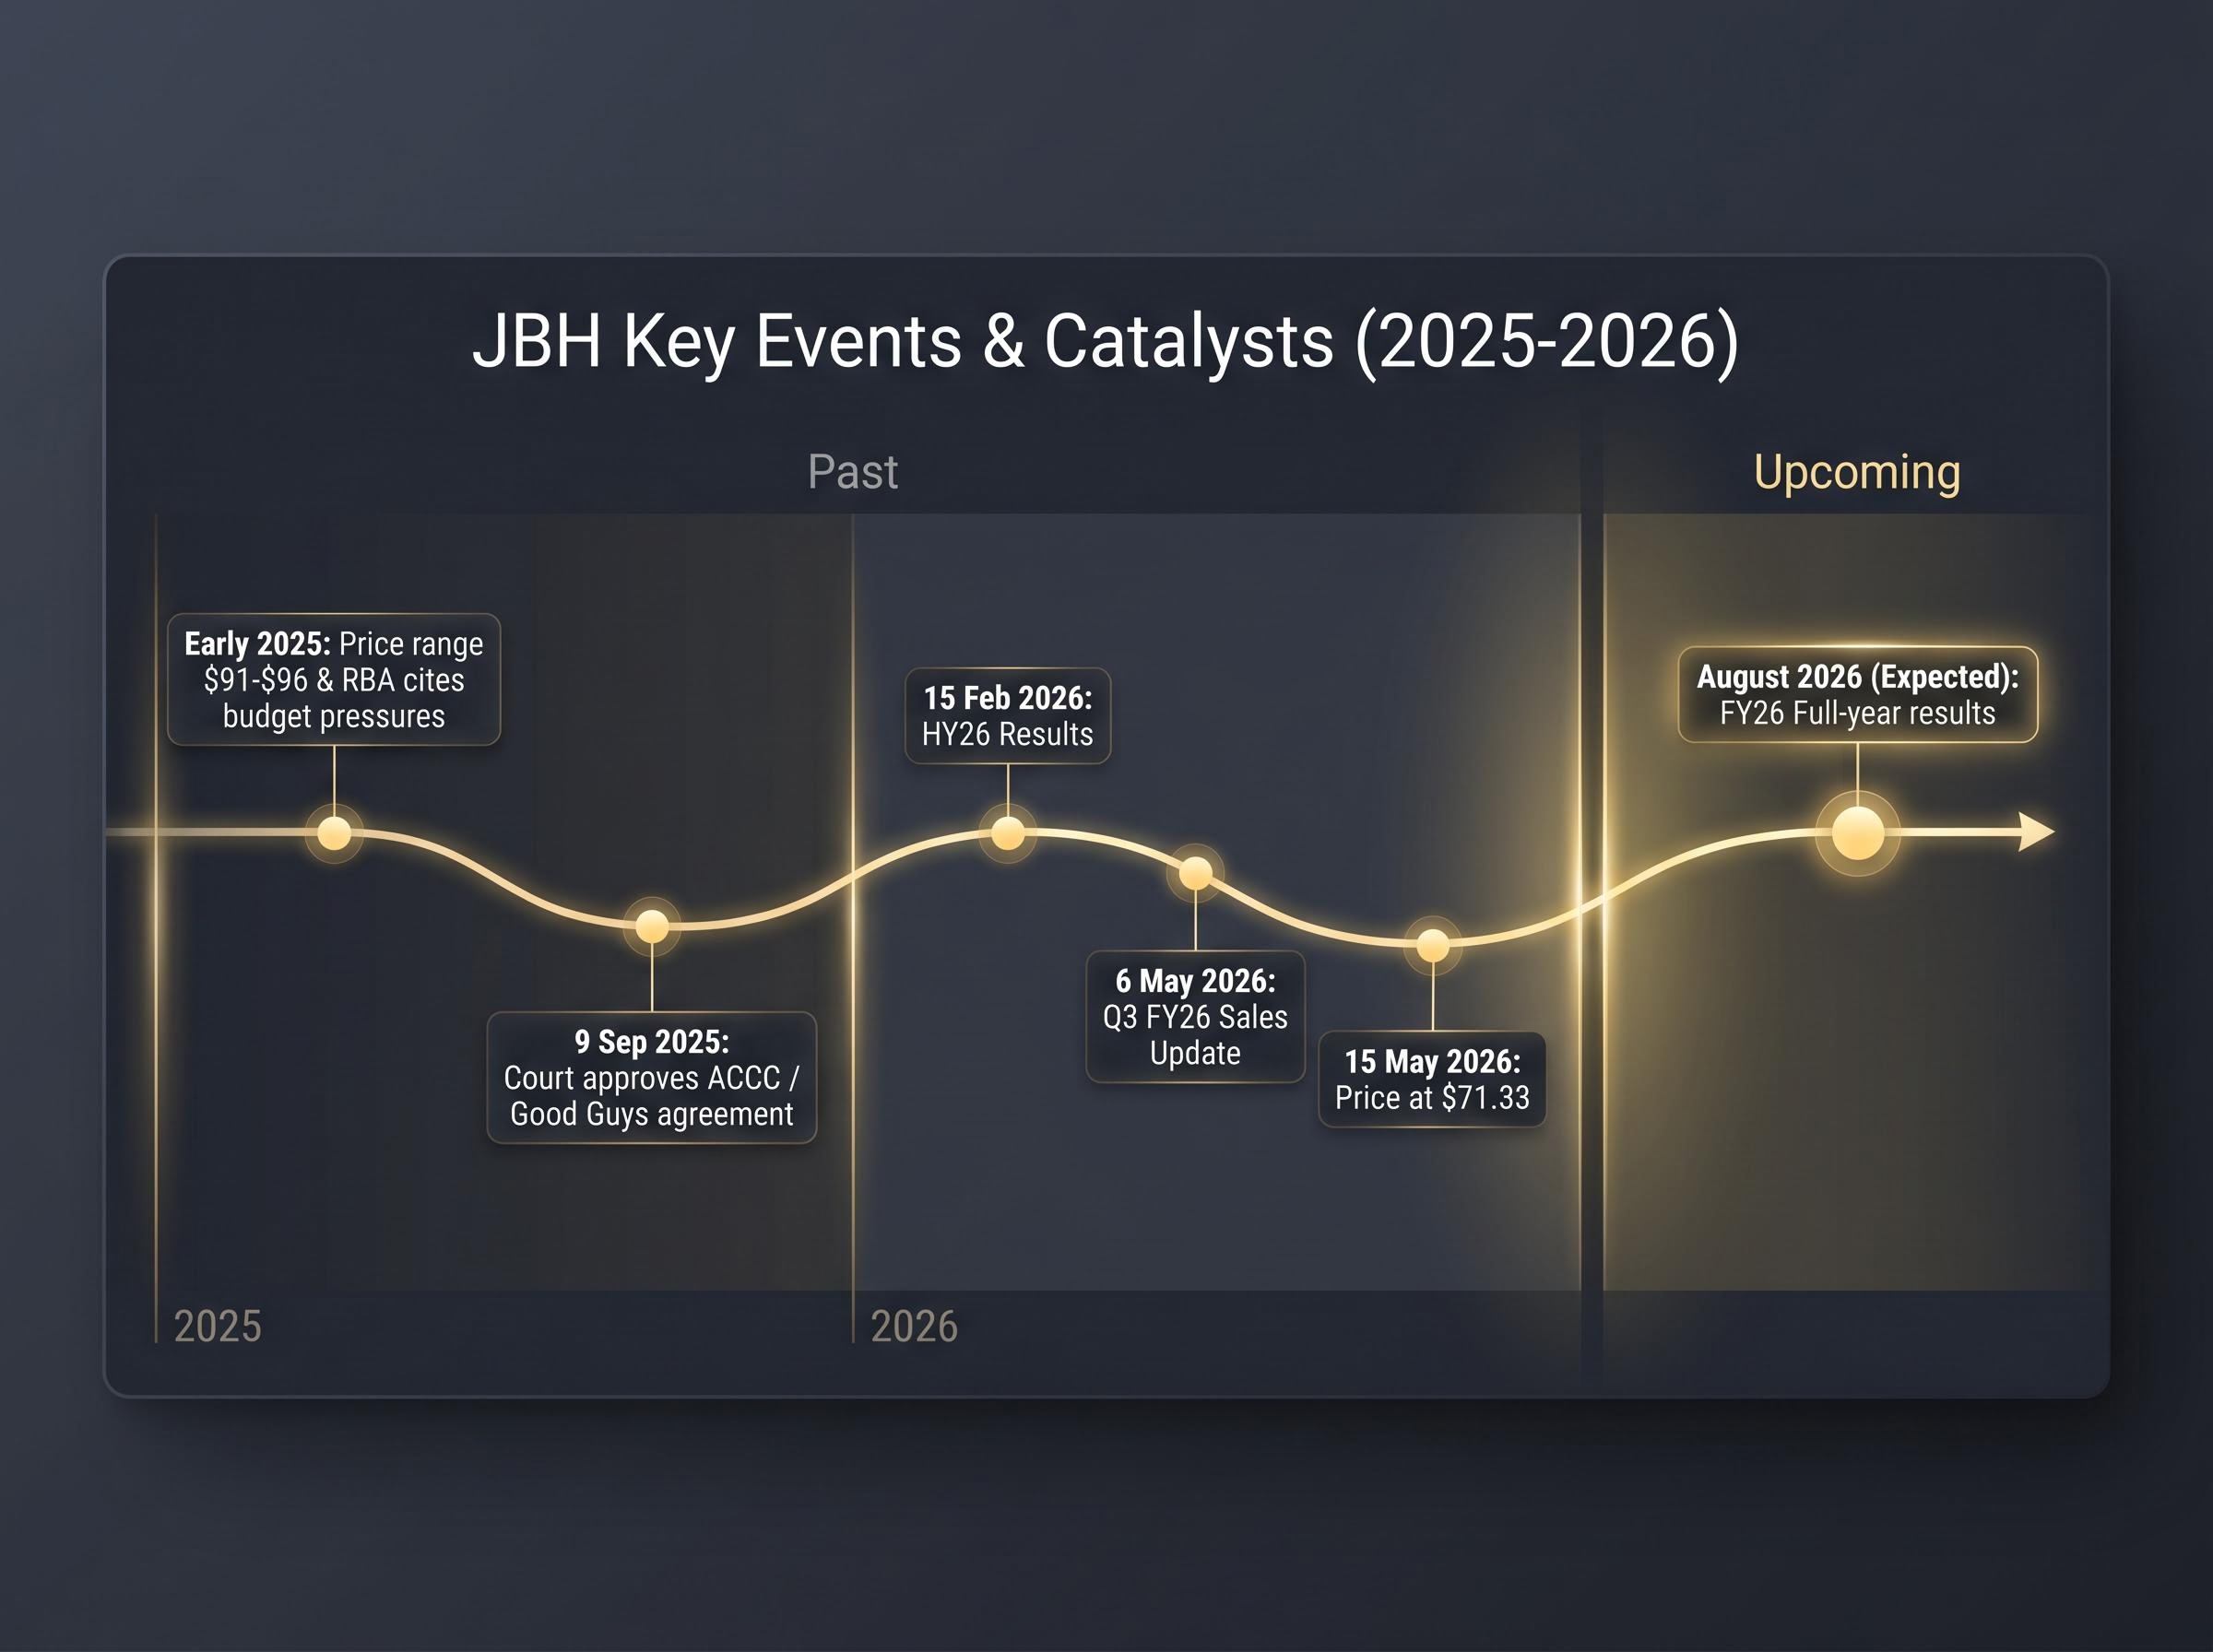
- FY26 full-year results (expected approximately August 2026): The single most consequential data release. Full-year revenue, margins, and earnings guidance will determine whether the P/S premium is supported by earnings growth or exposed as misplaced optimism.
- RBA rate decisions through H2 2026: Any shift in the cash rate directly affects household discretionary budgets and, by extension, JBH’s revenue trajectory.
- Housing turnover data: Drives whitegoods and appliance demand through The Good Guys, making it a lead indicator for divisional performance.
- Valuation trigger: Monitor whether the P/S ratio reaches or falls below the five-year average of 0.70x, which would represent a historically more attractive entry point.
RBA rate decisions through the remainder of 2026 carry particular weight for JBH’s recovery timeline: futures markets were pricing one further 25 basis point hike by December 2026 as of early May, which would lift the terminal cash rate to approximately 4.68% and extend the pressure on household discretionary budgets beyond the current reporting cycle.
What the Q3 FY26 update signals
The Q3 FY26 Sales Update, released on 6 May 2026, provides the most recent operational data available. Quarterly trading updates from JBH typically include sales and like-for-like growth trends by division, though they do not carry profit or margin disclosures.
The HY26 Half Year Results, released on 15 February 2026, offer the most recent profitability data. Together, these two releases frame near-term expectations heading into full-year reporting season. Investors should assess whether the Q3 update confirmed the existing trend of softness across discretionary retail or showed early signs of stabilisation.
JBH at a crossroads: cheap enough to buy, or not yet cheap enough to matter?
A 26% decline sounds like the market creating an opportunity. A P/S ratio still trading approximately 16% above the five-year historical average suggests the repricing has further to run before JB Hi-Fi reaches historically attractive territory.
That does not mean the stock is overvalued. JBH’s structural strengths, including brand recognition, pricing discipline, a diversified multi-division revenue base, and a network of over 340 stores, are reasons the market may be willing to pay a premium to historical averages even in a softer environment. The question is whether the current premium is justified by forward earnings power or is a residual from a more optimistic period that the market has not yet fully unwound.
Investors seeking a more complete answer should layer the P/S analysis with earnings-based multiples and a DCF framework once FY26 full-year results are available, and should consult broker research for target price context. The P/S ratio is a starting point, not a conclusion.
For investors wanting to move beyond the P/S screen and build the full valuation picture the article recommends, our dedicated guide to share valuation methods for ASX stocks walks through a structured five-step sequence covering P/S, EV/EBITDA, DCF, and DDM, with a worked example showing how a low P/S ratio on a debt-carrying retailer can create the illusion of cheapness that earnings-based analysis quickly corrects.
The FY26 full-year result, expected around August 2026, will be the genuine test. It will show whether JBH’s earnings power has contracted in line with the share price, or whether the business has absorbed the macro headwinds with its margin structure more intact than the market assumed. Until then, the data supports watchfulness over conviction in either direction.
This article is for informational purposes only and should not be considered financial advice. Investors should conduct their own research and consult with financial professionals before making investment decisions.