The U.S. services sector just posted its strongest reading since February, and rather than offering relief, the data landed like a door closing on rate cut expectations. One report, released 3 September 2026, moved the analytical consensus measurably closer to the view that the Federal Reserve’s next move is a hike, not a cut.
The August ISM Services PMI came in at 55.4, beating expectations and extending an unbroken 26-month expansion streak in the sector that drives roughly three-quarters of U.S. economic output.
The release arrived less than a week after Fed Chair Kevin Warsh used his Jackson Hole platform to warn that inflation remains too high and that rate increases may be necessary in coming months. The two signals are now reinforcing each other in a way that has materially repriced the futures market.
This analysis maps the data, the speech, and the transmission mechanism between them, so you can read the current services PMI and Fed policy environment clearly rather than being pulled between the conflicting interpretations now circulating. It also surfaces where the hawkish consensus is genuinely fragile, because that is where the next repricing is most likely to occur.
What the August services data actually showed
At 55.4, the headline figure did more than clear the 50-mark that separates expansion from contraction. It rose from 54.1 in July, marked the highest reading since February, extended the services sector’s run of expansion to 26 straight months, and came in stronger than economists had penciled in. In isolation, a strong services number is good news. In the current context, it is a problem for anyone hoping monetary conditions are about to ease.
The comparison with the same week’s manufacturing print sharpens the point. ISM’s manufacturing survey underperformed expectations, with weak internal components. That divergence matters because the part of the economy accelerating here is the one that carries the most weight in the inflation picture, not the goods-producing side that has already cooled.
The sub-index split that markets focused on
The headline number is less useful than what sits underneath it, and the internal composition is where the hawkish read comes from.
| Sub-index | August 2026 | July 2026 | Directional context |
|---|---|---|---|
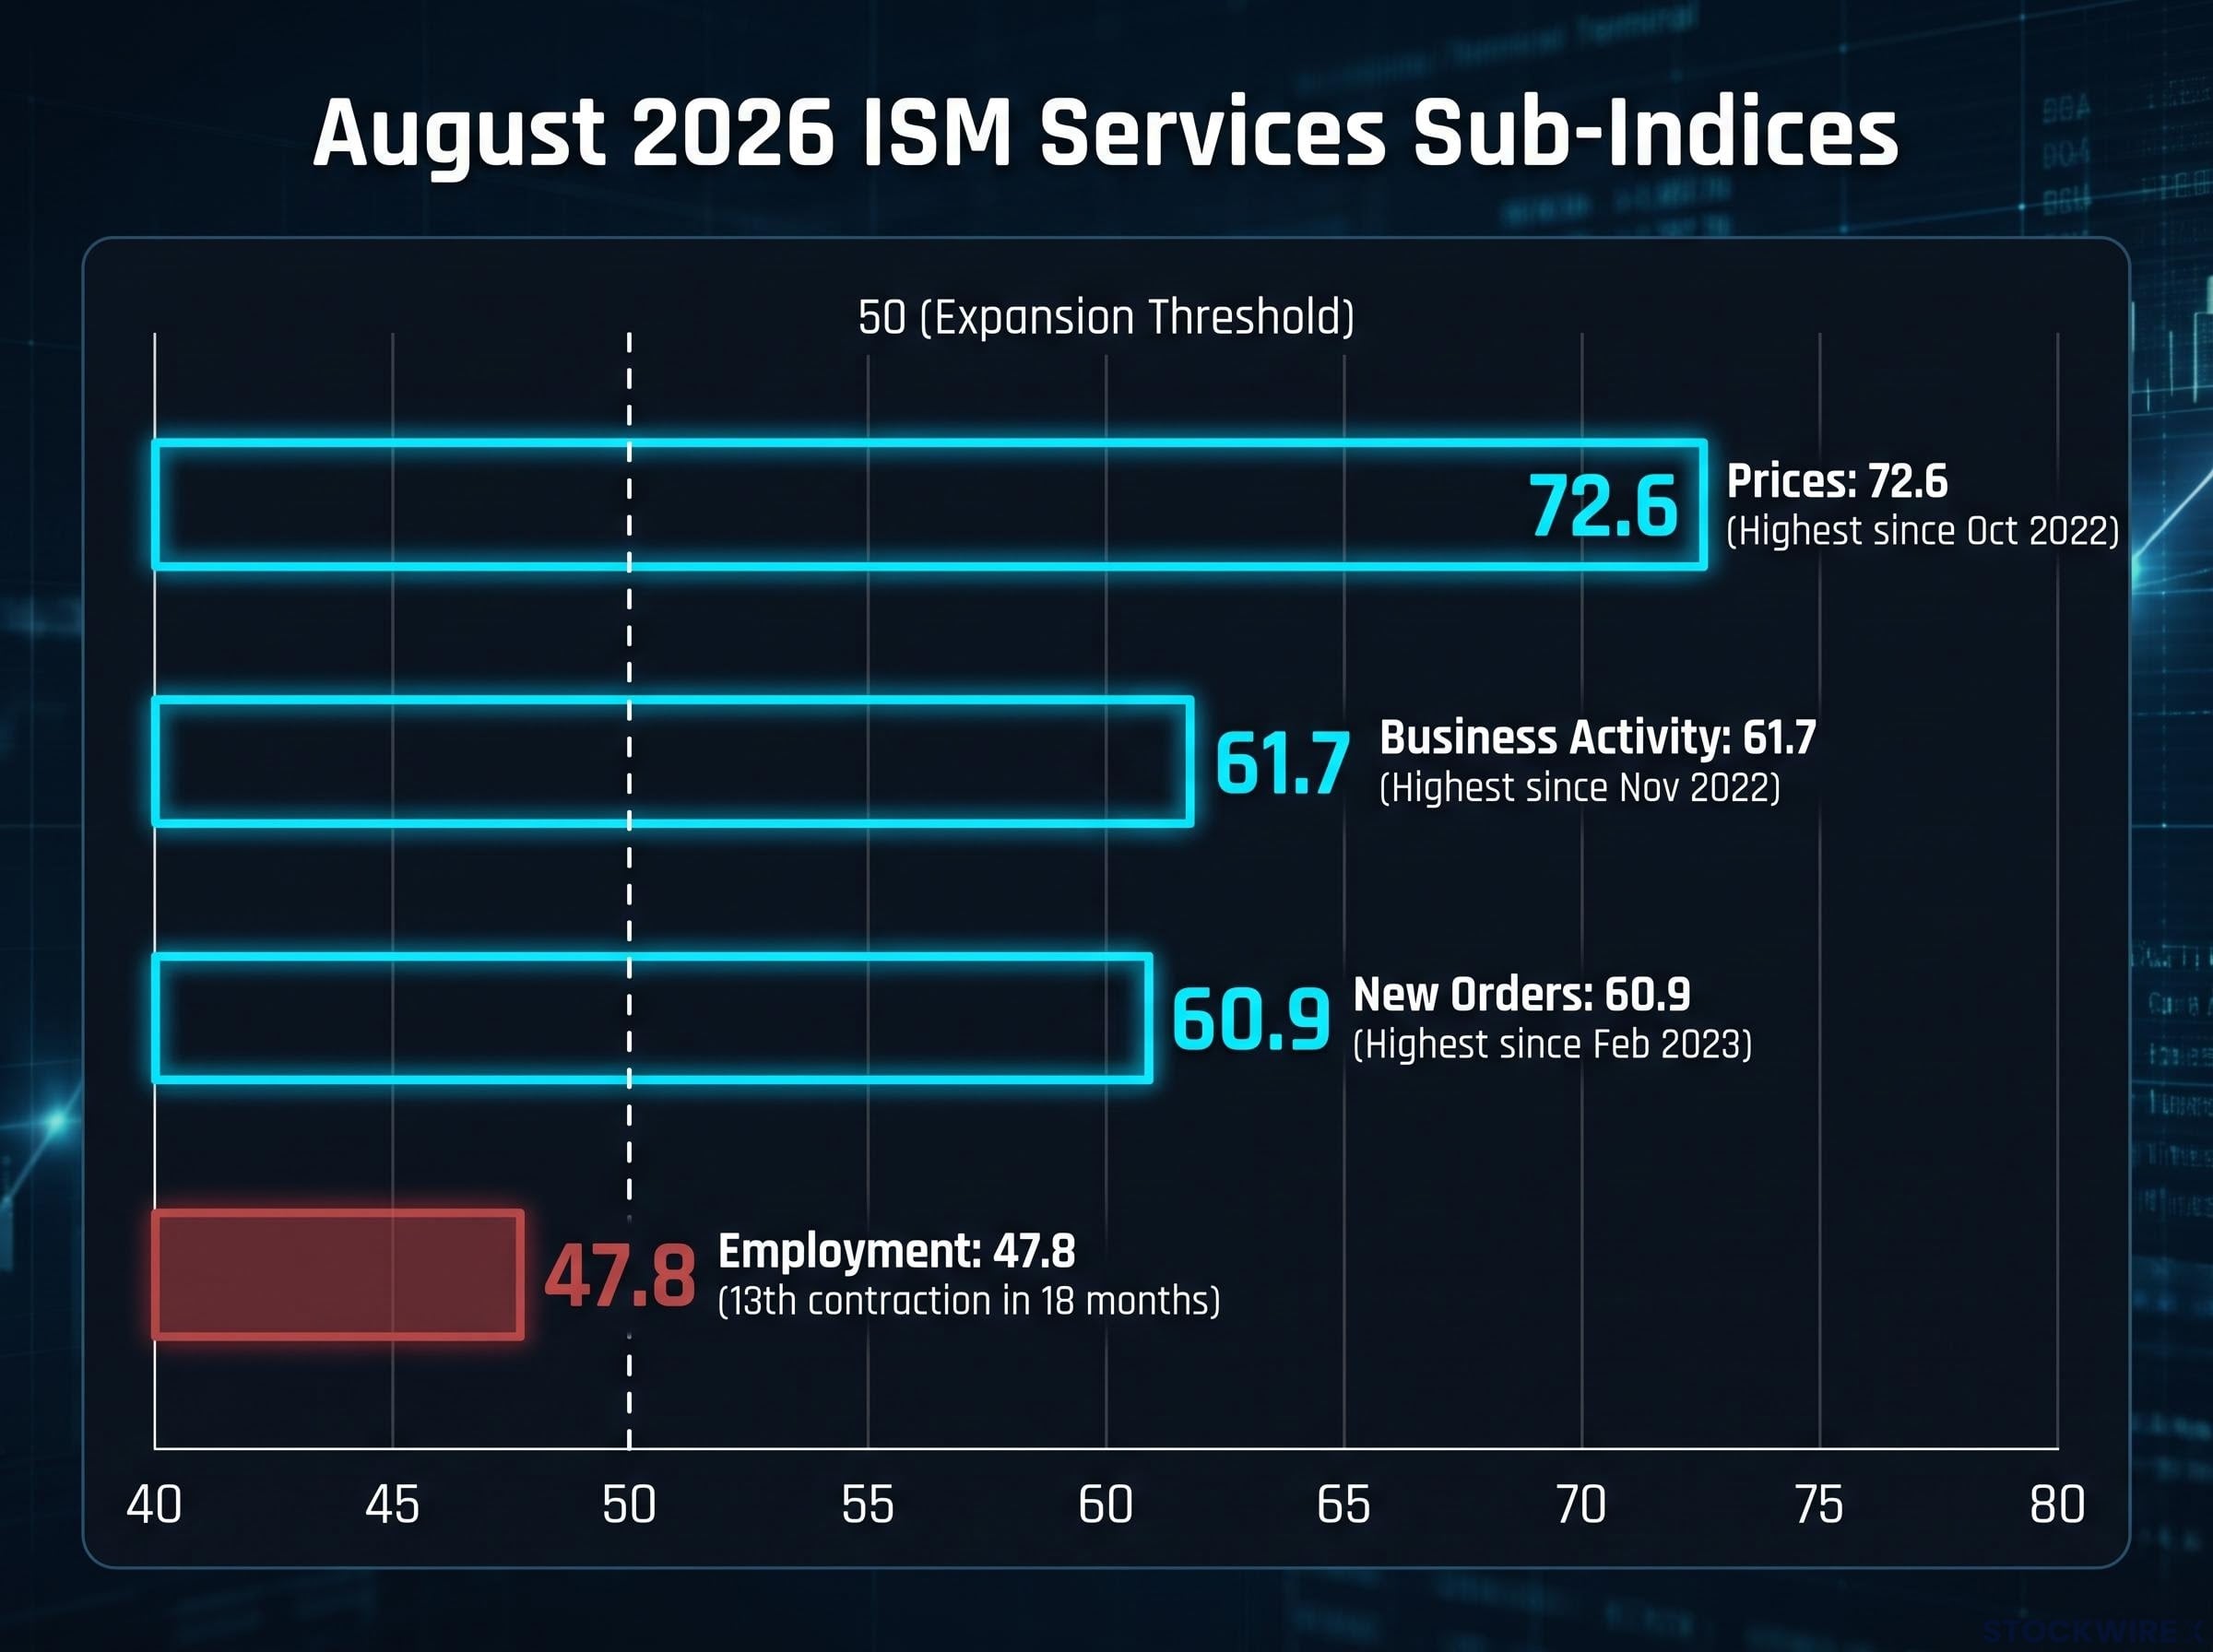
| Business Activity | 61.7 | 59.1 | Highest since November 2022 |
| New Orders | 60.9 | 57.2 | Highest since February 2023 |
| Prices | 72.6 | 70.3 | Highest since October 2022 |
| Employment | 47.8 | 47.4 | 13th contraction in last 18 months |
Business Activity at 61.7 and New Orders at 60.9 are both at multi-year highs. These are forward-looking demand indicators, and their strength signals that the largest part of the economy is not just holding up but accelerating.
The Prices Index is the inflation-direct reading, and at 72.6, up 2.3 points from July, it sits at its highest level since October 2022. ISM’s own characterisation amplified the hawkish interpretation.
The Prices Index “offered no relief,” per ISM’s August Services report.
Then there is Employment at 47.8, in contraction for the 13th time in the last 18 months. This is the complicating undercurrent. Demand is hot and getting hotter, and pricing power is intact, yet the labour channel that usually drives services inflation is not confirming that story. Hold onto that tension. It becomes the fault line in the hawkish case later.
When big ASX news breaks, our subscribers know first
How Warsh’s Jackson Hole speech changed the rate hike calculus
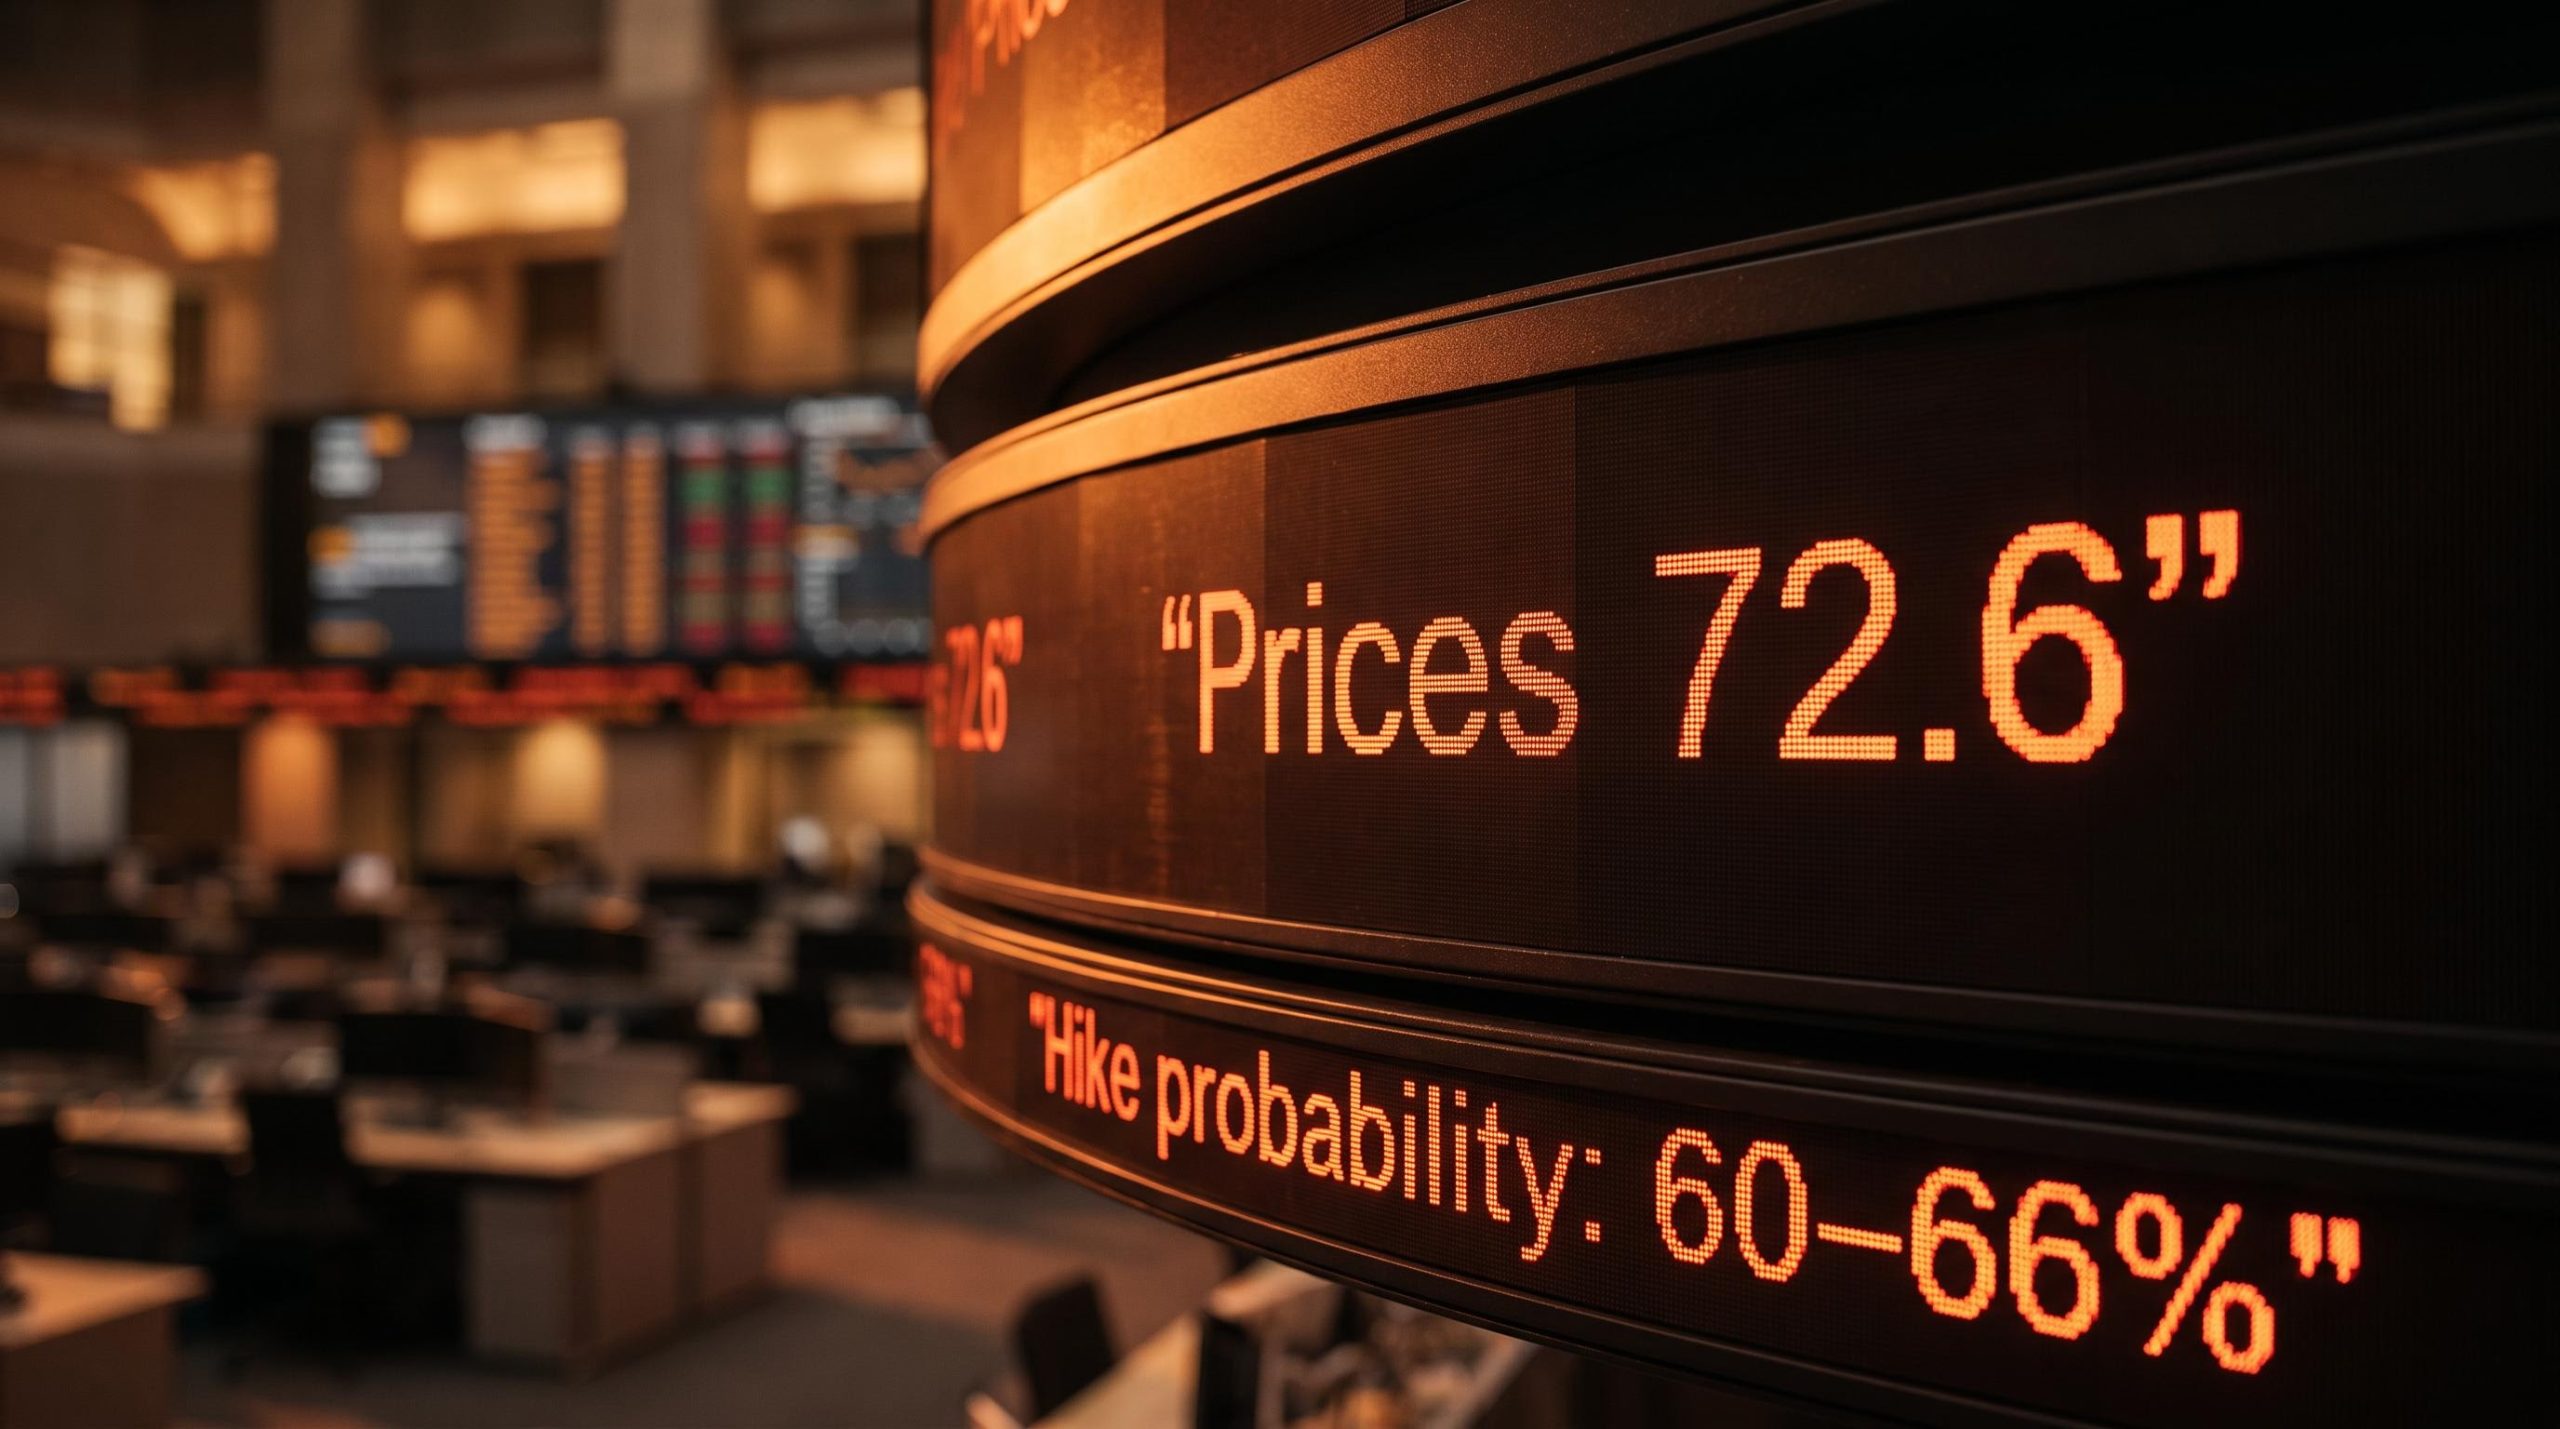
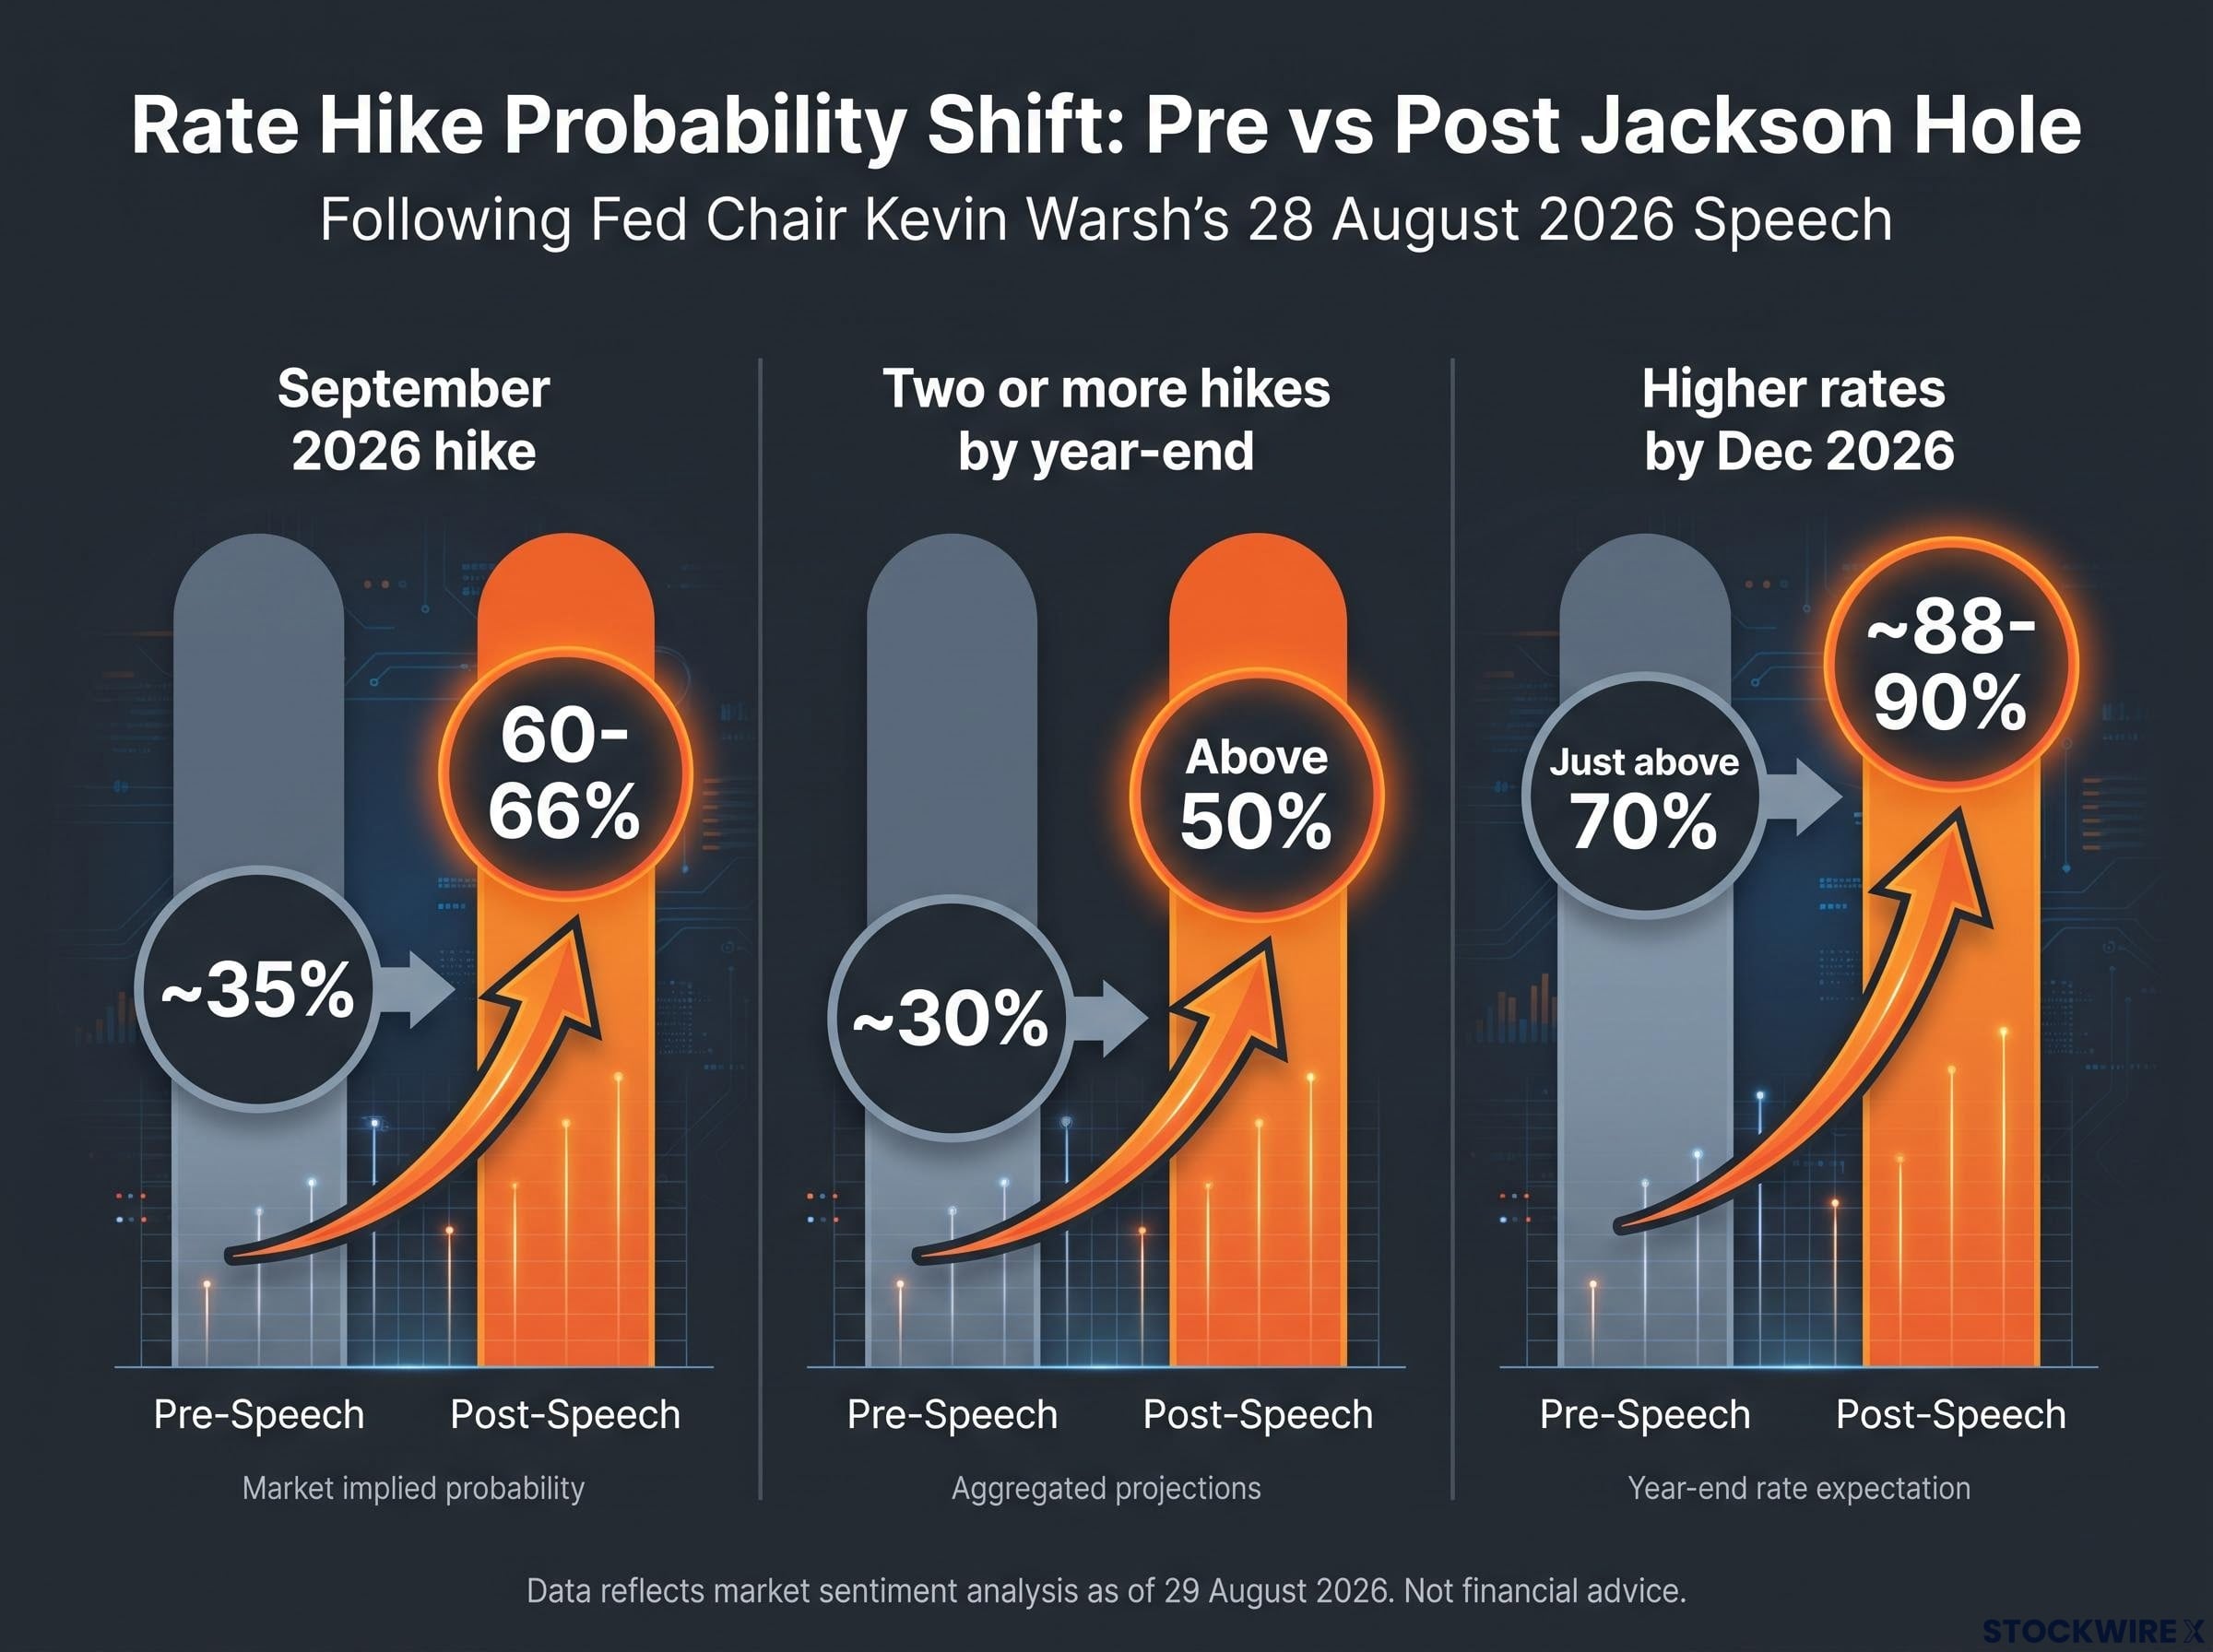
The clearest evidence of how markets read Warsh’s remarks is in the futures pricing. Before he spoke, the probability of a September hike sat at roughly 35%, according to CME FedWatch. Within days, that figure had moved to a range of 60-66%. The odds of two or more hikes before year-end climbed from around 30% to above 50%. That is a near-doubling of hike odds from a single speech.
What did Warsh actually say to move markets that far? Delivered on 28 August 2026, the remarks were sharper than his prior communications. Warsh, who took office as Fed Chair on 22 May 2026, framed the economy around two facts.
Inflation is “still too high,” Warsh said, and the Fed “may have to raise interest rates in the coming months” to bring it down, per PBS NewsHour/AP coverage.
Economist Michael Strain, quoted in Politico, read the combination of full employment and above-target inflation as pointing toward “a standard policy response, which is to raise interest rates.” That framing is why the repricing was so aggressive.
| Scenario | Pre-speech | Post-speech |
|---|---|---|
| September 2026 hike | ~35% | 60-66% |
| Two or more hikes by year-end | ~30% | Above 50% |
| Higher rates by December 2026 | Just above 70% | ~88-90% |
Reuters reported roughly a 62% chance of a 25-basis-point September hike and an 88% chance rates would be higher by December, citing FedWatch data on 31 August.
Here is the caveat that matters for how you weigh all of this. PBS/AP explicitly noted that Warsh’s comments “don’t necessarily signal” a September hike, and CNBC ran a piece headlined “Markets see Warsh endorsing a rate hike in September. Not everyone is convinced.” The distance between “inflation is too high and we may need to hike” and “we will hike in September” is where the next market move lives. If the data between now and the meeting softens, that probability gap is the reversal mechanism.
Why services-sector strength is structurally resistant to rate relief
Start with why this survey carries more analytical weight than the manufacturing equivalent. Services make up the majority of U.S. economic output, so a strong services print tells you more about the direction of the overall economy than an equivalent goods reading.
The deeper reason is what drives services inflation. Goods inflation is largely a function of supply chains, which can loosen quickly. Services inflation is tied to wages and local market conditions, which move slowly and stick. That persistence is exactly why a single strong services PMI shifts the rate outlook more than a comparable manufacturing print would.
Now connect the sub-indices to the mechanism. When services businesses report Prices at 72.6 and Business Activity at 61.7 at the same time, the combination signals two things at once: current pricing power, and a pipeline of demand that keeps that pricing power alive into future quarters.
Three reinforcing pressures are converging here:
- Services pricing power, with the Prices Index at its highest since October 2022 and offering “no relief”
- Wage-linked cost structures, the durable driver that makes services inflation harder to dislodge than goods inflation
- A recoupling of crude oil and inflation expectations, adding an external inflation input on top
For anyone weighing exposure to rate-sensitive assets, this structural persistence is the reason a hot services reading reprices the outlook more forcefully than the number alone might suggest.
Crude oil and inflation breakevens: the recoupling that markets noticed
Through July and August, inflation breakeven rates had appeared to decouple from crude oil, as if markets no longer treated oil as a meaningful inflation threat. By early September that decoupling had reversed, with crude and breakevens moving together again.
The trigger was a crude spike earlier in the week of the ISM release, which pushed prices outside their established range and was read as inflationary in the current context.
The recoupling of crude oil and inflation expectations observed in late August follows the same transmission channel documented earlier in 2026, when Goldman Sachs estimated that a sustained $10-$20 per barrel crude increase adds several tenths of a percentage point to headline CPI and slows the disinflation trajectory the Fed needs to justify holding rates steady.
The telling detail is the asymmetry. Unlike gold and equities, which recovered their earlier weekly losses, crude did not retrace its gains. That refusal to give back ground reinforced its status as an ongoing inflation risk signal, one more input pointing the same direction as the services data.
Where the hawkish consensus is vulnerable
The most structurally significant counter-argument is sitting inside the same ISM report that drove the hawkish read. Services Employment at 47.8 has now contracted 13 of the last 18 months, even as activity and pricing surge. That divergence matters. The labour channel is the classic transmission route for wage-driven services inflation, and if it is genuinely soft, the headline PMI may be overstating how tight underlying conditions really are.
This is not fringe scepticism. Wall Street itself is split.
The counterargument from manufacturing data runs in the opposite direction: ISM Manufacturing for August came in below consensus, with new orders decelerating and employment weakening, providing the evidentiary basis for the strategists who read the post-Jackson Hole repricing as an overreaction to rhetoric rather than a response to deteriorating conditions.
Reuters, in its 31 August piece “Wall Street divided on Fed policy path as Barclays joins hawkish camp,” described markets as remaining divided on the path even as institutions like Barclays moved to the hawkish side.
CNBC’s framing that “not everyone is convinced” points to strategists who regard the post-Jackson Hole reaction as potentially over-reading a single speech. PBS/AP’s reminder that Warsh’s remarks depend on the full incoming data flow, not the ISM survey alone, sits in the same camp.
So where would the repricing partially reverse? Three specific conditions:
- A softer-than-expected September CPI print that complicates the services inflation story
- A services employment reading that returns to expansion, closing the divergence
- Any FOMC communication that walks back the market’s post-Jackson Hole interpretation
If the September jobs report or CPI comes in soft, the probability shift that followed Jackson Hole is the first thing to unwind. Knowing that lets you position your interpretation ahead of the data rather than reacting to it. The 13-month pattern of employment contraction is the specific data point to watch.
What the PMI-plus-speech combination tells you about the path to year-end
Treat the strong services data and the hawkish Fed Chair as one compounding signal rather than two separate events. Either alone would have moved the needle. Together, they have shifted the base case. The clearest single measure of that shift is the odds of two or more hikes by year-end crossing above 50%, with the probability of higher rates by December now sitting near 88-90%.
The honest read is that the base case has moved from “cuts are likely delayed” to “a hike is now the most probable single outcome.” That is a genuine change, and it deserves to be treated as such, not waved away as noise from one speech.
Three data points to watch before the September FOMC decision
The next major repricing event is already identifiable. It will be triggered by one of three releases:
The headline versus core inflation split is the interpretive frame that will determine how September CPI lands relative to the services PMI narrative: if energy again accounts for the bulk of any print above target, the Fed faces the same diagnostic challenge it confronted in June, when a 1.3 percentage-point gap between headline and core complicated the case for an immediate policy response.
- The September CPI print, which either confirms or complicates the services inflation narrative documented in the ISM report
- The September employment report, which reveals whether services employment contraction persists or finally inflects
- FOMC member communications, for any signal that reinforces or walks back the post-Jackson Hole market pricing
The asymmetry is what to hold onto. Given the structural persistence of services inflation, the data flow into the September meeting is more likely to confirm the hawkish case than to overturn it. That said, the base-case shift is provisional, not definitive, and the Employment Index at 47.8 is the one clear risk to it before year-end. Treating the shift as real while watching for that specific reversal is the calibrated position here.
For investors tracking how a September hike would ripple into currency and fixed-income positioning, our full explainer on Fed policy tools and the dollar covers the real yield differential mechanism, balance sheet dynamics, and the three-question framework for reading any FOMC outcome.
This article is for informational purposes only and should not be considered financial advice. Investors should conduct their own research and consult with financial professionals before making investment decisions. Past performance does not guarantee future results. Financial projections are subject to market conditions and various risk factors. Forward-looking statements about interest rate probabilities are speculative and subject to change based on incoming data and Federal Reserve decisions.