
How Hormuz Closure at $104 Oil Is Reshaping Every Asset Class
7 hrs ago

“`json { “fact_checked_full_article”: “Roughly 40% of Russell 2000 constituents reported negative earnings as of late 2024, yet the index was trading near all-time highs. That single data point quietly undermines one of the most repeated assumptions in financial commentary: that US equity markets are structurally impatient with unprofitable companies.\n\nThe SEC’s April 2026 proposal to replace mandatory quarterly earnings reporting with semiannual disclosures rests heavily on a premise that investors are too short-term focused, pushing corporate managers toward near-term profit at the expense of long-term value creation. It is a compelling-sounding diagnosis. It is also, as two decades of market data suggest, largely unsupported by the evidence.\n\nThis analysis examines what the data actually show about how US equity markets price unprofitable growth companies, using Amazon and Tesla as documented case studies, Russell 2000 index composition as structural evidence, and recent academic research on the growth-versus-value cycle to build a more accurate picture of how long-term potential is reflected in equity prices.\n\n## How equity markets actually price long-term potential\n\nThe assumption that a company needs current profits to justify a high share price misunderstands how equity valuation works. Share prices reflect the present value of all expected future cash flows, not just the current quarter’s earnings. A pre-profit company with a credible growth trajectory can command a substantial market capitalisation precisely because investors are pricing in cash flows that have not yet materialised.\n\nTwo primary frameworks are used to value unprofitable companies:\n\n- Discounted cash flow (DCF) with terminal value emphasis: This approach projects future free cash flows once the company reaches profitability and discounts them back to present value. For most pre-profit companies, the terminal value component (the estimated value of all cash flows beyond the explicit forecast period) accounts for the overwhelming share of the total valuation.\n- Revenue multiples adjusted for growth rate and gross margin: This method prices the company as a multiple of current or forward revenue, with the multiple calibrated to the company’s growth rate, margin profile, and capital efficiency. It is common in software, biotech, and high-growth technology sectors where earnings-based multiples are not yet applicable.\n\n### Why terminal value dominates pre-profit valuations\n\nFor pre-profit companies, the terminal value component dominates because near-term cash flows are negative or negligible. Small changes in long-term growth or margin assumptions produce large valuation swings, which is why analyst debates over these companies focus on addressable market size and margin trajectory rather than this quarter’s loss figure. Aswath Damodaran’s equity valuation frameworks at NYU Stern (2026 notes) detail how scenario-based DCF approaches and survival probability adjustments adapt standard tools for exactly these companies.\n\nA practical heuristic used widely in software and SaaS investing is the Rule of 40:\n\n> The Rule of 40: A company’s revenue growth rate plus its profit margin should equal or exceed 40%. A company growing at 60% annually with a -15% profit margin scores 45, suggesting the growth rate may justify current unprofitability.\n\nThis matters for the regulatory debate. If markets can already price long-term potential through forward-looking frameworks, the argument that quarterly reporting forces short-termism rests on a misunderstanding of how equity valuation operates in practice.\n\n## The SEC’s short-termism premise and why it matters\n\nAs of 27 April 2026, the SEC’s proposal to make quarterly earnings reporting optional in favour of semiannual disclosures has been sent to the White House for review. The stated rationale is that three-month reporting cycles incentivise managers to chase near-term Wall Street targets at the expense of long-term investment, a pattern regulators describe as systemic short-termism.\n\nThe counterargument is direct. Harvard Law professor Lucian Bebchuk, writing at the Harvard Law School corporate governance forum in February 2021, argued that evidence for systemic short-termism in US markets is thin.\n\n> Bebchuk characterised the empirical evidence supporting the short-termism thesis as minimal, describing policy responses built on it as solutions in search of a problem that lacks strong documentation.\n\nMark Hulbert, writing in MarketWatch, framed the proposal similarly: as addressing a largely non-existent problem. If the short-termism premise is flawed, the policy response built on it may introduce new risks, particularly for the pre-profit companies it claims to protect, without solving the original problem.\n\n## The transparency tradeoff: what less frequent reporting means for pre-profit investors\n\nThe short-termism premise may lack empirical support. The policy response, however, carries its own real costs.\n\nFor pre-profit companies where cash burn trajectory and revenue acceleration form the core investment thesis, reducing reporting frequency creates longer windows in which financial deterioration can go undetected. Srini Krishnamurthy of NC State University has assessed that infrequent reporting windows provide bad-faith management broader timeframes to conceal deteriorating financial performance before investors can react.\n\n> Krishnamurthy’s assessment is pointed: reduced disclosure frequency does not merely reduce administrative burden; it provides cover for managers whose companies are burning cash faster than projected, with investors left without the data to identify the problem until months later.\n\nThe stakes are not hypothetical. OpenAI, valued at approximately $840 billion, and Anthropic, valued at approximately $330 billion, are both pre-profit companies eyeing public listings as of 2026. For prospective shareholders in companies of this scale, the ability to monitor cash burn and revenue trajectory quarterly is not a regulatory inconvenience; it is a primary mechanism for tracking whether the investment thesis remains intact.\n\nMorningstar analysts noted in 2026 that for growth stocks, earnings growth rates should meet or exceed market expectations to justify valuations. That assessment underscores why frequent checkpoints matter. The argument for and against reduced reporting frequency breaks down along clear lines:\n\n- Proponents cite: Reduced compliance costs, less managerial distraction from quarterly targets, and encouragement of longer-term strategic thinking.\n- Critics identify: Greater opacity around cash burn, delayed detection of financial deterioration, and reduced ability for investors to distinguish between companies on a credible path to profitability and those concealing accelerating losses.\n\nThe SEC’s proposal may misdiagnose the disease while simultaneously creating a new one. For investors in unprofitable growth companies specifically, the loss of quarterly data is not a neutral change.\n\n## Amazon, Tesla, and the investor calculus behind pre-profit patience\n\nIf markets were truly dominated by short-termism, early shareholders in Amazon and Tesla would have been punished for holding through years of losses. The data show the opposite.\n\nTesla went public in 2010 and did not report its first annual profit until 2020. During that decade of reported losses, cumulative total shareholder return from IPO through end-2019, the last full year of reported losses, reached 1,651%, according to LSEG data.\n\n> Tesla’s cumulative total shareholder return during its pre-profit period: 1,651% (IPO through end-2019, LSEG data).\n\nAmazon took approximately six years post-IPO to report its first annual profit. Cumulative stock appreciation from IPO through its last loss-reporting year reached 865%, also per LSEG.\n\n
| Company | Years pre-profit post-IPO | Cumulative return during loss period | First profit year |
|---|---|---|---|
| Tesla | ~10 years (2010-2020) | 1,651% | 2020 |
| Amazon | ~6 years post-IPO | 865% | ~2003 |
\n
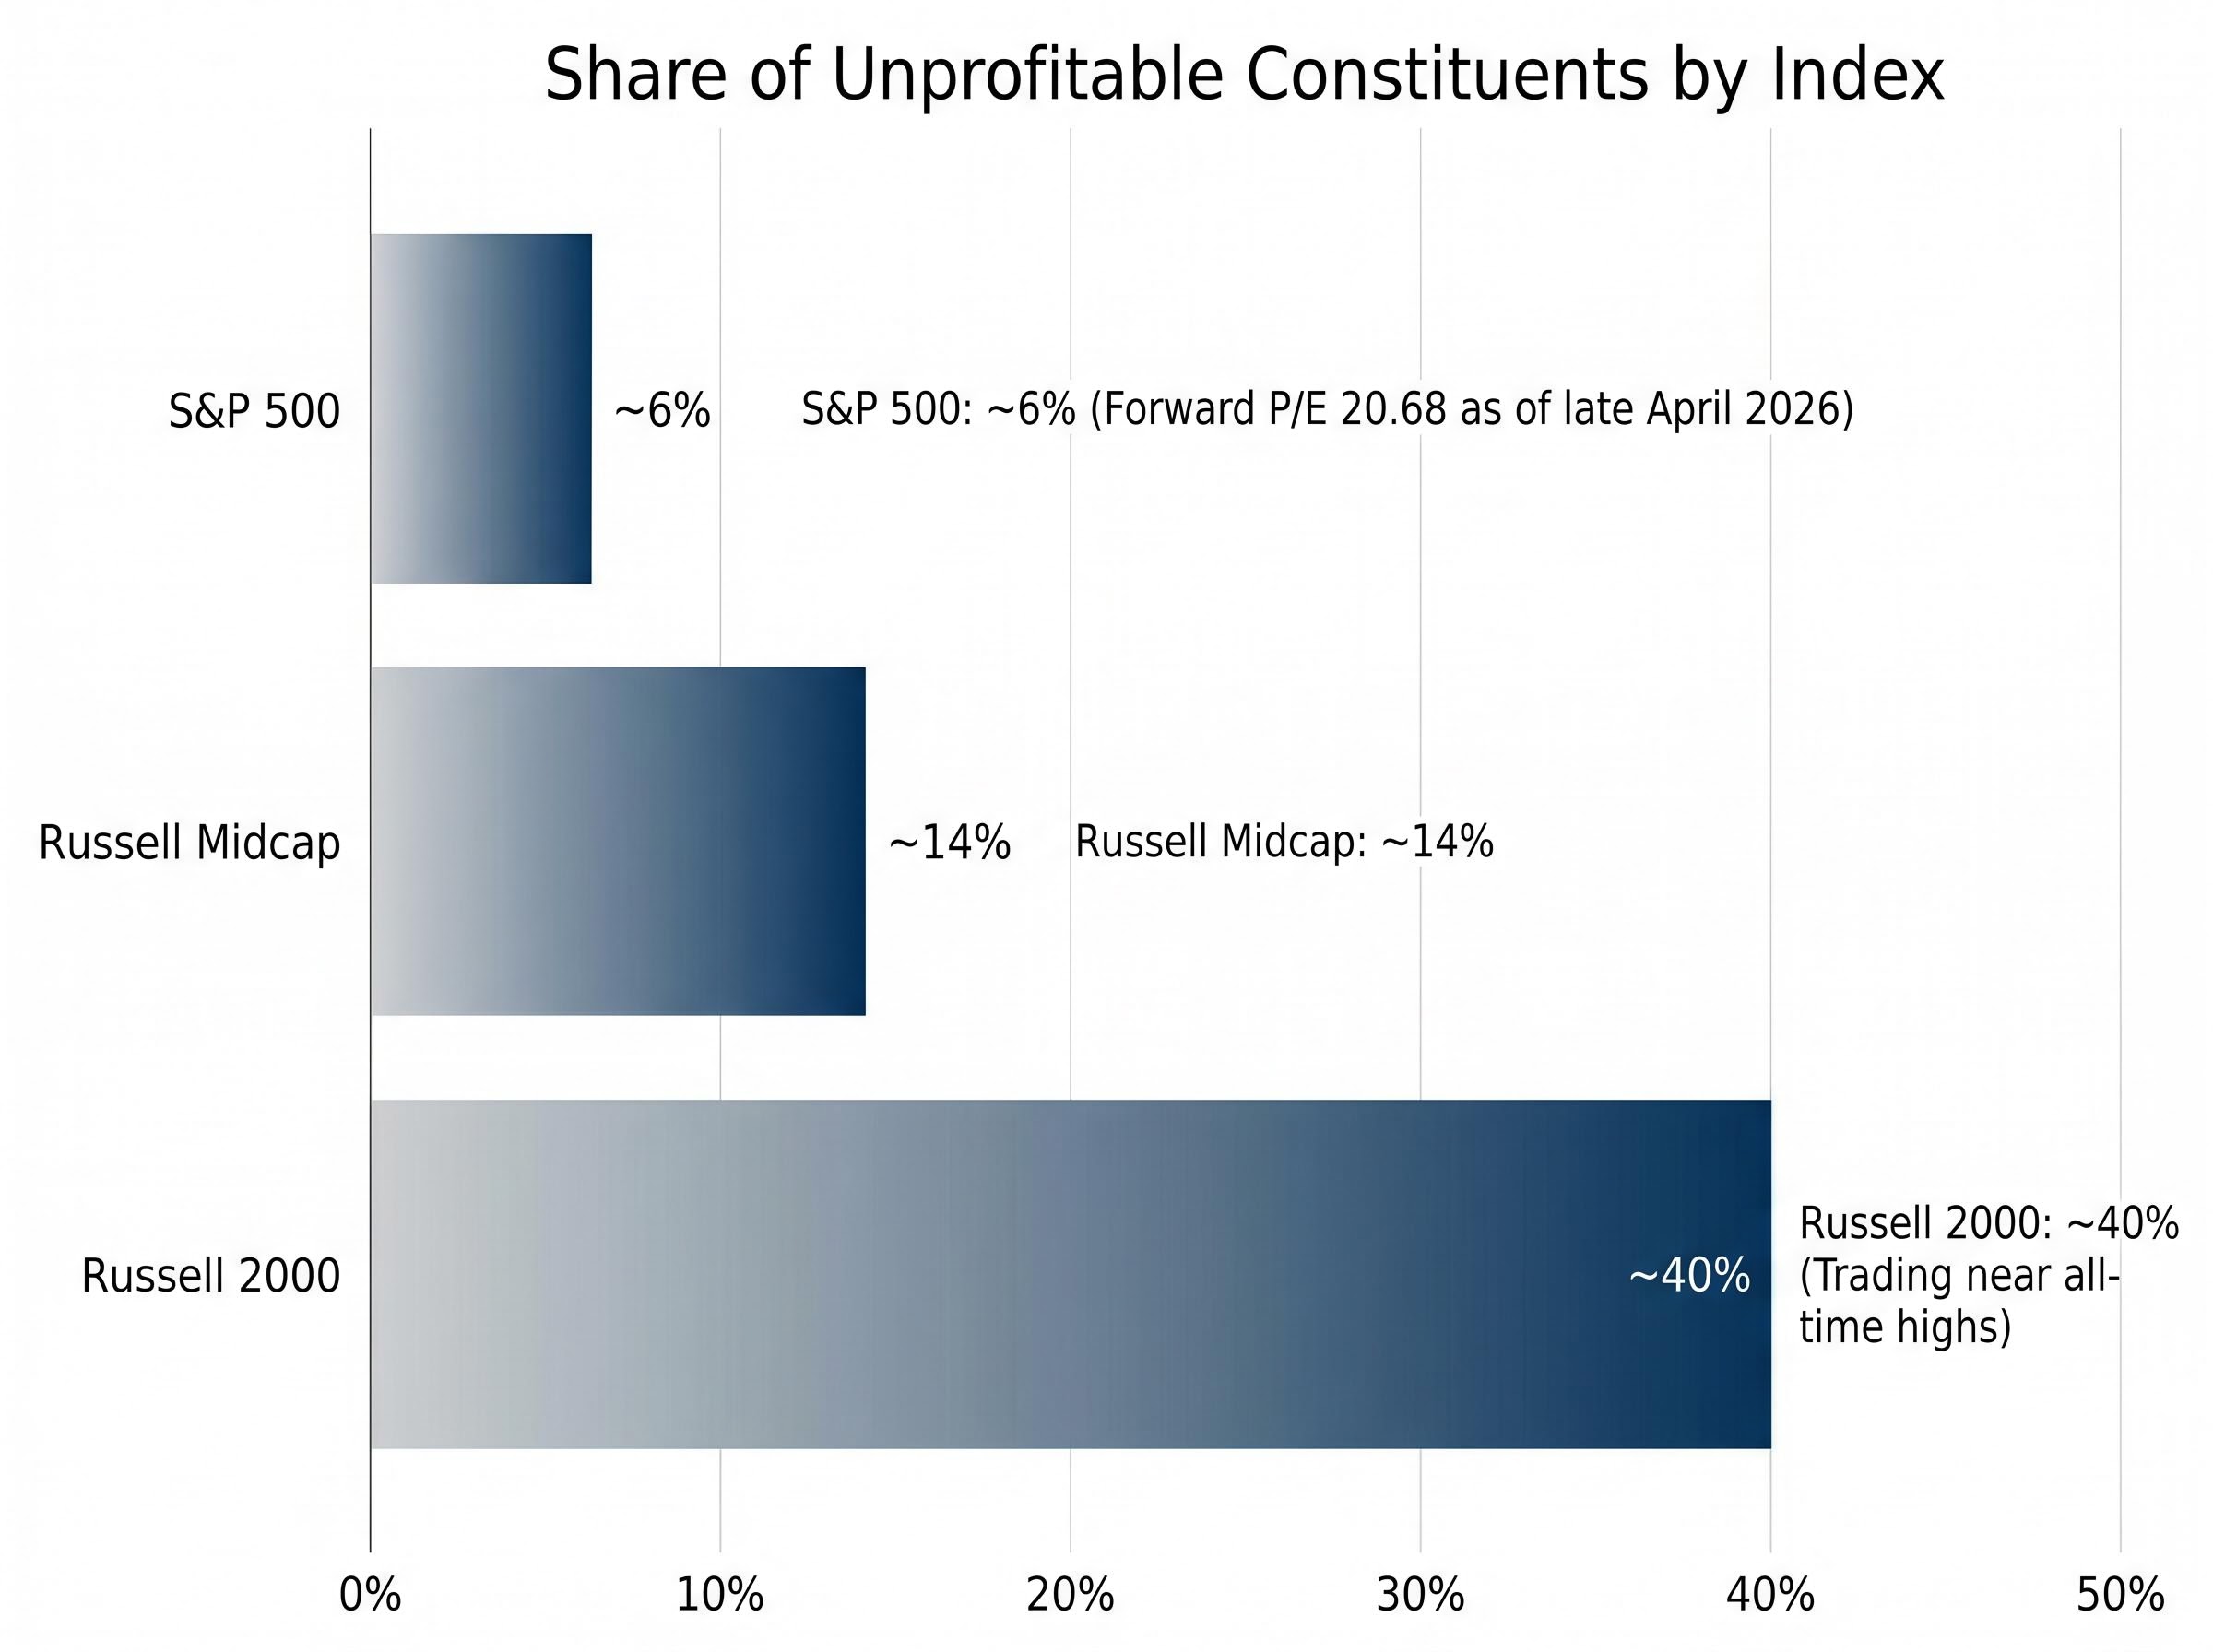
\n\nThese are not flukes. They are illustrations of a broader pattern: markets price future earnings capacity, not current income. Patient capital rewarded long-horizon investing in both cases, which is precisely the dynamic the short-termism thesis predicts should not occur.\n\nSurvivorship bias warrants acknowledgement. Many pre-profit companies fail, and investors in those names absorb total losses. The relevant point, however, is not that every unprofitable company succeeds; it is that the market mechanism for rewarding long-term potential already exists and has produced documented, large-scale wealth creation for shareholders willing to hold through extended loss periods.\n\n## What the Russell 2000 reveals about market patience\n\nThe case studies illustrate the pattern at the company level. The index data confirm it at the structural level.\n\nApproximately 42% of Russell 2000 constituents reported negative earnings as of late 2024, according to LSEG data. By Q3 2025, roughly 40% remained unprofitable, per Fortune (October 2025). The index was trading near all-time highs throughout.\n\n
| Index | Approximate unprofitable share | Valuation context |
|---|---|---|
| S&P 500 | ~6% | Forward P/E 20.68 (late April 2026) |
| Russell Midcap | ~14% | Moderate unprofitability concentration |
| Russell 2000 | ~40% | Trading near all-time highs |
\n
\n\nThe gradient is clear. Unprofitability is a small-cap phenomenon, not a systemic crisis across US equities. The S&P 500’s 6% unprofitable share contrasts sharply with the Russell 2000’s 40%, reflecting the concentration of early-stage, growth-oriented companies in the small-cap universe.\n\nThe coexistence of high unprofitability rates and near-record index levels creates a direct logical tension with the short-termism narrative. If investors were systematically punishing companies for failing to report near-term profits, an index where four in ten constituents are unprofitable would not be trading near its highs. The data suggest the opposite: markets are pricing potential, not punishing its absence.\n\n## Cyclicality and drivers of growth vs. value performance\n\nThe long-run performance data reinforce the structural argument. The Russell 3000 Growth index beat its Value counterpart by double digits for the second consecutive year in 2024, extending a pattern of growth dominance that has persisted, with interruptions, since 2010.\n\nTwo recent academic studies add precision to this picture:\n\n1. Chen et al. (2026), published in the Financial Analysts Journal in February 2026: The value premium averages approximately 3.9% annually overall, but this figure is driven primarily by \”new\” value and growth stocks (recent style migrants). Long-standing value stocks produce a lower premium of approximately 1.8% annually.\n2. Cornell/Dyson (2026), published in March 2026 using data from 1977-2023: Value and growth performance cycles in a predictable, alternating pattern. The research introduces the Implied Value Premium (IVP) metric as a forecasting tool for anticipating style rotation without attempting to call precise turning points.\n\n> According to Chen et al. (2026), the value premium averages approximately 3.9% annually, but this figure is driven largely by style migrants rather than structural dominance of value investing.\n\n### The early 2026 value rotation: a test case for cyclicality\n\nThe cyclicality thesis found a live test case in early 2026. Large-cap value briefly led large-cap growth by approximately 11% on a year-to-date basis at its peak, a meaningful rotation that prompted commentary about a regime change in style leadership.\n\nIt did not last. By late April 2026, growth had reasserted dominance, with the growth-to-value ratio at approximately 3.91, indicating cumulative growth outperformance had resumed. The episode illustrates the Cornell/Dyson finding precisely: value-growth cycles are real, alternating, and temporary rather than permanent structural shifts.\n\nFor investors evaluating pre-profit growth companies, this cyclicality changes the framing. The question is not whether to hold growth companies but whether current valuations and macroeconomic conditions support the timing of that exposure. The federal funds rate at 3.5%-3.75% with a neutral Fed posture as of April 2026 represents a more accommodating environment for growth than the peak tightening cycle, partially reducing the rate-driven headwind that weighed on pre-profit names in prior years.\n\n## Conclusion\n\nThe short-termism narrative lacks empirical support. Two decades of market behaviour, index composition data, and documented case studies point in the opposite direction: US equity markets have demonstrated a sustained, measurable capacity to price long-term potential into pre-profit companies, rewarding patient capital through mechanisms that are well understood and widely practised.\n\nThe SEC’s semiannual reporting proposal, built on the premise that quarterly disclosures force short-term thinking, rests on a foundation the data do not support. More critically, the transparency costs of the proposed solution deserve serious scrutiny. For the pre-profit companies the policy ostensibly aims to help, less frequent reporting reduces investors’ ability to track the very metrics, cash burn, revenue trajectory, margin progression, that determine whether the long-term thesis remains intact.\n\nUnderstanding how markets actually price unprofitable companies is a prerequisite for evaluating any policy that claims to fix investor behaviour. It is also a prerequisite for building positions in growth-stage companies with clear eyes about both the opportunity and the risks.\n\nThis article is for informational purposes only and should not be considered financial advice. Investors should conduct their own research and consult with financial professionals before making investment decisions. Past performance does not guarantee future results. Financial projections are subject to market conditions and various risk factors.\n\n—” } “`
Investors wanting a fuller empirical treatment of these dynamics, including BlackRock and Fidelity’s specific positions on the reporting reform and what the public comment period means for portfolio positioning, will find our dedicated guide to how markets price long-term growth stocks, which examines the institutional response to the SEC proposal alongside the same Russell 2000 and Tesla data explored here.
The rate environment for growth equities in 2026 has shifted materially from the peak tightening period, with the Federal Reserve holding steady at its March meeting and projecting only one cut for the year, a posture that partially restores the valuation support for long-duration pre-profit names without fully eliminating the discount-rate headwind that pressured them through 2022 and 2023.
Nasdaq delisting risk for pre-profit small-caps illustrates the asymmetry that survivorship bias obscures: Vivos Therapeutics, a medical technology company, saw stockholders equity collapse by $9.5 million in 12 months as a $21.2 million net loss outpaced its capital raises, leaving investors with a stock trading near the critical $1.00 minimum bid threshold and a compliance deadline that concentrated all exit risk into a narrow window.
Damodaran’s NYU Stern valuation framework for unprofitable growth companies formalises the scenario-based DCF approach and survival probability adjustments that practitioners apply when near-term cash flows are negative and terminal value carries the dominant share of total valuation.
The Harvard Law School Forum on Corporate Governance analysis of short-termism evidence characterises the empirical case for systemic managerial short-termism as thin, with Bebchuk concluding that regulatory interventions framed as correctives to this pattern lack the documented problem they claim to address.
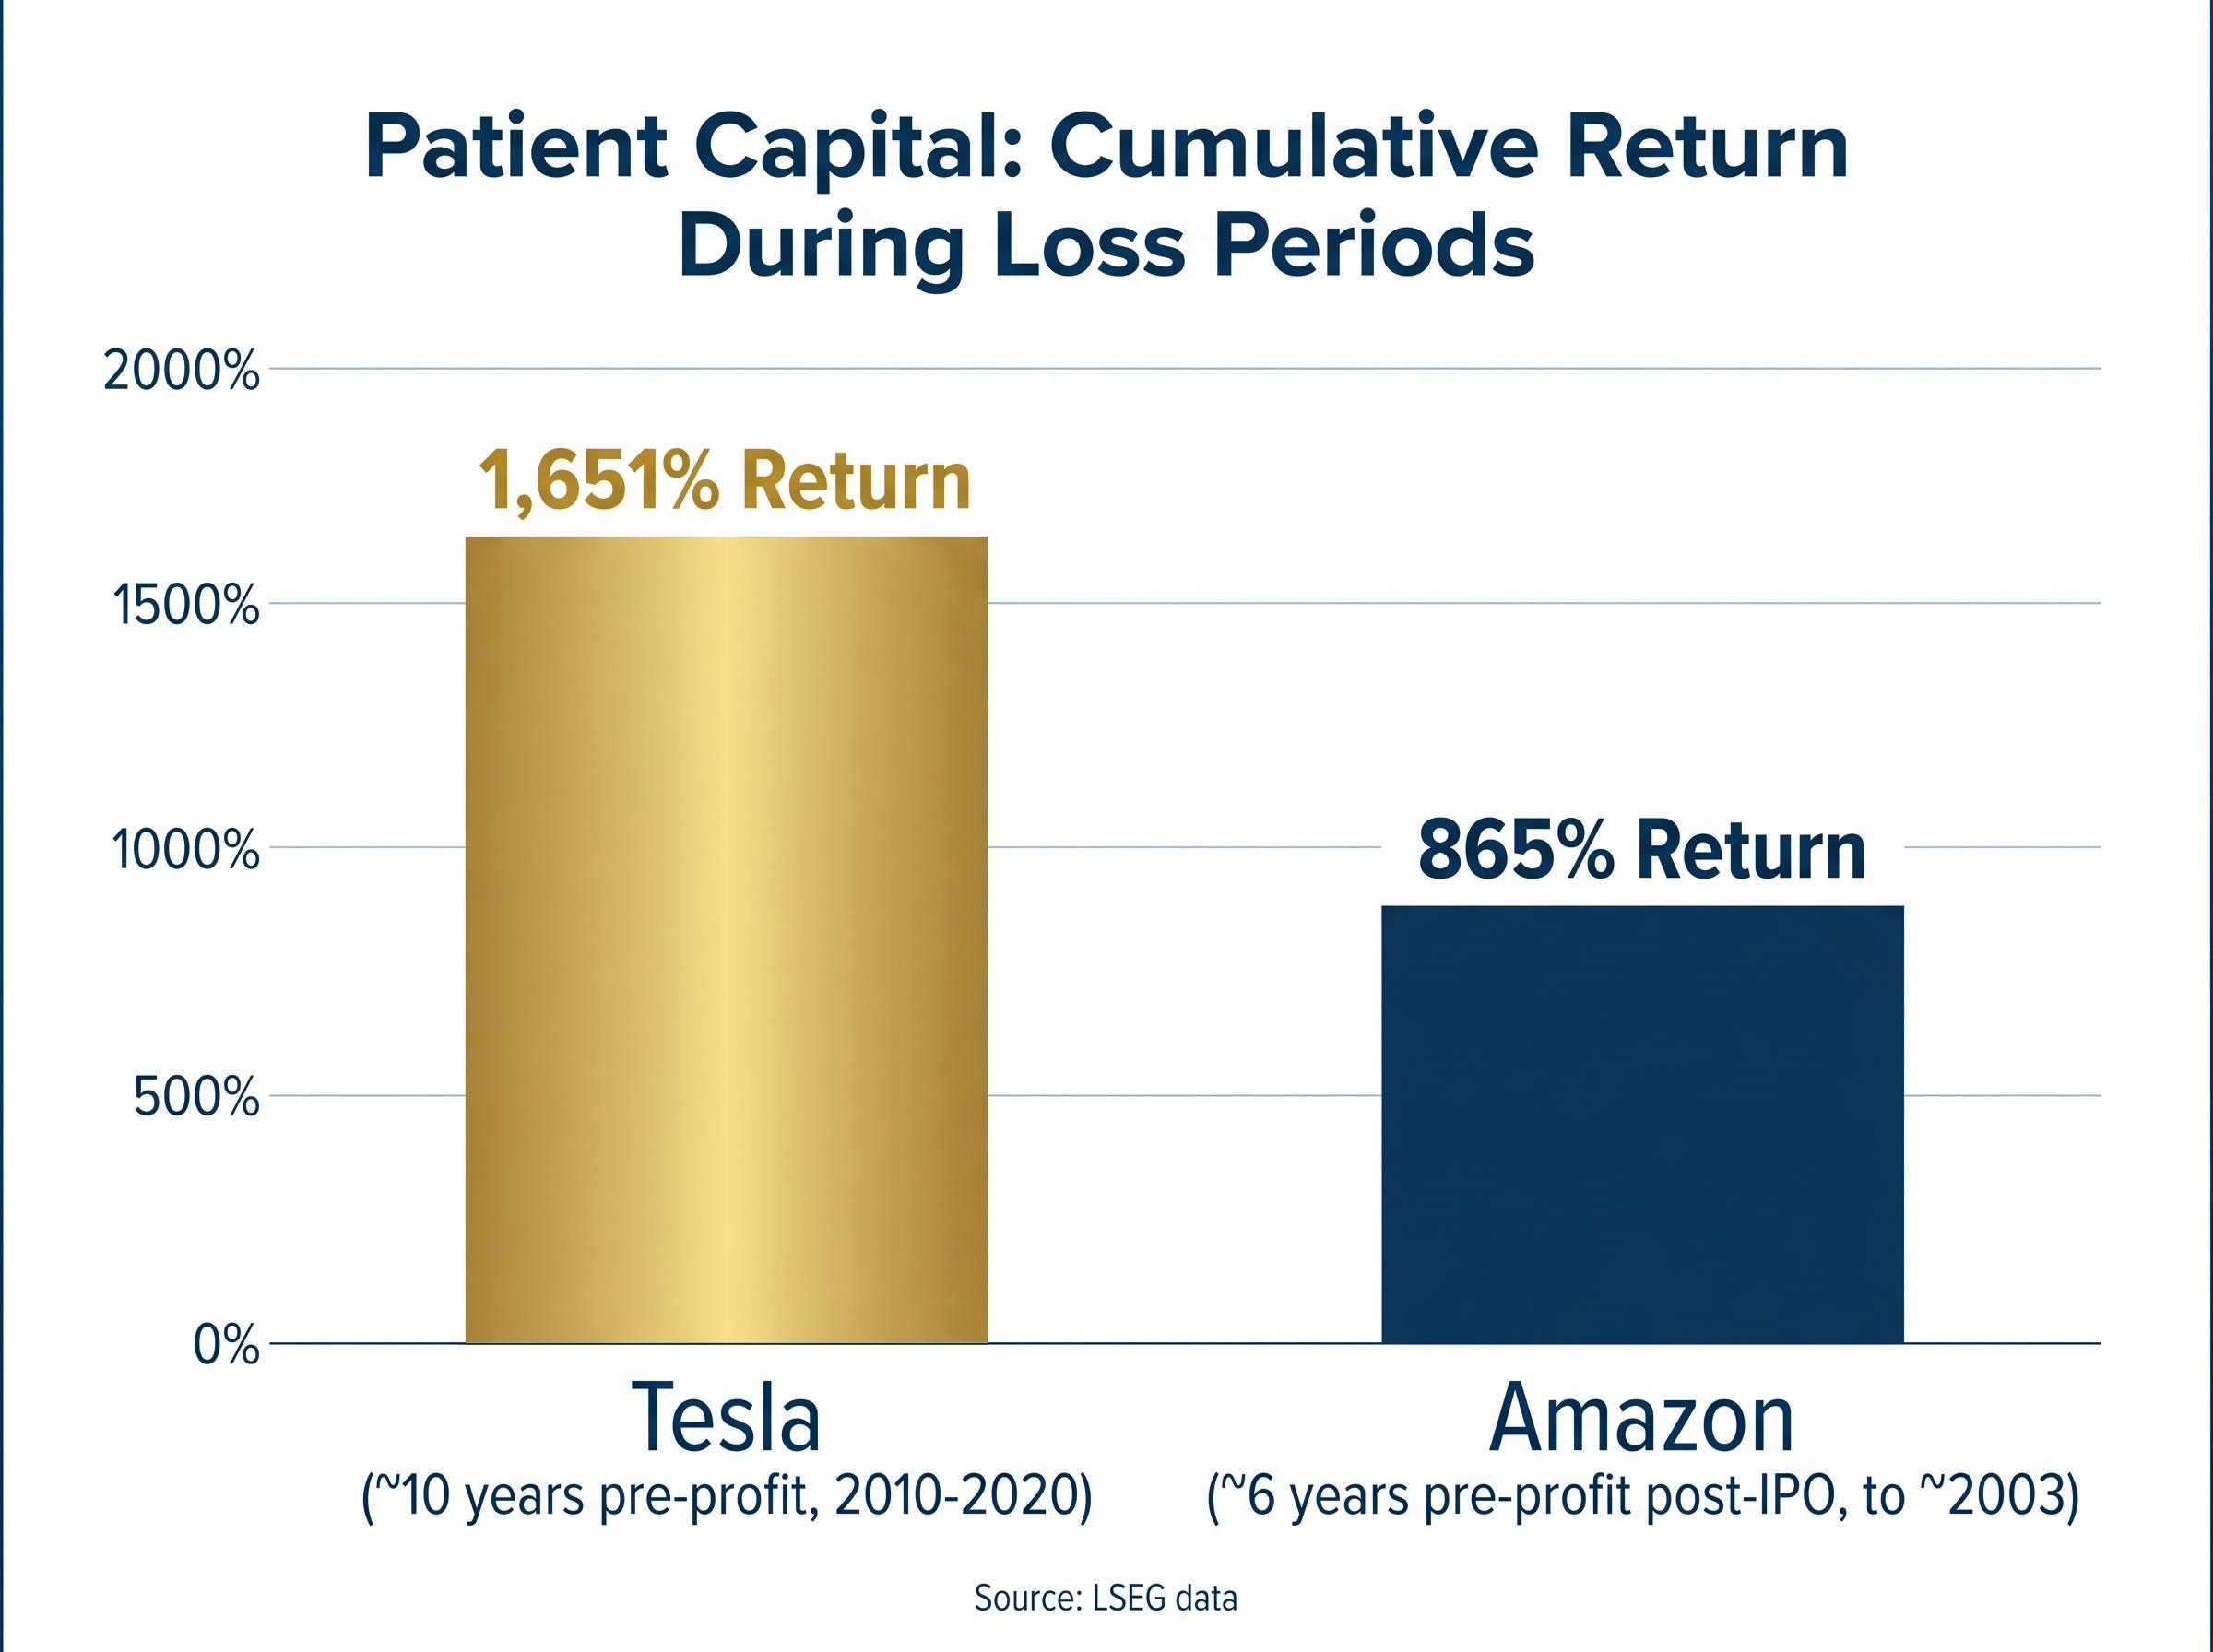
Investing in unprofitable companies can generate substantial long-term returns if the market prices future cash flow potential correctly. Tesla delivered 1,651% cumulative returns during its entire pre-profit period from 2010 to 2019, and Amazon returned 865% before its first annual profit, demonstrating that patient capital can be rewarded even through extended loss periods.
Markets value unprofitable companies using discounted cash flow models with heavy emphasis on terminal value, and revenue multiples adjusted for growth rate and gross margin. Because near-term cash flows are negative, the bulk of the valuation rests on long-term earnings capacity, meaning small changes in growth or margin assumptions can produce large swings in share price.
The Rule of 40 states that a company's revenue growth rate plus its profit margin should equal or exceed 40%, providing a quick way to assess whether high growth justifies current unprofitability. A company growing at 60% annually with a negative 15% profit margin scores 45, suggesting its growth rate may support its pre-profit status.
Approximately 40% of Russell 2000 constituents reported negative earnings as of late 2024, and the figure remained near that level through Q3 2025, yet the index was trading near all-time highs throughout that period. This contrasts sharply with the S&P 500, where only around 6% of constituents are unprofitable.
For investors in pre-profit companies, the proposed shift to semiannual reporting creates longer windows in which cash burn deterioration can go undetected, reducing the ability to identify whether the investment thesis remains intact. Researchers have noted that less frequent disclosure can provide cover for management at companies burning cash faster than projected, leaving investors without timely data to react.


