
UBS Warns Markets Are Underpricing ECB Hikes Beyond June
1 hr ago

U.S. inflation sits at 3.8 percent as of April 2026, and recession warnings have become a fixture of financial media. Yet the Federal Reserve’s own staff baseline, as of late April 2026, projects GDP growth slightly above potential. The gap between the fear and the data is worth examining. Ken Fisher, Founder, Executive Chairman, and Co-Chief Investment Officer of Fisher Investments, argued publicly on 22 April 2026 that inflation anxiety in the United States reflects a residual psychological reaction to the post-COVID monetary shock rather than a calibrated read of present conditions. What follows tests that thesis against current Bureau of Labor Statistics (BLS) and Fed data, the historical inflation record, and the views of institutional analysts at Wells Fargo and TD Economics, offering a framework for separating backward-looking fear from forward-looking signal.
The April 2026 Consumer Price Index for All Urban Consumers (CPI-U), released by the BLS on 12 May 2026, showed a 3.8 percent year-over-year increase. That number has become the centrepiece of the current inflation fear narrative. It is worth pausing on what it actually represents in context.
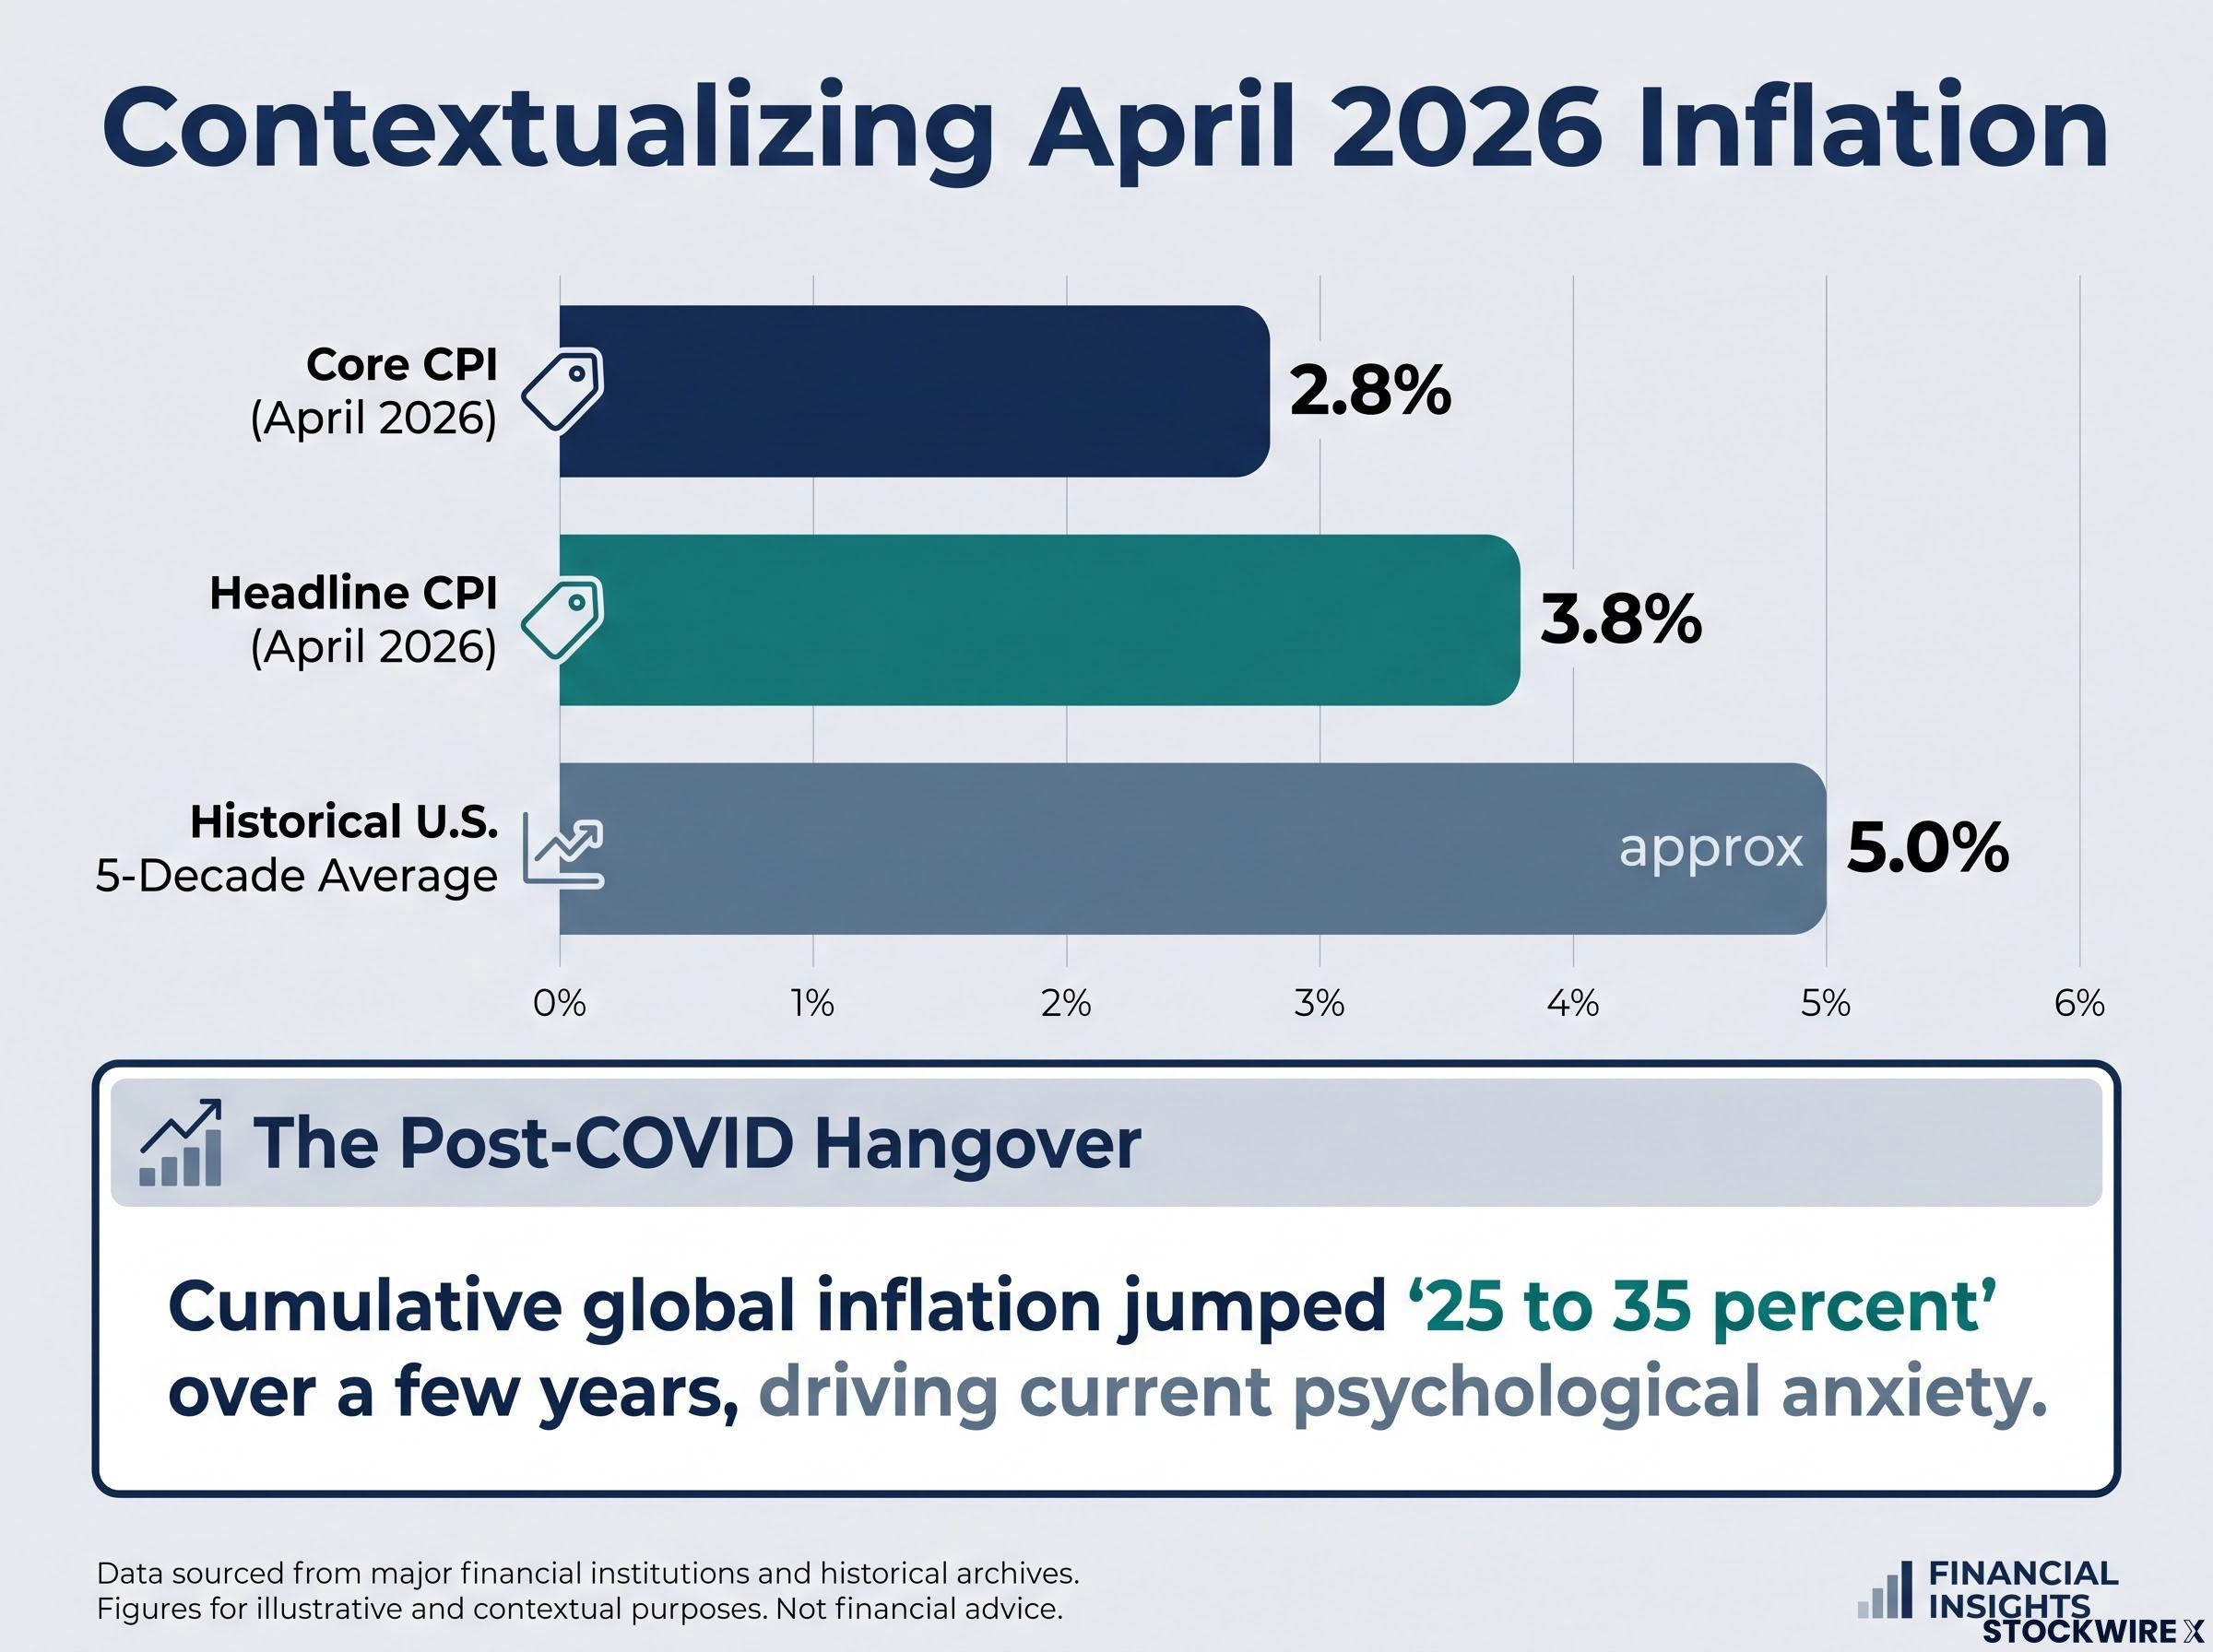
Fisher’s argument is that this concern is disproportionate, a hangover from the post-COVID monetary expansion that pushed cumulative global inflation an estimated 25 to 35 percent higher over just a few years. The memory of that shock, he contends, has distorted how investors evaluate a 3.8 percent print that, by historical standards, is unremarkable.
Ken Fisher has characterised current inflation concern as a “residual reaction to post-COVID monetary expansion” rather than a data-driven assessment of present conditions.
The numbers support the reframing. Consider the key inflation gauges side by side:
Fisher’s historical reference point sharpens the contrast further: the U.S. economy ran at approximately 5 percent average annual inflation across extended stretches of the past five decades without severe economic consequences. At 3.8 percent, the current headline figure sits below that historical norm. The fear is real. The data suggests it may be miscalibrated.
The April 2026 BLS release illustrates a recurring pattern where headline inflation moves sharply on a single commodity category while core measures remain comparatively contained; the energy-driven CPI spike to 3.8 percent was accompanied by a core CPI ex-food, energy, and shelter reading of just 2.3 percent, a distinction the S&P 500 appeared to price correctly by closing near 7,425 without a significant sell-off on the release date.
Fisher’s deeper claim is epistemological, not just statistical. His position, stated on 22 April 2026, is that backward-looking indicators such as inflation and employment data “are not necessarily consistent with future economic conditions.” They describe what has already happened. They do not predict what comes next.
CPI measures price changes in a fixed basket of goods using data collected over prior months. It is inherently retrospective. By the time a 3.8 percent year-over-year figure reaches a headline, the price movements it reflects are weeks to months old. Core PCE, the Federal Reserve’s preferred gauge, carries the same limitation: the February 2026 estimate of approximately 2.8 percent reflected conditions that had already passed, and the March 2026 rise toward the mid-3 percent range was driven by energy prices already priced into futures markets.
Equity and bond markets discount expected future cash flows and policy paths, not current inflation readings. The April 2026 FOMC minutes confirm this distinction at the institutional level: the Fed conditions its outlook on a range of forward-looking factors, including financial conditions, labour market trends, and geopolitical risks, not the headline inflation rate alone.
The implication is straightforward. Market signals and CPI readings can diverge significantly, and that divergence is precisely when inflation fear tends to peak without corresponding market deterioration.
| Backward-looking indicators | Forward-looking signals |
|---|---|
| CPI (headline and core) | Yield curve shape |
| Payrolls and unemployment rate | Forward earnings expectations |
| Core PCE (lagged release) | Credit spreads |
| Retail sales (prior month) | Fed funds futures pricing |
The distinction matters because investors who anchor portfolio decisions to backward-looking data are, by definition, positioning for conditions that have already occurred rather than conditions that are forming.
Corporate earnings reports function as forward-looking macro signals in a way that CPI data cannot, delivering real-time evidence on margin compression, consumer credit stress, and sector-level pricing power weeks before official price indices or GDP estimates reflect the same conditions.
If 3.8 percent inflation were a stand-alone recession signal, the institution most responsible for fighting inflation would treat it as one. It does not.
The Federal Open Market Committee held rates at a target range of 3.50 to 3.75 percent at its 28-29 April 2026 meeting. The accompanying statement and minutes, released by the Board of Governors of the Federal Reserve System on 20 May 2026, described economic activity as expanding at a pace “slightly above potential.” The Fed staff baseline projected continued growth, not contraction.
Wells Fargo Investment Institute noted that “economic activity has continued to expand at a solid pace,” characterising the current environment as one of steady growth alongside somewhat elevated inflation.
Fisher’s specific claim aligns with this framing: it is aggressive central bank tightening in response to severely worsening inflation, not elevated inflation itself, that could trigger a recession. The distinction is between a symptom and a cause. TD Economics, summarising the April 2026 FOMC stance, placed recession risk on “an extended period of restrictive policy” rather than on the present inflation rate directly.
The April 2026 FOMC minutes, released by the Board of Governors on 20 May 2026, confirm that the Committee conditioned its outlook on forward-looking factors including financial conditions, labour market trends, and geopolitical risks, treating the headline inflation rate as one input among several rather than a stand-alone policy trigger.
Across the Fed, TD Economics, and Wells Fargo, three primary risk factors emerge:
None of these risk factors is “inflation at 3.8 percent.” The Fed’s own language treats the current inflation rate as an input to its policy calculus, not as a recession diagnosis.
The idea that elevated inflation necessarily precedes recession is one of the most persistent assumptions in popular economic commentary. The historical record complicates it significantly.
Fisher’s reference point, that the U.S. ran at approximately 5 percent annual inflation for an extended period without significant negative consequences, is not an outlier observation. The pattern recurs across decades. Consider the following episodes:
The pattern is consistent: recessions in high-inflation periods were typically associated with sharp Fed tightening cycles, not with inflation levels per se.
The 2022-2023 tightening cycle serves as a live experiment in this relationship. The Federal Reserve raised rates by 525 basis points in one of the fastest tightening campaigns on record. A U.S. recession was widely forecast by major banks and forecasting models.
It did not materialise. The economy absorbed the tightening and continued to expand. This outcome is directly consistent with Fisher’s argument: tightening severity and duration, not inflation itself, determine recession outcomes. The 2022-2023 cycle was aggressive, but the economy’s underlying momentum, supported by fiscal spending and labour market resilience, proved sufficient to absorb it.
Fisher’s argument has a boundary condition, and acknowledging it produces a more precise and honest version of the thesis rather than a weaker one.
The sequential pathway runs as follows: persistent inflation forces the Fed to tighten further; it is that additional tightening which raises recession odds. Inflation is not the direct cause; it is the catalyst for the cause. TD Economics characterised the April 2026 Fed stance as “two-sided or hawkish,” with the bar for rate cuts raised.
TD Economics summarised the Fed’s conditional posture: the Committee is “prepared to wait longer, or potentially tighten policy, if inflation does not convincingly return toward target.”
Some FOMC participants saw greater downside risks to employment if policy remains restrictive for an extended period, reflecting internal disagreement about how long current rates can persist without damaging growth. The conditional is clear: if inflation returns toward the mid-3 percent range or higher on a sustained basis, the probability of additional tightening rises.
The M2 money supply constraint is central to the contrarian inflation thesis: M2 grew only 5.8 percent year-over-year in March 2026, compared with the 30-plus percent expansion during the 2020-2022 episode, and without sufficient broad money growth, firms facing higher input costs are more likely to compress margins than to sustain elevated consumer prices across the wider basket.
Two distinct claims should be separated:
The thesis holds as long as inflation does not worsen enough to compel a materially more aggressive Fed response. That is the variable worth monitoring, not the CPI print itself.
The preceding analysis converges on a specific conclusion: the recession risk variable is not the CPI headline but the Fed’s policy trajectory and the conditions that could force it to shift.
Three institutional risk factors, identified across the Federal Reserve, Wells Fargo, and TD Economics, define the monitoring framework:
| Variable | Why it matters | Current status (April-May 2026) | What to watch for |
|---|---|---|---|
| Fed funds rate trajectory | Tightening duration is the primary recession channel | Held at 3.50-3.75%; hawkish bias | Any signal of renewed hikes or extended hold beyond late 2026 |
| Energy prices (oil, gas) | Energy shocks feed inflation and force policy response | Elevated due to Middle East risks | Sustained price spikes above current levels |
| Household credit conditions | Bifurcated credit creates uneven growth vulnerability | Restrictive for households and small businesses | Tightening of lending standards or rising delinquencies |
| Core PCE trend | Persistent readings above 3% could trigger additional tightening | Rising toward mid-3% range | Sustained move above 3.5% |
Fisher’s framing offers a useful recalibration: current inflation levels are “below the norms seen across much of the past five decades.” The anxiety is understandable. The analytical response should be to redirect attention from the CPI number itself to the policy decisions it may or may not provoke.
Elevated inflation at 3.8 percent is not, by historical record or current institutional framing, a stand-alone recession signal. The Federal Reserve, Wells Fargo, and TD Economics all treat it as one input among several, and their staff baselines as of April 2026 project continued economic expansion, not contraction.
Fisher’s thesis holds until inflation worsens enough to compel a materially more aggressive Fed tightening response. That boundary condition is the analytical line to monitor: not the backward-looking CPI print, but the forward-looking policy path it influences.
Institutional recession probability estimates from Goldman Sachs, J.P. Morgan, and Moody’s Analytics, ranging from 30 to 48.6 percent as of mid-April 2026, sit well above what current S&P 500 levels appear to price in, a divergence that captures the analytical tension the article’s monitoring framework is designed to resolve.
Investors who redirect attention from inflation headlines to the Fed’s rate trajectory, credit conditions for households and small businesses, and geopolitical energy risks are monitoring the variables that institutional analysts and the Fed itself identify as the actual determinants of U.S. recession risk in 2026.
This article is for informational purposes only and should not be considered financial advice. Investors should conduct their own research and consult with financial professionals before making investment decisions. Past performance does not guarantee future results. Financial projections are subject to market conditions and various risk factors.
Headline CPI measures price changes across all goods including food and energy, while core CPI excludes those volatile categories. As of April 2026, headline CPI stood at 3.8 percent year-over-year while core CPI was just 2.8 percent, illustrating how a single commodity category can distort the broader inflation picture.
Historical evidence and current institutional framing suggest elevated inflation does not directly cause recessions. The Federal Reserve, Wells Fargo, and TD Economics all treat the current 3.8 percent inflation rate as one input among several, with their April 2026 baselines projecting continued economic expansion rather than contraction.
Investors should focus on the Fed funds rate trajectory, geopolitical energy risks from Middle East conflict, and household and small business credit conditions, since these are the factors the Federal Reserve, Wells Fargo, and TD Economics identify as the actual determinants of U.S. recession risk.
The FOMC held the federal funds rate target range at 3.50 to 3.75 percent at its 28-29 April 2026 meeting, with accompanying minutes describing economic activity as expanding at a pace slightly above potential and projecting continued growth rather than contraction.
Fisher contends that the post-COVID monetary expansion pushed cumulative global inflation 25 to 35 percent higher over just a few years, creating a lasting psychological distortion that causes investors to misread a 3.8 percent CPI print that sits below the roughly 5 percent average annual inflation the U.S. sustained for extended stretches over the past five decades.


