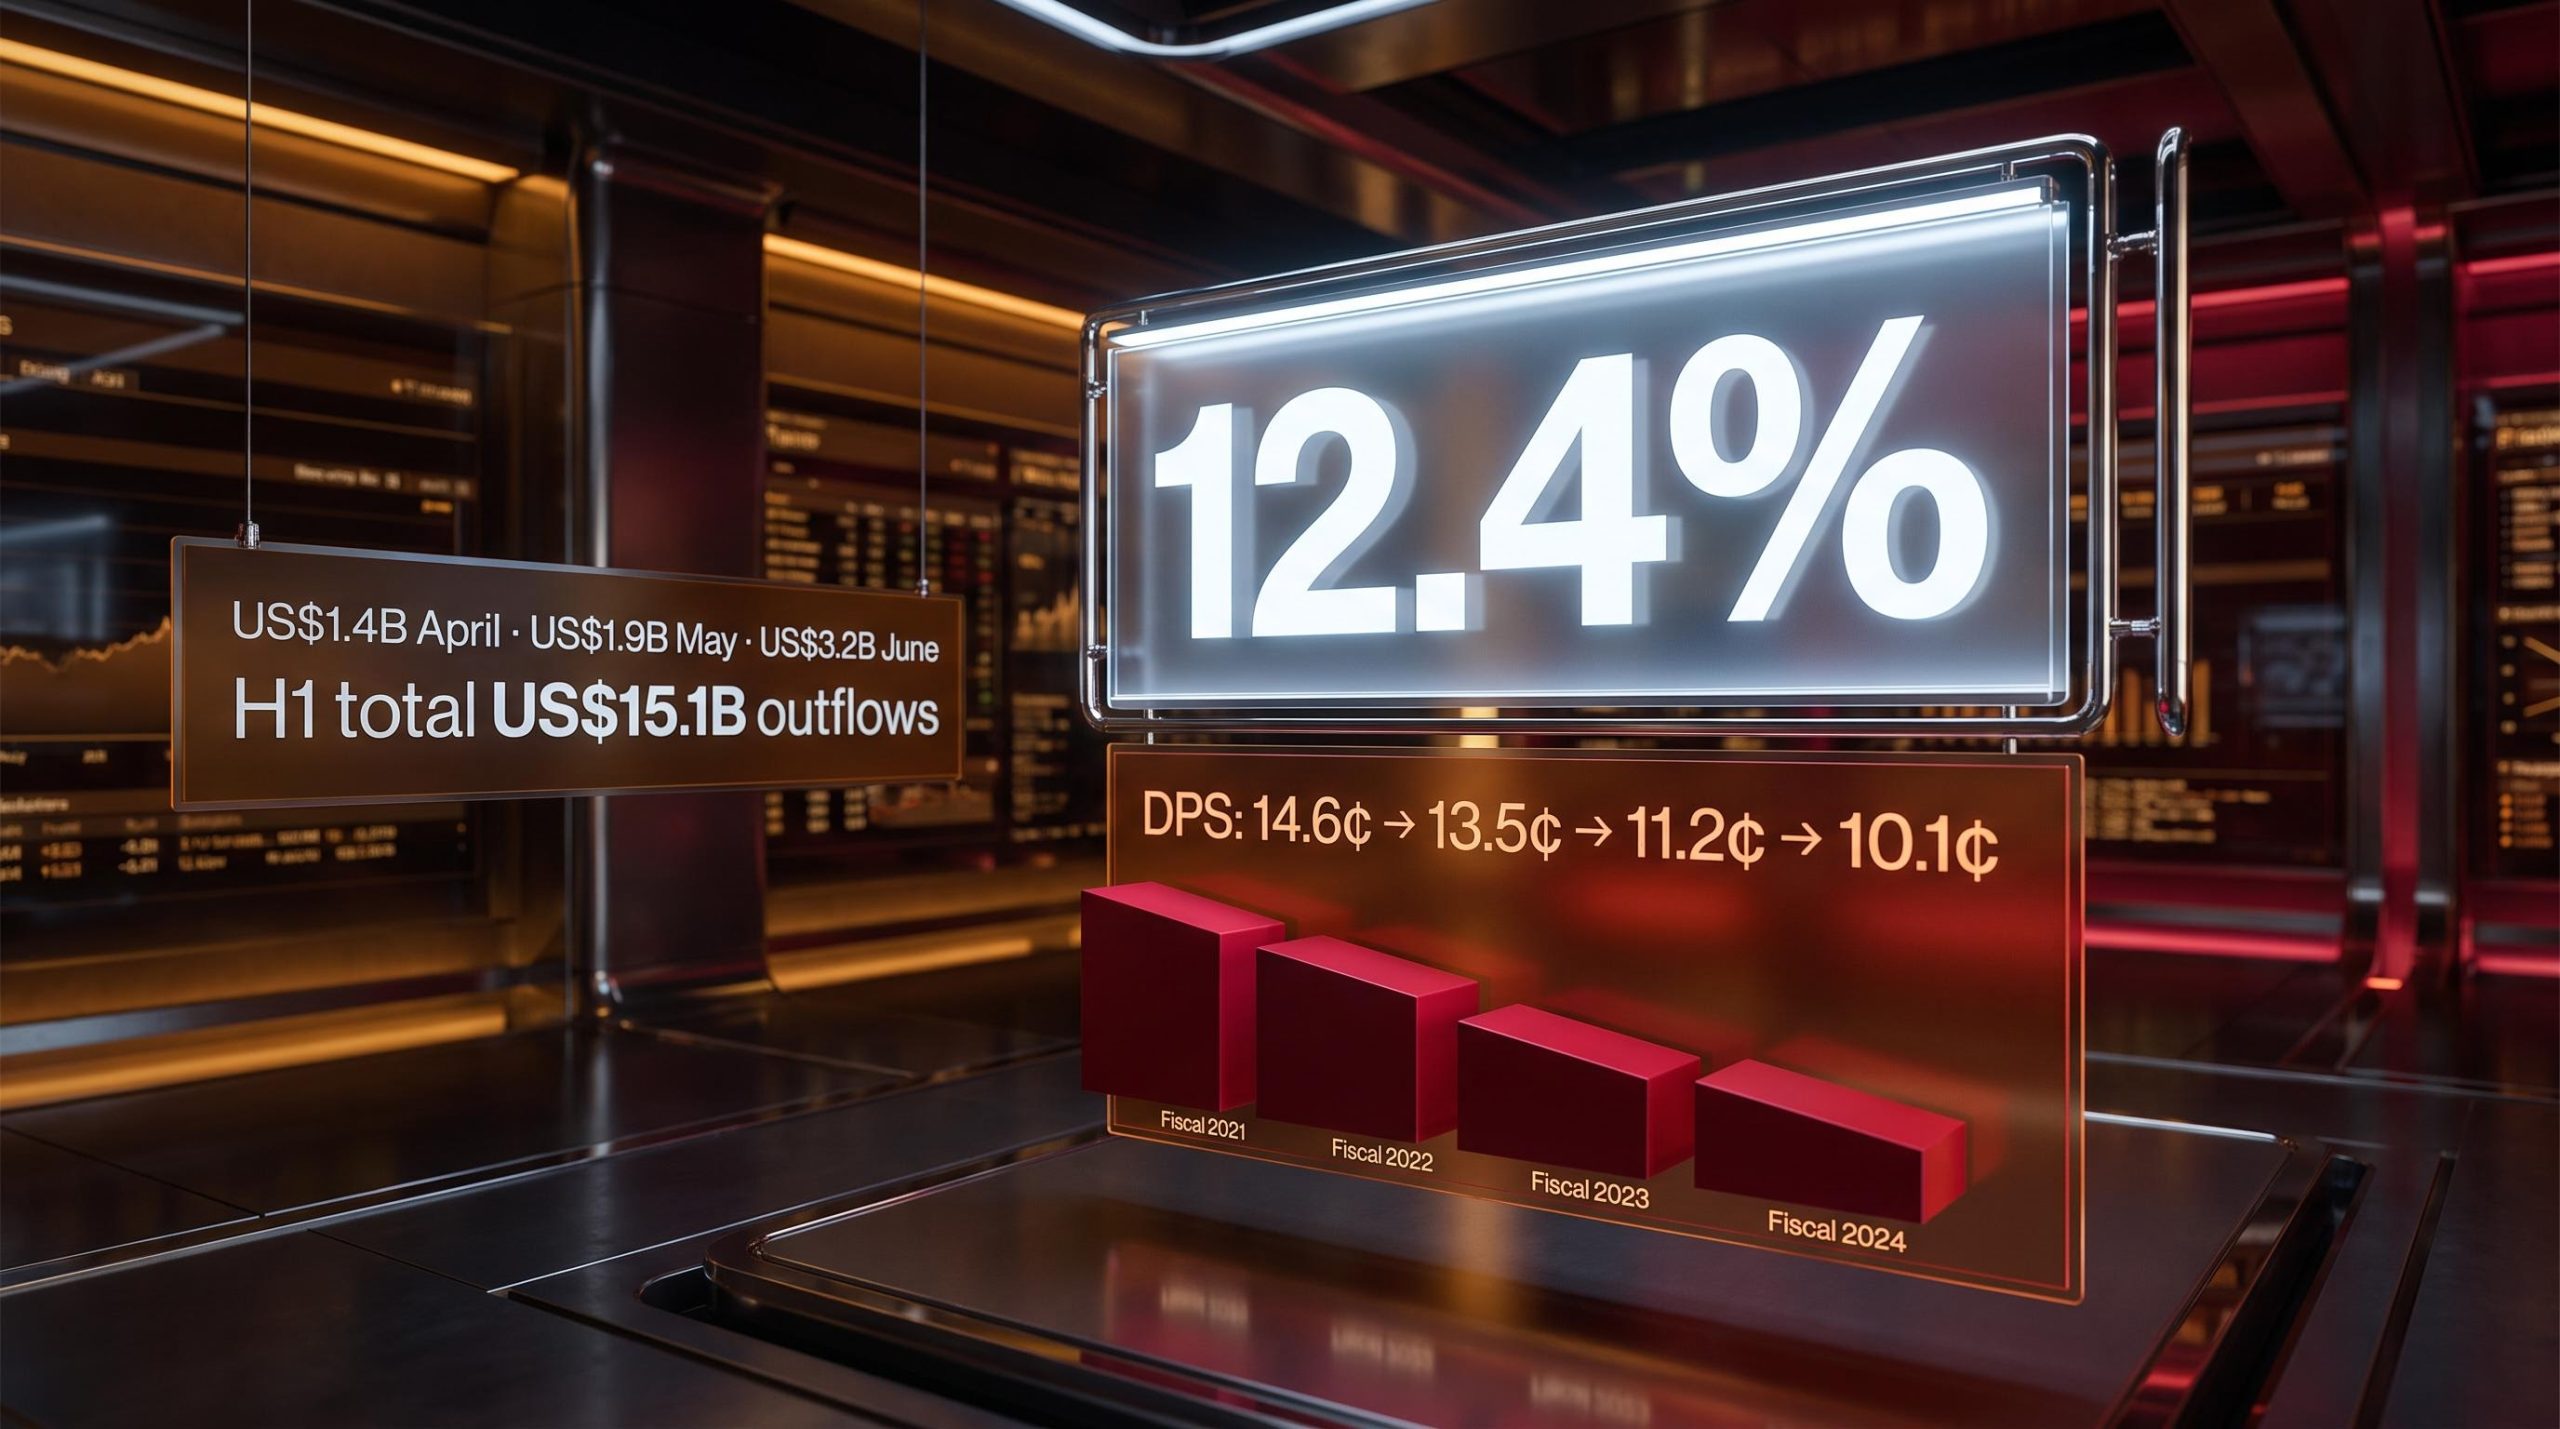
GQG Partners carries a forward dividend yield of 12.4%, a figure that looks like one of the most attractive income propositions on the ASX. It is also attached to a business whose earnings forecasts have been revised lower in every update this year. That tension between the headline number and the trajectory behind it is the entire story.
This matters right now because GQG is not a conventional income stock. It is a US-domiciled asset manager listed on the ASX via Chess Depository Interests (CDIs), paying unfranked dividends denominated in US dollars. Its payout is not set by board discretion the way a bank or insurer dividend is; it is a near-mechanical function of earnings, which are themselves a direct function of assets under management. When AUM falls, the dividend falls. The structure determines the risk in ways the headline yield does not communicate.
Here is the chain that connects client outflows to the dividend cheque you actually receive, mapped step by step, so you can assess whether 12.4% represents a genuine income opportunity or a number that is already shrinking beneath you.
How GQG’s dividend actually gets calculated
The first thing to understand about GQG’s dividend is that it is not really a decision. It is arithmetic.
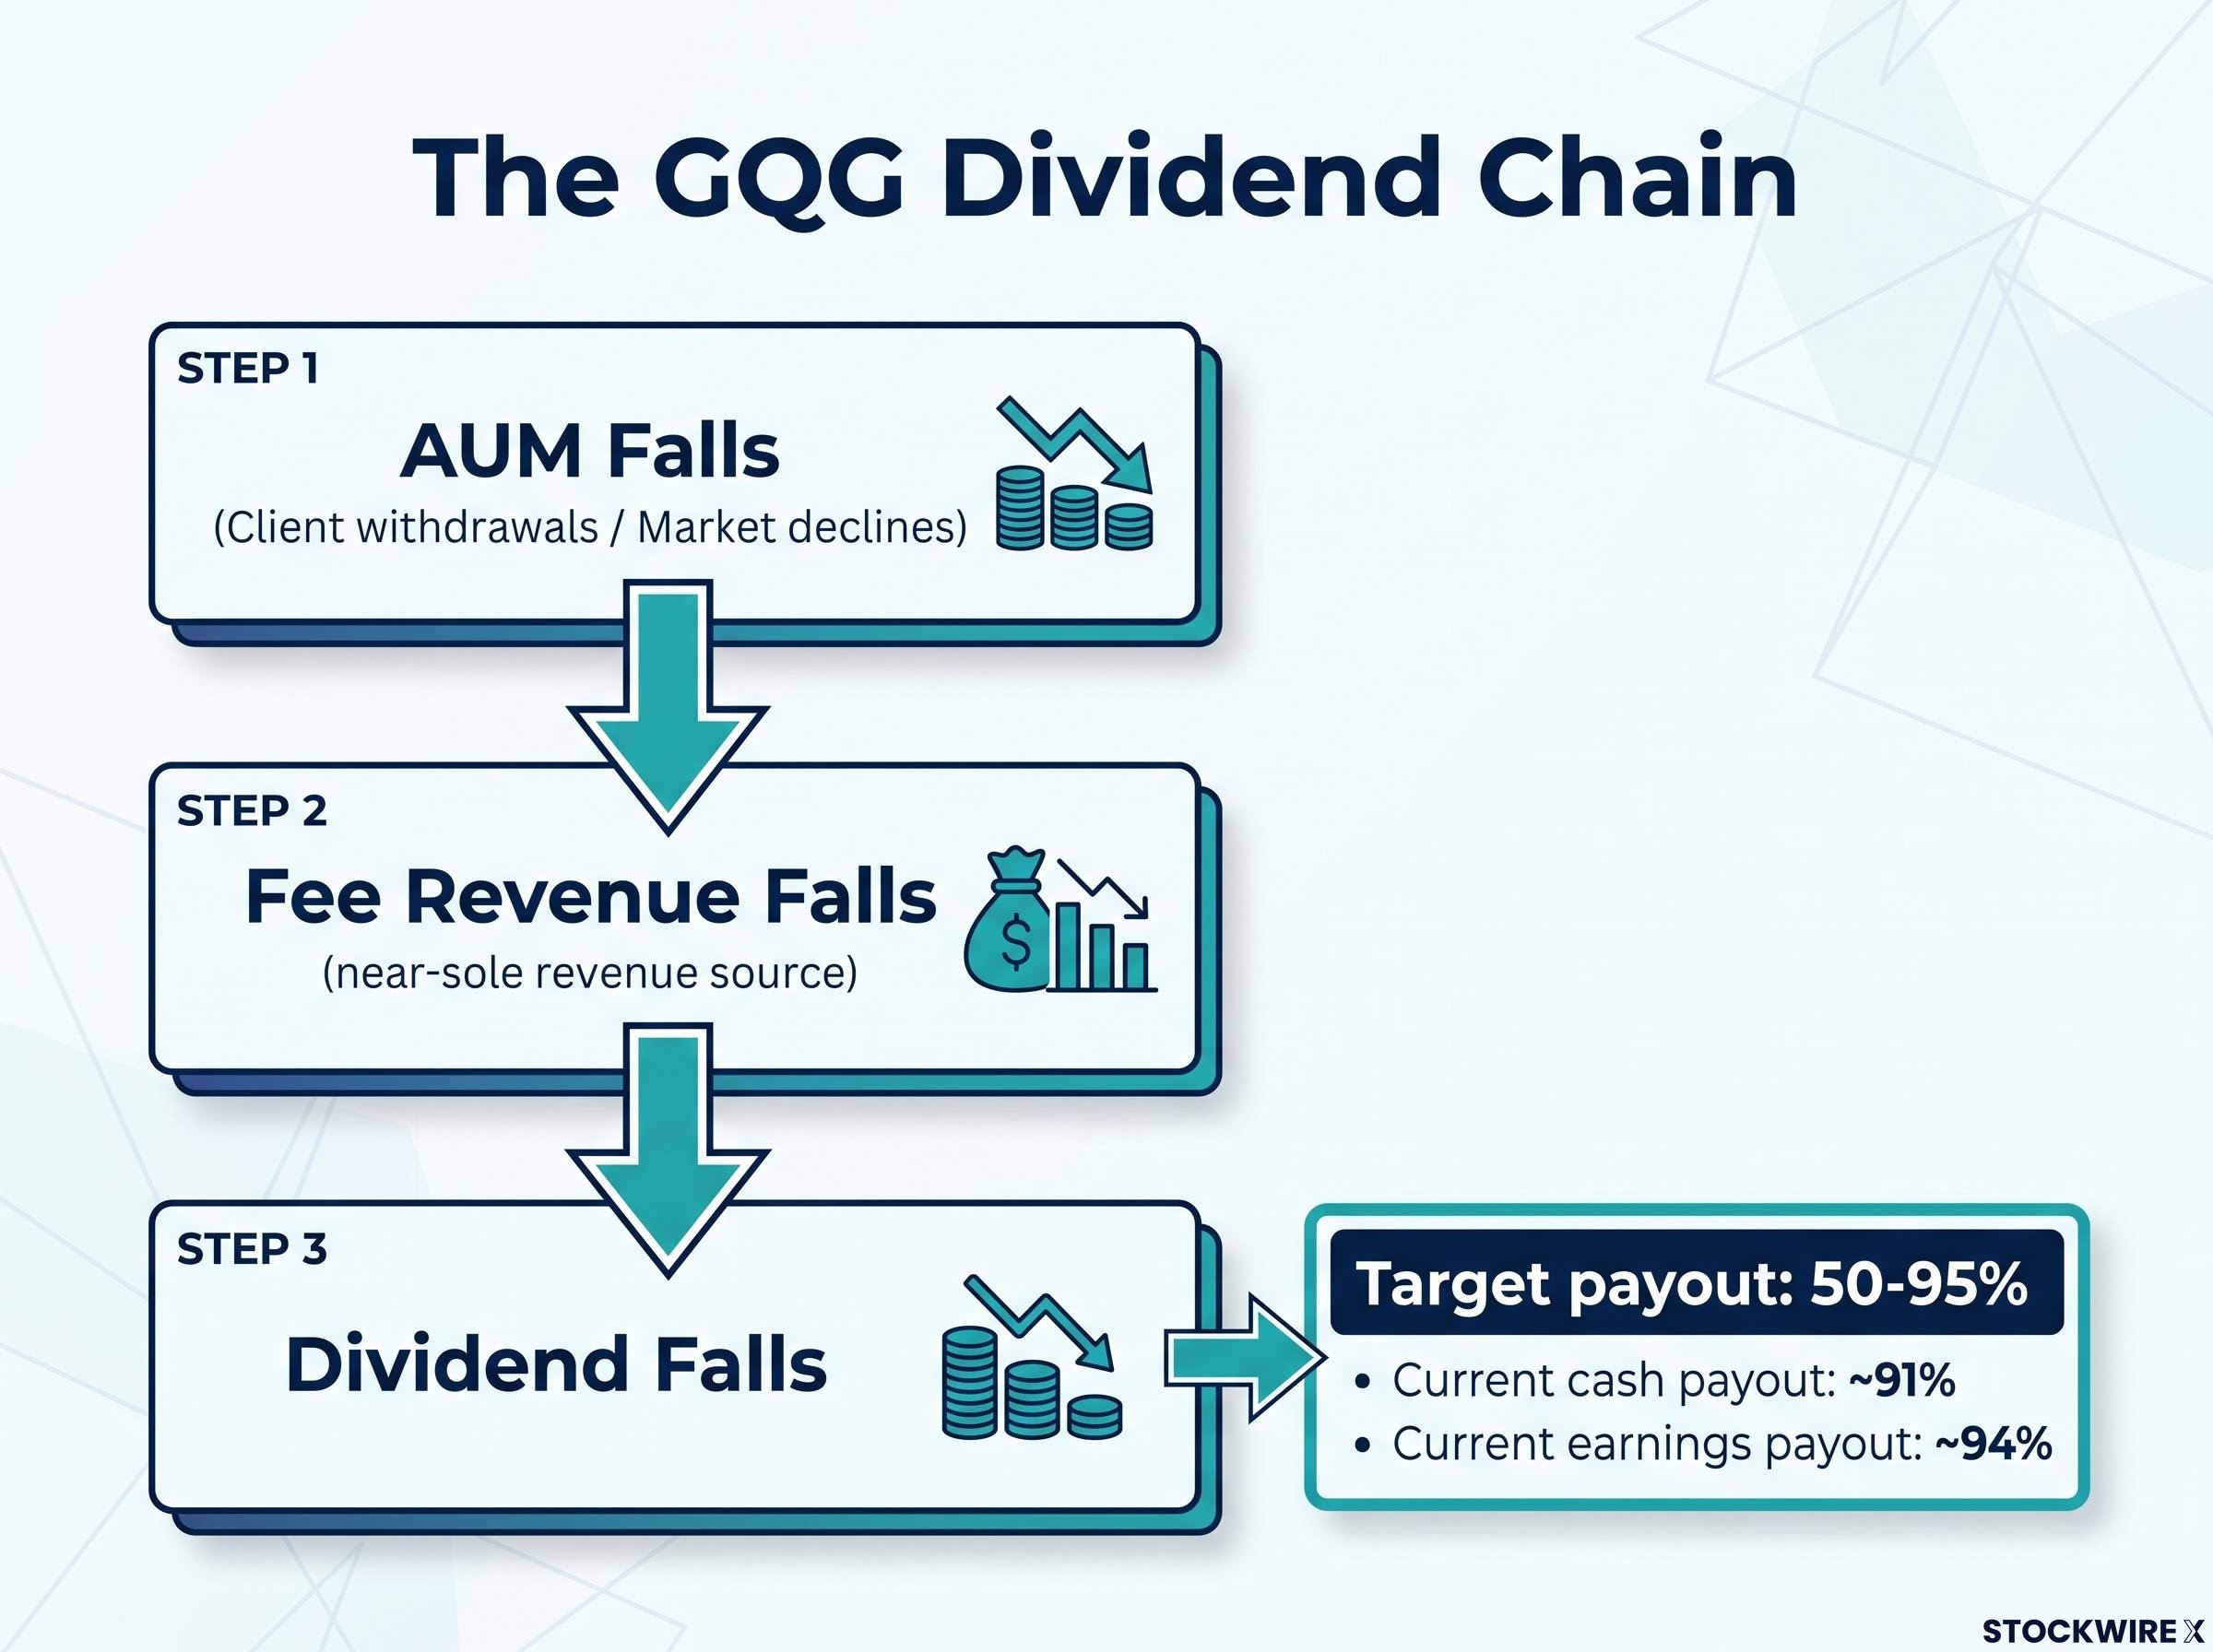
The company targets a payout ratio of 50-95% of distributable earnings. In practice, it has been operating at the top of that range, with recent periods reflecting a cash payout ratio of approximately 91% and an earnings-based ratio around 94%. That means almost every dollar of profit goes straight out the door as a distribution.
This near-mechanical structure carries a specific consequence: there is no meaningful retained earnings buffer. When earnings fall, the dividend falls with them. The board does not choose to cut; the formula does.
Payout ratio sustainability is among the first screens a disciplined income investor applies: a ratio above 100% is mathematically unsustainable, but even a structurally high ratio in the 91-94% range leaves a portfolio exposed to any earnings decline, because there is no retained earnings buffer available to smooth distributions.
The chain works like this:
- AUM falls (through client withdrawals or market declines), which reduces the asset base on which management fees are charged.
- Fee revenue falls, because management fees are calculated as a proportion of client assets, and that is GQG’s near-sole revenue source.
- The dividend falls, because a 91-94% payout ratio applied to lower earnings produces a smaller distribution, automatically.
What this means in practice is that you cannot count on management stepping in to protect the dividend during a rough stretch. The payout will move almost dollar-for-dollar with earnings. If you are building income plans around this stock, that variability needs to be priced into your assumptions from the start.
When big ASX news breaks, our subscribers know first
The AUM outflow problem is getting worse, not stabilising
The fee revenue that feeds the dividend depends on the size of the asset base. That base is shrinking, and the pace of the shrinkage is accelerating.
Monthly outflow figures show a worsening trend: client withdrawals came to US$1.4 billion in April 2026, climbed to US$1.9 billion in May, and then surged to US$3.2 billion in June. The heaviest redemptions have been concentrated in the International and Emerging Markets strategies.
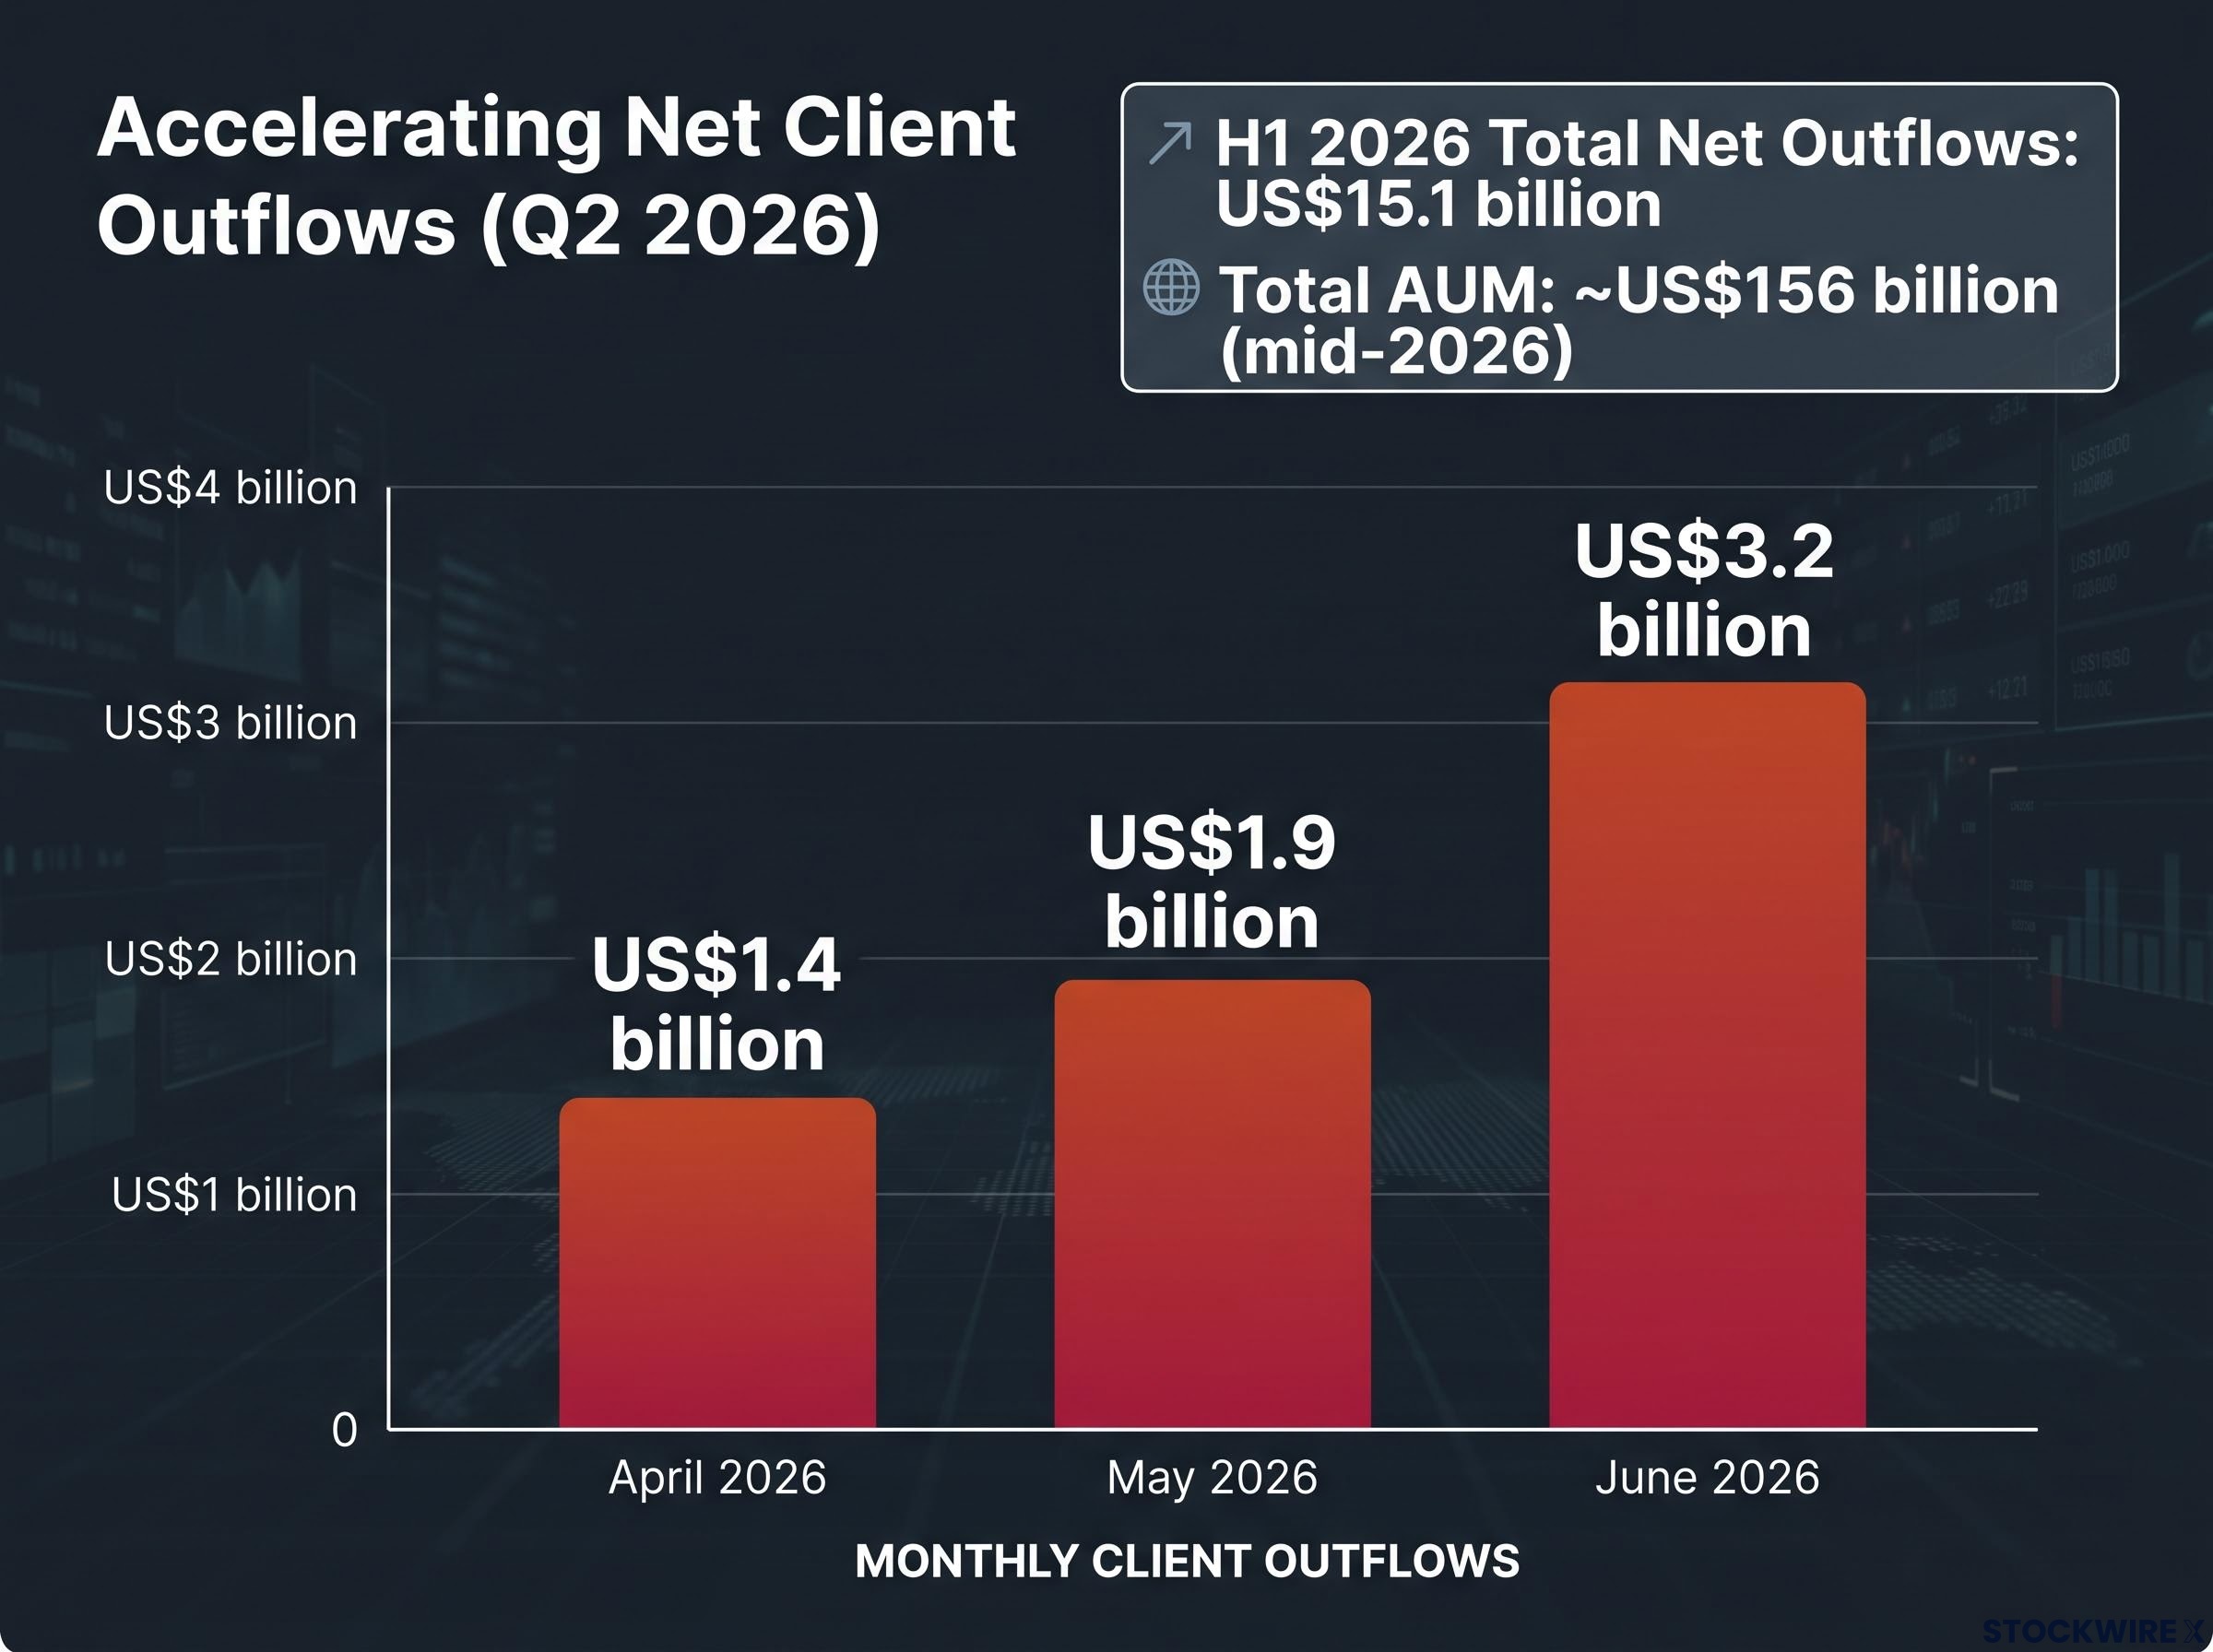
| Month | Net Client Outflows (USD) |
|---|---|
| April 2026 | US$1.4 billion |
| May 2026 | US$1.9 billion |
| June 2026 | US$3.2 billion |
| H1 2026 Total | US$15.1 billion |
H1 2026 total net outflows: US$15.1 billion, according to GQG Partners reported figures and Macquarie Research, July 2026.
Total AUM stood at approximately US$156 billion as of mid-2026. Three consecutive months of accelerating outflows is not a one-off event that might self-correct next quarter. It is a trend that is actively eroding the fee-generating base, and because of the mechanical payout structure outlined above, every dollar of AUM lost feeds directly into a smaller future dividend.
This is the most forward-looking variable available to you. If you are watching only the current yield, you are looking at yesterday’s number.
What Macquarie’s revised forecasts show about the dividend path
Macquarie Research revised its GQG forecasts in July 2026 following the June fund flow data, and the numbers trace a clear cause-and-effect sequence from falling revenue through to a shrinking dividend.
| Metric | FY25 Actual | FY26 Est. | FY27 Est. | FY28 Est. |
|---|---|---|---|---|
| Net Revenue (USD) | US$808M | US$767M | US$676M | US$643M |
| EPS (US cents) | 15.8¢ | 14.5¢ | 11.2¢ | 10.8¢ |
| DPS (US cents) | 14.6¢ | 13.5¢ | 11.2¢ | 10.1¢ |
Read the DPS row from left to right. 14.6 US cents in FY25 becomes 10.1 US cents by FY28, a decline of roughly 31% over three years. That is not a projection of what the board might choose to do; it is the near-mathematical output of applying a 91-94% payout ratio to a declining revenue line. Revenue falls because AUM falls. Earnings fall because revenue falls. The dividend follows, automatically.
Broader analyst consensus reinforces the Macquarie view. Forward yield estimates sit at approximately 10.9%, already below the 12-13% trailing figure.
Forward yield: approximately 10.9%, versus a trailing yield of 12-13%. The gap tells you consensus already expects the dividend to compress, not hold.
If you hold GQG for income today, the 12.4% headline is a trailing figure. The forward income path is materially lower unless AUM flows reverse.
Why a high yield in an asset manager can mean two very different things
A double-digit yield catches attention. The question is what kind of attention it deserves. There are two fundamentally different reasons a stock can yield 12%:
- Exceptional, sustainable cash generation: the business produces so much free cash flow that even a generous payout leaves earnings growing, and the market is simply slow to price it in.
- Market-implied dividend compression: the share price has been marked down because investors expect the payout to shrink, and the elevated yield is a symptom of that scepticism rather than a signal of value.
GQG, in its present state, fits more naturally into the second category. The share price has already been discounted to reflect the risks outlined above, and that discount is what mechanically inflates the yield percentage. A falling numerator (expected dividend) divided by a falling denominator (share price) can still produce a large ratio, but that ratio is not telling you the income stream is safe.
ASX payout ratios average 70-75% of earnings, well above the developed-market norm, and dividend trap warning signs on the ASX frequently include exactly this pattern: a falling share price mechanically inflating the headline yield while the underlying earnings trajectory points in the opposite direction.
What the share price is already pricing in
The forward yield of approximately 10.9% sitting below the trailing 12-13% is the market’s way of communicating an expectation: the dividend will be smaller next year than it was last year. That does not make GQG a bad investment. It does mean the income stream is not equivalent to a double-digit coupon from a fixed instrument. It is variable, directionally downward under current conditions, and dependent on a single business input, AUM, that is currently deteriorating.
The distinction matters beyond GQG. Any time you see a high-yield asset manager, ask which type of yield you are looking at. The answer determines whether you are buying income or buying risk.
What Australian income investors need to adjust for
The headline yield is denominated in US dollars, paid by a US-domiciled company, and carries no franking credits. For Australian income investors, particularly those in SMSFs or drawing a retirement income stream, three adjustments are required before any comparison against domestic alternatives is meaningful:
- Remove the franking credit benefit GQG cannot provide. GQG Partners Inc. is headquartered in Fort Lauderdale, Florida, and listed on the ASX via CDIs. Its dividends are structurally unfranked. This is a permanent feature of the listing structure, not a temporary condition.
- Apply the USD-to-AUD conversion rate to the expected DPS. Dividends are declared in US dollars and converted for Australian holders. Recent quarterly payments have equated to approximately AU$0.049-0.051 per share after conversion, but that figure moves with the exchange rate on top of the underlying earnings variability.
- Compare the result against a fully franked domestic alternative at the equivalent gross yield. For an SMSF investor in pension phase paying zero tax, a 6% fully franked yield is equivalent to approximately 8.6% on a gross basis once franking credits are refunded. An unfranked 12% yield needs to clear that bar on an after-tax basis, and once you apply the conversion and factor in the declining DPS trajectory, the gap narrows considerably.
For an SMSF in pension phase, calculating the precise franking credit entitlement on a fully franked domestic holding uses the 30/70 formula: a $1,000 cash dividend carries a $428.57 attached credit, refundable in full by the ATO, and that is the gross yield benchmark any unfranked alternative must clear.
For a zero-tax SMSF investor, a 6% fully franked yield grosses up to approximately 8.6%. That is the benchmark against which GQG’s unfranked, USD-denominated, and declining yield should be measured.
The effective after-tax yield you receive from GQG is materially below the nominal 12.4%. That gap needs to be calculated, not assumed away, before you compare it against CBA, Macquarie, or IAG on a headline basis.
What would need to change for the GQG income thesis to hold
The bear case is documented above. Here is what a recovery would need to look like.
Net client flows are the single most important variable. The three-month acceleration from US$1.4 billion in April to US$3.2 billion in June is the benchmark. Any improvement would first need outflows to decelerate, then stabilise near zero, then reverse into positive territory. Until that sequence begins, fee revenue and dividends remain on a downward path.
One genuine positive that distinguishes this from a truly distressed situation is the balance sheet: GQG holds no debt and its cash position has been growing. That asset-light foundation removes solvency risk from the equation and gives the business the runway to endure an extended period of outflows without facing a capital crisis. That matters, but it matters for business survival, not for income protection. Those are two very different propositions.
Three specific variables to watch:
- Monthly net AUM flows reported by GQG, the most timely indicator of whether the trend is decelerating.
- Macquarie or consensus DPS revisions, which translate the flow data into an updated income forecast.
- The USD/AUD exchange rate, which adds a second layer of variability to the cash you actually receive.
Macquarie’s DPS forecasts decline from 14.6 US cents (FY25 actual) to 10.1 US cents (FY28 estimated). That establishes the floor if current conditions persist. The balance sheet is not a reason to buy for income; it is a reason the business is unlikely to collapse while you wait to see whether flows recover.
For investors reassessing GQG’s role in their income allocation after working through the above analysis, our dedicated guide to building an ASX dividend portfolio covers the sector diversification framework, earnings cover thresholds, and franking credit considerations that distinguish a durable income portfolio from a yield-chasing one.
A yield that reflects the business, not the opportunity
The mechanical chain is straightforward: outflows shrink AUM, AUM shrinks fee revenue, fee revenue shrinks earnings, and a 91-94% payout ratio applied to those earnings shrinks the dividend. Almost automatically.
The forward yield of approximately 10.9% against a trailing 12.4% tells you the direction of travel. Macquarie’s DPS forecasts confirm it, projecting 14.6 US cents in FY25 declining to 10.1 US cents by FY28. For Australian holders, the unfranked, USD-denominated nature of the payout adds structural drag that does not appear in the headline number.
The zero-debt balance sheet is real and valuable. It means GQG is not at risk of the kind of capital crisis that turns a dividend cut into an existential event. But balance sheet strength protects the business, not the income stream.
If you need stable, predictable income, the current structure creates a distribution that will move with a single variable, AUM, that is currently moving in the wrong direction. If you are taking a view that flows will reverse, the downside is bounded by a clean balance sheet, but the income you receive while waiting will likely be lower than the headline yield suggests.
The 12.4% is real today. It is also a backward-looking figure attached to a forward-looking earnings stream under measurable, documented pressure.
This article is for informational purposes only and should not be considered financial advice. Investors should conduct their own research and consult with financial professionals before making investment decisions. Financial projections referenced are subject to market conditions and various risk factors. Past performance does not guarantee future results.