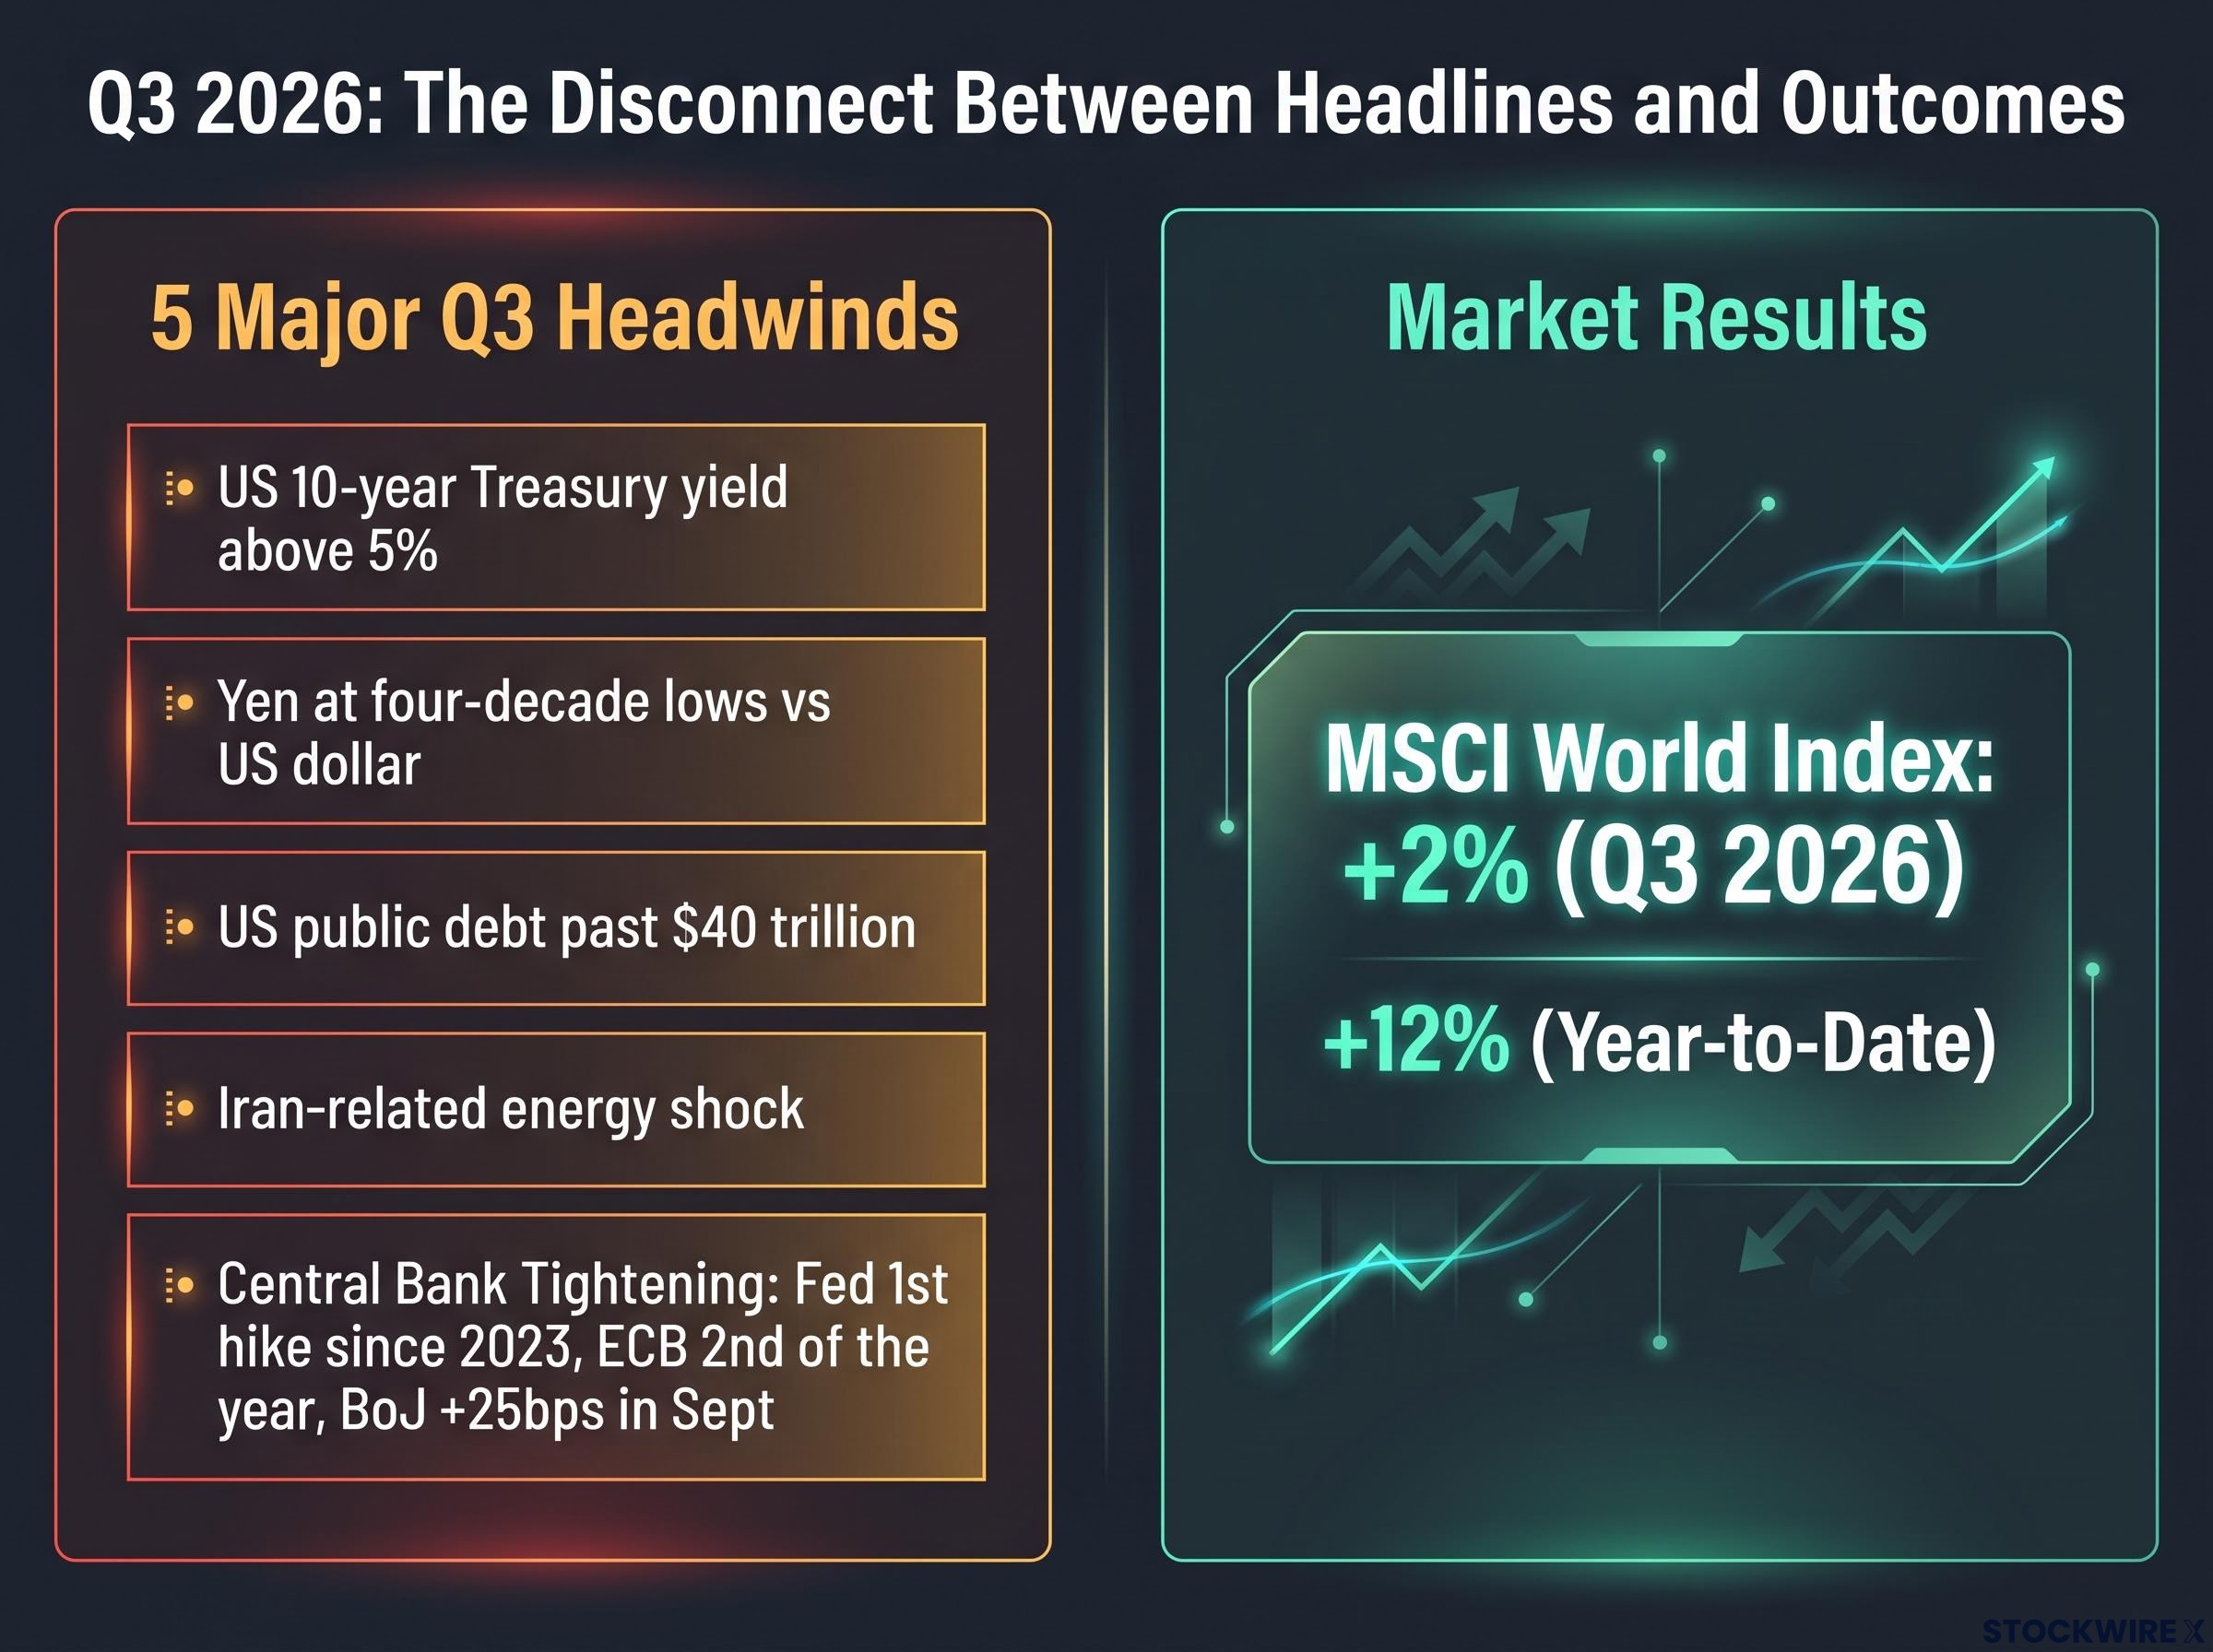
A 10-year US Treasury yield above 5%. Total US public debt past $40 trillion. The yen sinking to four-decade lows, forcing the first coordinated intervention with Washington in nearly three decades. An active energy shock tied to Iran. And rate increases from three of the world’s major central banks, all landing in the same three-month window.
That combination would, by most instincts, read as a sell signal.
Instead, global equities finished Q3 2026 near record highs.
The quarter was, in effect, a stress test for one of the most common investor instincts: the urge to treat alarming headlines as a cue to get out. What makes this particular period so instructive is that the stress was not manufactured anxiety. Each of these pressures was real, measurable, and arrived more or less at once.
Markets absorbed them anyway. For anyone trying to understand how the global stock market behaved in Q3 2026, and why, the gap between the headlines and the outcome is the whole story.
Here is the framework for making sense of it: what actually happened, the structural reason markets priced through the noise, and what disposition that leaves you with heading into the next quarter of similar headlines.
The scoreboard: what global markets actually delivered in Q3 2026
Start with the raw numbers, because the interpretation only matters once the baseline is clear.
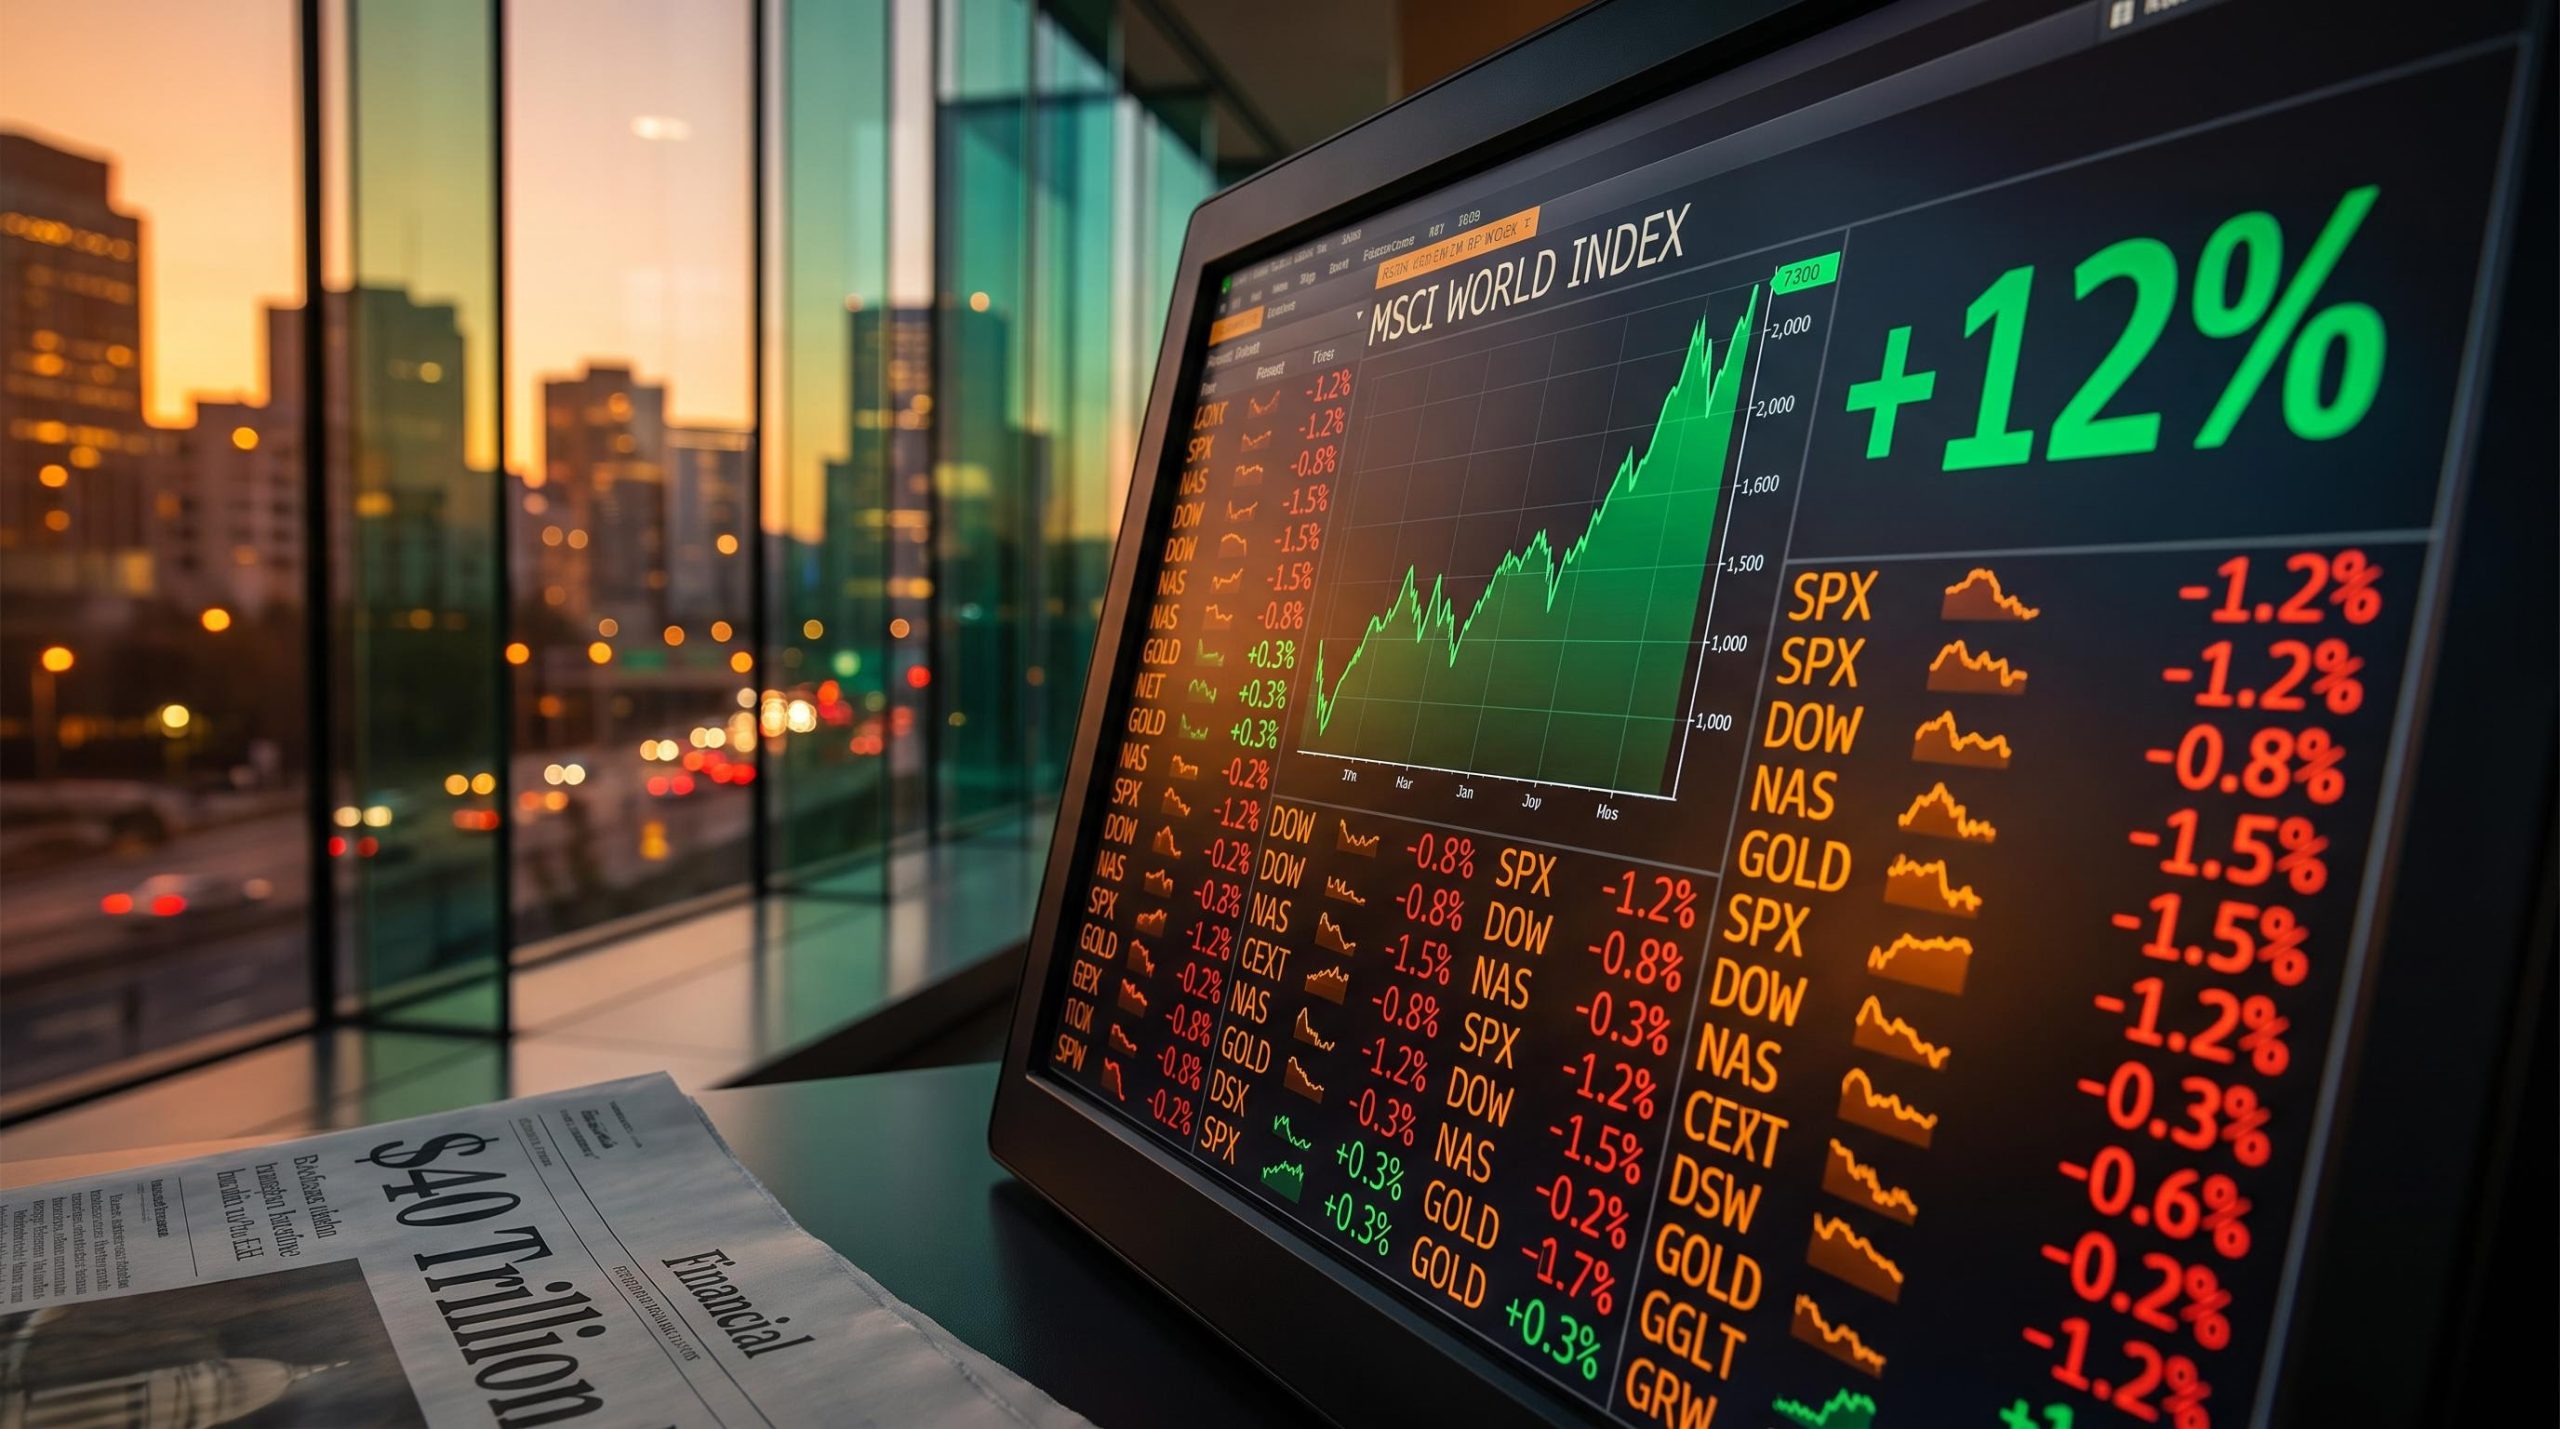
The MSCI World index, a broad measure of developed-market equities, gained roughly 2% over Q3 2026, according to Fisher Investments commentary referencing MSCI World data published on 2 October 2026. By quarter-end, the index sat up approximately 12% on a year-to-date basis.
MSCI World, year to date by Q3-end: approximately +12%
A word on sourcing before going further. As of 3 October 2026, finalised Q3 figures had not yet been independently confirmed by named financial data publications beyond the original source, so treat the precise numbers as the best available rather than the last word.
What the headline return conceals is the shape of the quarter. The path to that 2% gain was anything but smooth, and the trajectory is where the lesson lives.
The three months broke into three distinct phases:
- July: a moderate pullback. Markets drifted lower as the headwinds accumulated and sentiment soured.
- August: a sharp recovery to record levels. Equities not only clawed back the July decline but pushed through to new highs.
- September: consolidation. Relatively flat movement as markets held their ground after the August surge.
That sequence is the point. The window of maximum anxiety, July, and the window of maximum return, August, sat directly next to each other.
For you as an investor, the quarterly figure carries a plain implication: staying invested through July’s pullback, rather than acting on the headlines driving it, was the single decision that captured August’s recovery. An investor who sold into the July weakness would have crystallised a loss and missed the rebound that followed within weeks.
This was not a quiet quarter dressed up as a win. It was a genuine recovery through genuine adversity, which is exactly what makes the next question unavoidable: how did markets manage it with this much working against them?
When big ASX news breaks, our subscribers know first
Five headwinds, one quarter: the macro stress factors investors had to absorb
Take each pressure in turn, because the cumulative weight is the story.
First, rising sovereign bond yields. The US 10-year Treasury yield climbed above 5% during the quarter, while German Bund and Japanese government bond (JGB) yields reached multi-year peaks over the same stretch. Higher yields raise government borrowing costs and tend to pull capital away from equities, which is why they revived debate about inflation and debt sustainability.
Second, the yen’s collapse. The currency slid to roughly four-decade lows against the US dollar, a slump that fed imported inflation and squeezed Japanese household purchasing power.
Third, US fiscal deterioration. Total US public debt pushed past $40 trillion during the quarter, colliding with those rising yields to intensify questions about the sustainability of government borrowing.
The US Treasury national debt data shows the cumulative borrowing trajectory that pushed total public debt past $40 trillion, a figure that arrived alongside rising yields to sharpen market debate about long-term fiscal sustainability.
Fourth, a geopolitical energy shock. An Iran-related conflict drove energy prices higher, amplifying yen weakness and adding a layer of broad uncertainty across markets.
Geopolitical risk investing research across three prior episodes when oil crossed $100 per barrel shows outcomes ranging from a 40% S&P 500 decline in 2008 to a modest positive return in 2011, a dispersion wide enough to confirm that oil price alone is not a reliable predictor of equity direction.
Fifth, tightening from three major central banks at once. The sequence matters:
| Headwind | Key data point | Why it mattered |
|---|---|---|
| Rising sovereign yields | US 10-year above 5%; Bund and JGB at multi-year peaks | Higher borrowing costs, capital drawn from equities |
| Yen collapse | ~Four-decade lows vs. the US dollar | Imported inflation, weaker household spending power |
| US fiscal stress | Public debt above $40 trillion | Reignited debt-sustainability concerns alongside rising yields |
| Geopolitical energy shock | Iran-related conflict lifting energy prices | Amplified yen weakness and broad market uncertainty |
| Central bank tightening | Fed’s first hike since 2023; ECB’s second of the year; BoJ +25bps in September | Rising rates across three major economies in one quarter |
Add UK political instability on top, and the quarter’s risk inventory reads less like a normal three months and more like a compressed decade.
The simultaneity is what makes this period analytically useful. When five distinct pressures arrive together and equities still finish near record highs, no single factor can explain the outcome. That rules out the easy answers and forces a more structural explanation, which is where the analysis turns next.
Why markets are built to look past the headlines
The explanation is not that investors ignored the news. It is that prices had already moved on it.
Equity markets are forward-looking instruments. According to the Fisher Investments framework, they typically price in conditions anticipated 3 to 30 months ahead rather than reacting to the current headline environment.
The same forward-pricing mechanism that underpinned global stock market performance in Q2 2026 was already visible in that quarter’s oil shock and USMCA resolution, both risks thoroughly pre-priced before their formal conclusions arrived.
Markets price in conditions anticipated 3 to 30 months into the future, not the news cycle currently being read.
This is not optimism, and it is not complacency. It is a structural feature of how prices form. Every buyer and seller is making a bet on future earnings, future rates, and future policy, which means today’s price already reflects the market’s best collective guess about tomorrow’s conditions.
That mechanism is visible in the quarter itself. Much of the bad news driving July’s pullback had been building for months, and by August markets had largely finished adjusting to it, which is why equities could recover to record highs even as the underlying risks remained firmly in place.
Map each major Q3 headwind to the mechanism and the pattern sharpens:
- Rising yields: bond markets had been repricing higher rates well before equities reacted, so the move was anticipated rather than a surprise.
- Yen weakness: currency traders had positioned for Bank of Japan policy and intervention risk long before the formal action arrived.
- Fiscal and debt concerns: the trajectory of US borrowing was known and visible, not a sudden revelation.
- Geopolitical energy risk: the conflict’s market impact was being priced in real time as it developed, not absorbed in one shock.
Contrast this with the reactive instinct many investors feel during genuine stress. The temptation is to sell when a risk feels most acute in the news cycle. The problem is timing: by the moment a threat dominates the headlines, prices have frequently already adjusted, so selling then often means locking in losses after the bad news is priced and missing the recovery that follows.
For you, the practical consequence is a reframe. The question stops being “should I react to this headline?” and becomes “has this already been priced in?” That shift is the difference between reacting to news and investing on conditions, and it is the discipline that separated the investors who captured August from those who sold into July.
One caveat keeps the framework honest. OCBC Group Research cautioned that policy action alone cannot generate durable strength without underlying structural and policy shifts, a reminder that forward pricing explains market behaviour without guaranteeing that every priced-in assumption proves correct.
The yen intervention as a case study in policy coordination and its limits
The yen episode turns the abstract mechanism into something concrete, because it is a textbook case of markets pricing ahead of a policy action and then reacting to it in real time.
On 31 July 2026, Japan and the United States conducted a coordinated yen-support intervention, the first such joint operation in roughly 28 to 30 years, confirmed by a Japan Ministry of Finance statement on 3 August 2026. The rarity alone signals how severe the underlying currency stress had become.
The coordinated yen intervention on 31 July was structurally designed to avoid dollar or Treasury sales precisely because unilateral Japanese action would have flooded the US Treasury market with supply, pushing yields higher at a moment when Washington’s fiscal position was already under acute scrutiny.
The scale was historic. The chronology ran as follows:
- Late April to late May 2026: Japan spent approximately 11.7 trillion yen (around US$73-74 billion) after the yen slid past ¥160 per dollar, its first intervention since 2024.
- 31 July 2026: the coordinated US-Japan action, executed under the framework of the September 2025 US-Japan Finance Ministers’ Joint Statement.
- 30 July to 26 August 2026: Japan spent 15.4 trillion yen (approximately US$96-97 billion), the largest monthly intervention on record.
- September 2026: the Bank of Japan raised its policy rate by 25 basis points, reinforcing the currency support.
- 27 August to 28 September 2026: no interventions recorded, a deliberate pause with authorities signalling continued readiness to act.
By late August, cumulative 2026 intervention had exceeded 27 trillion yen, surpassing the previous annual record of roughly 15 trillion yen set in 2024.
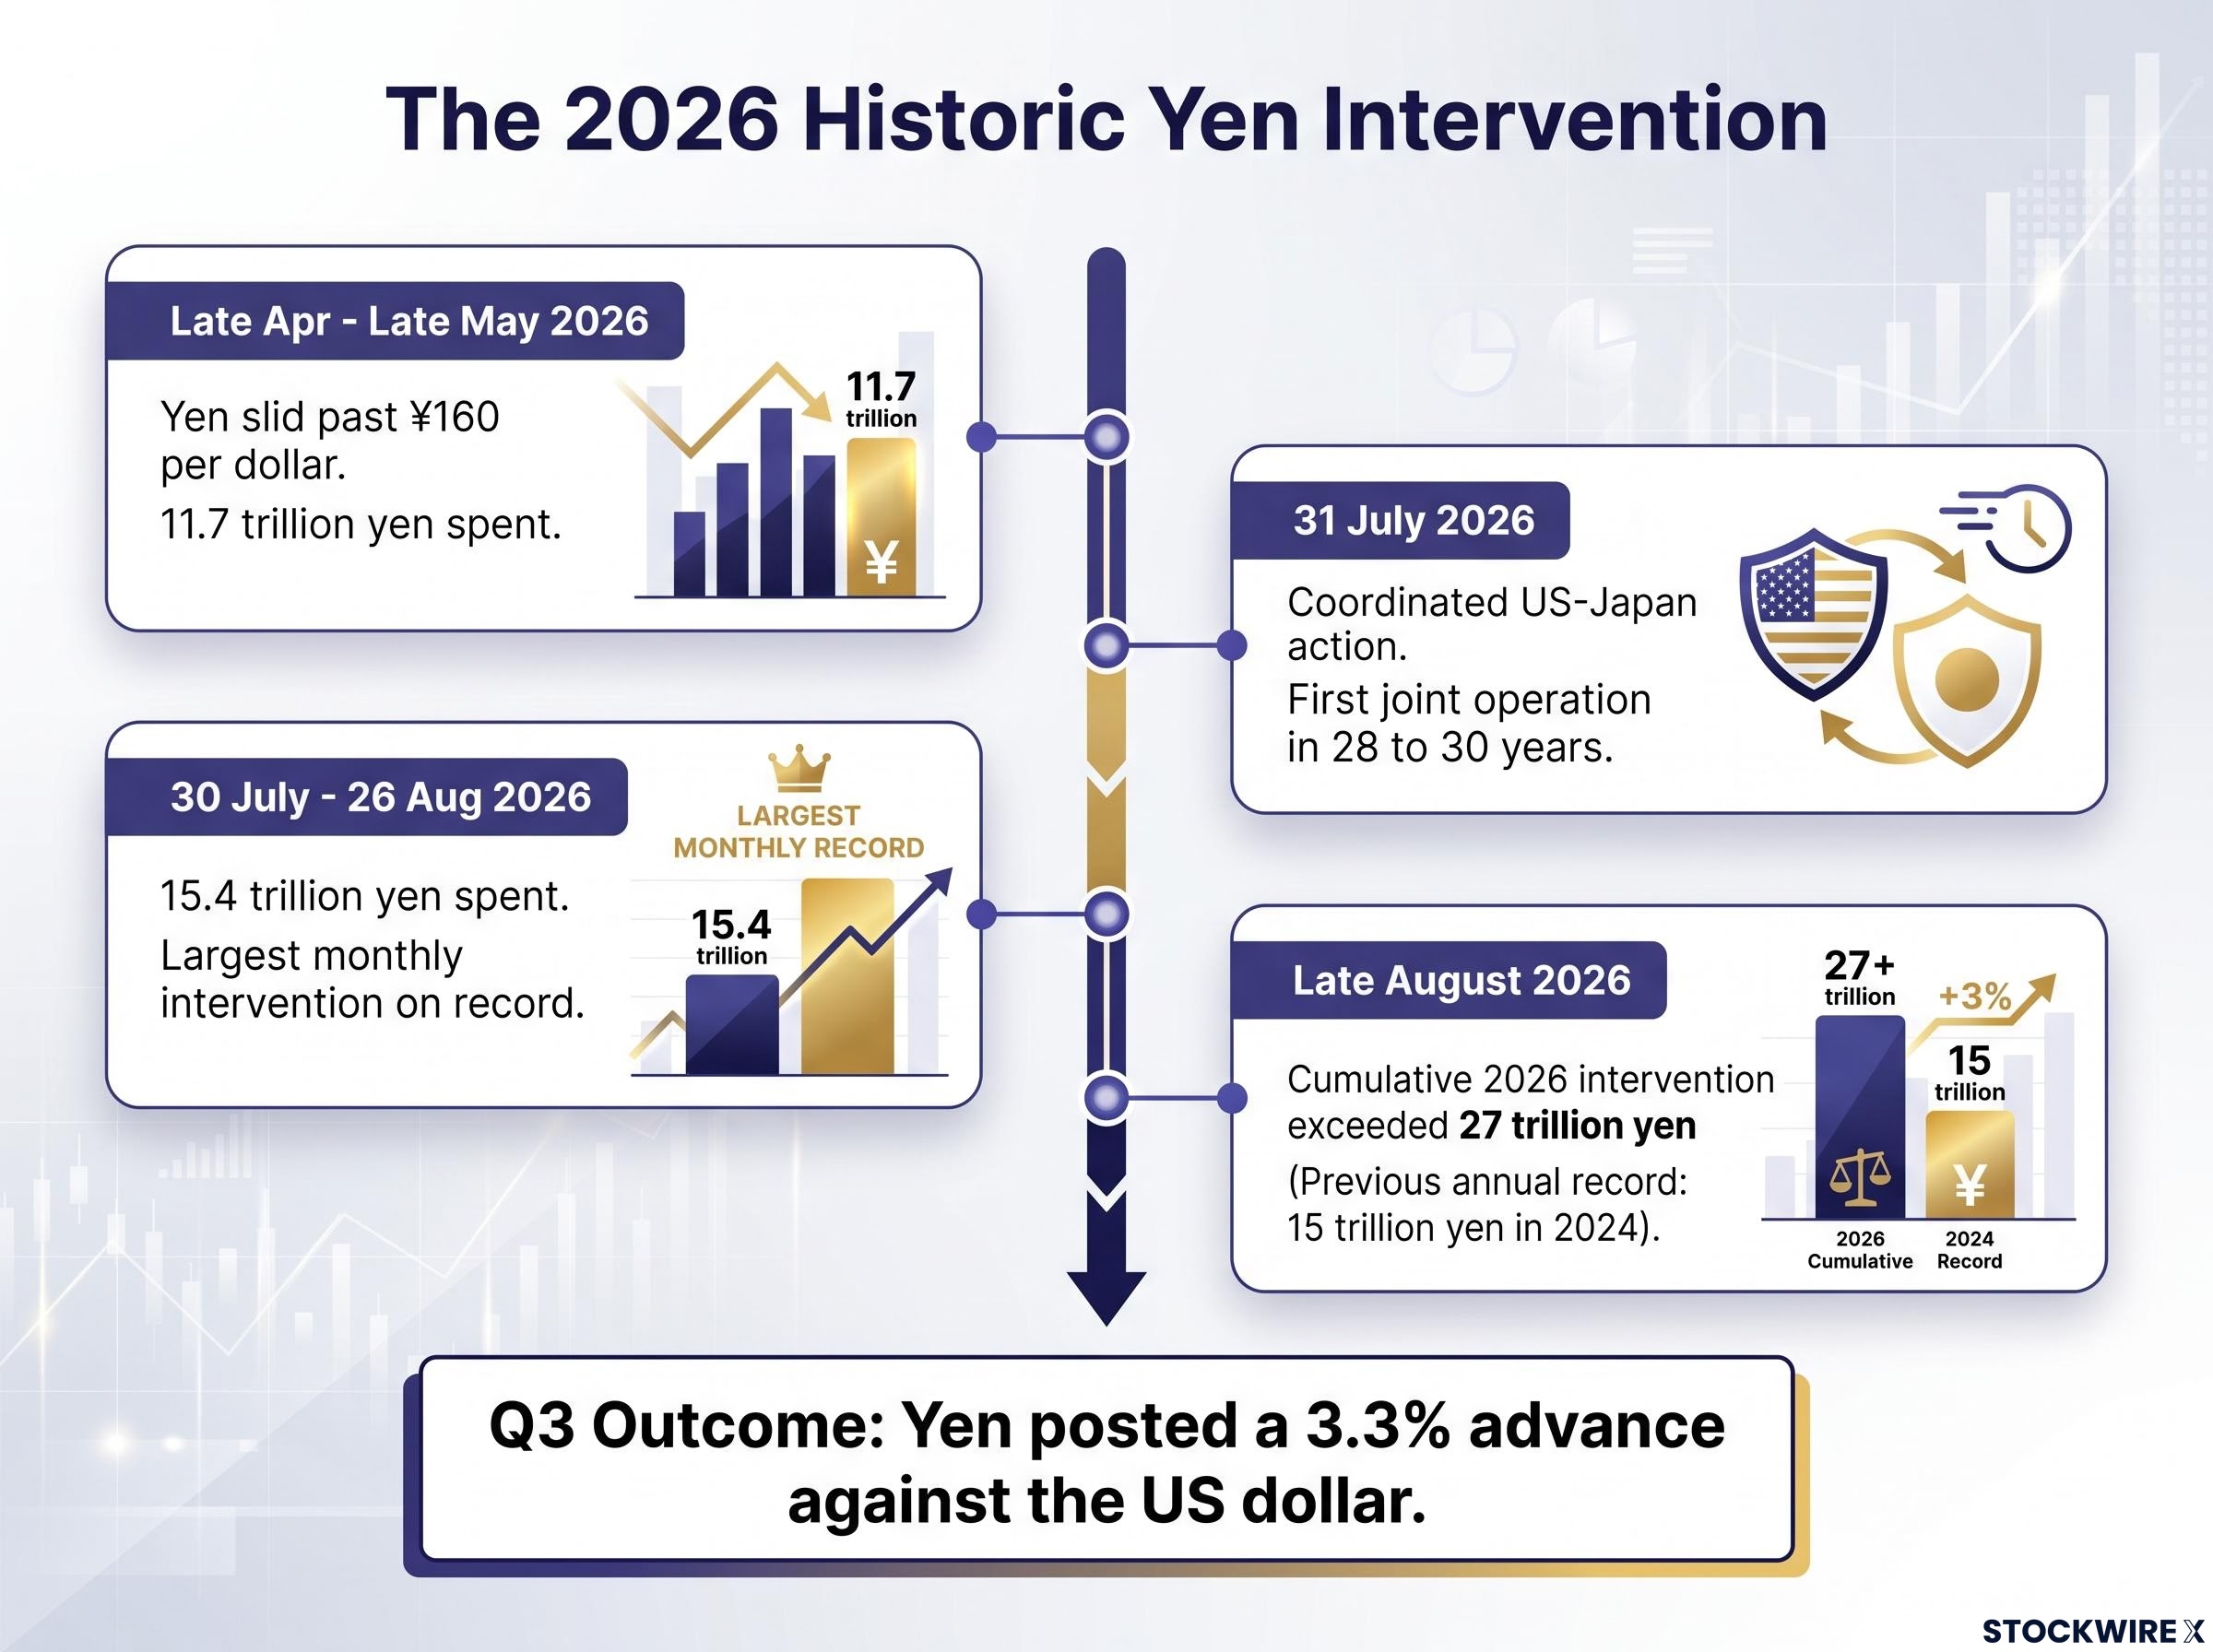
The combined effort worked, at least in the near term. The yen posted a 3.3% advance against the dollar over Q3, the best performance among G10 currencies, according to Deutsche Bank. That recovery fed directly into the broader August rally, illustrating how a policy action markets had anticipated could still move prices when it landed.
Then come the limits.
OCBC Group Research: currency operations alone cannot generate a durable rebound in the yen without broader domestic policy shifts.
Prime Minister Sanae Takaichi echoed the same logic, arguing that lasting confidence in the yen depends on strengthening the domestic economy rather than relying on intervention alone. The message from both is consistent: intervention stabilises, it does not structurally fix.
For you, the yen’s 3.3% recovery is real but contingent. The signal to watch is whether structural reform actually follows, because without it the same forces that drove the currency to four-decade lows remain fully intact. That distinction, between a recovery that signals the all-clear and one that marks only a pause, is the exact judgement any investor has to make when a policy-driven rebound arrives.
What Q3 2026 actually changes for long-term investors
The lesson is not that risk stopped mattering. It is that headline intensity turned out to be a poor proxy for market risk.
Five severe headwinds arrived simultaneously, and global equities still finished near record highs. That does not mean adversity is harmless; it means reacting to the severity of a headline, without accounting for what markets have already priced, is a structurally disadvantaged way to invest.
The year’s accumulated evidence reinforces the point. The MSCI World’s roughly 12% year-to-date gain by quarter-end was built through multiple rounds of genuinely bad news, which is forward pricing doing its work across time rather than a single lucky quarter.
The honest reading acknowledges the limits. Several risks remain live entering Q4 2026:
- Sovereign yields still elevated, with the US 10-year having pushed above 5%.
- The US fiscal trajectory unresolved, with public debt past $40 trillion.
- Geopolitical energy exposure tied to the Iran conflict still active.
- Yen durability dependent on the structural reform that OCBC and Takaichi both flagged as the missing piece.
None of these were erased by Q3’s resilience. The forward-pricing mechanism explains market behaviour; it does not eliminate risk.
The headline environment entering Q4 is not meaningfully calmer than Q3. So the question facing you is not whether these risks persist, because they plainly do. It is whether you carry a framework for engaging with them that does not require you to correctly predict their resolution. Discipline during high-intensity periods, rather than prediction, has historically been the decision that compounds.
The global growth split entering Q4 2026 complicates a simple risk-off reading: eurozone GDP was revised materially upward while Chinese trade data missed on both imports and exports, meaning the macro backdrop supporting equities is regionally uneven rather than uniformly solid.
This article is for informational purposes only and should not be considered financial advice. Investors should conduct their own research and consult with financial professionals before making investment decisions.
Past performance does not guarantee future results. Financial projections are subject to market conditions and various risk factors.