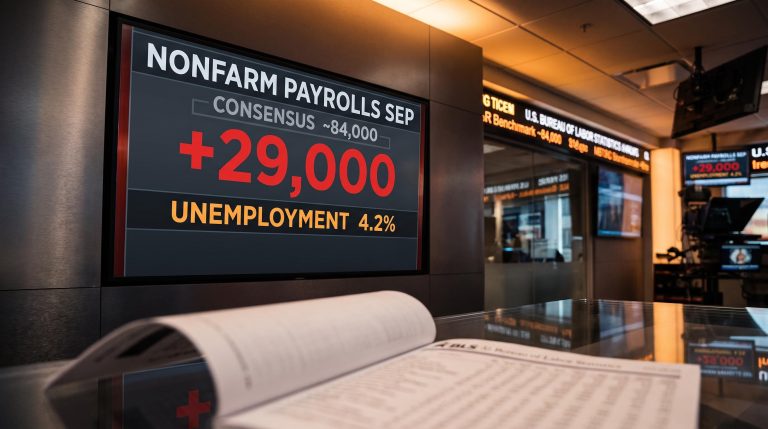
A jobs report landed on 2 October 2026 that almost no economist saw coming: September nonfarm payrolls rose by just 29,000, against a consensus of roughly 84,000-90,000. A miss that severe is exactly the kind of macro signal that historically sends gold surging. Instead, gold spent the session running in place while Bitcoin booked a gain above 3% and held it.
That asymmetry is not a footnote. It crystallises a debate that has been building across macro portfolios for several years: whether Bitcoin has crossed the threshold from speculative asset into functioning macro hedge, and whether gold’s structural headwinds are durable enough to change how investors think about their defensive allocations.
What follows below is not a session recap. It is a framework for understanding when and why these two assets diverge, built around the idea that the right hedge is regime-dependent and that gold’s repeated failures at the same price levels are structural, not random. After reading, the basis for deciding which asset belongs in a hedge allocation, and under which macro conditions, should be considerably clearer.
One data print, two completely different safe havens
To understand the divergence, start with the trigger. The U.S. Bureau of Labor Statistics reported that payrolls grew by just 29,000 in September, with the unemployment rate holding at 4.2%, described officially as little changed. Markets had positioned for several times that many jobs.
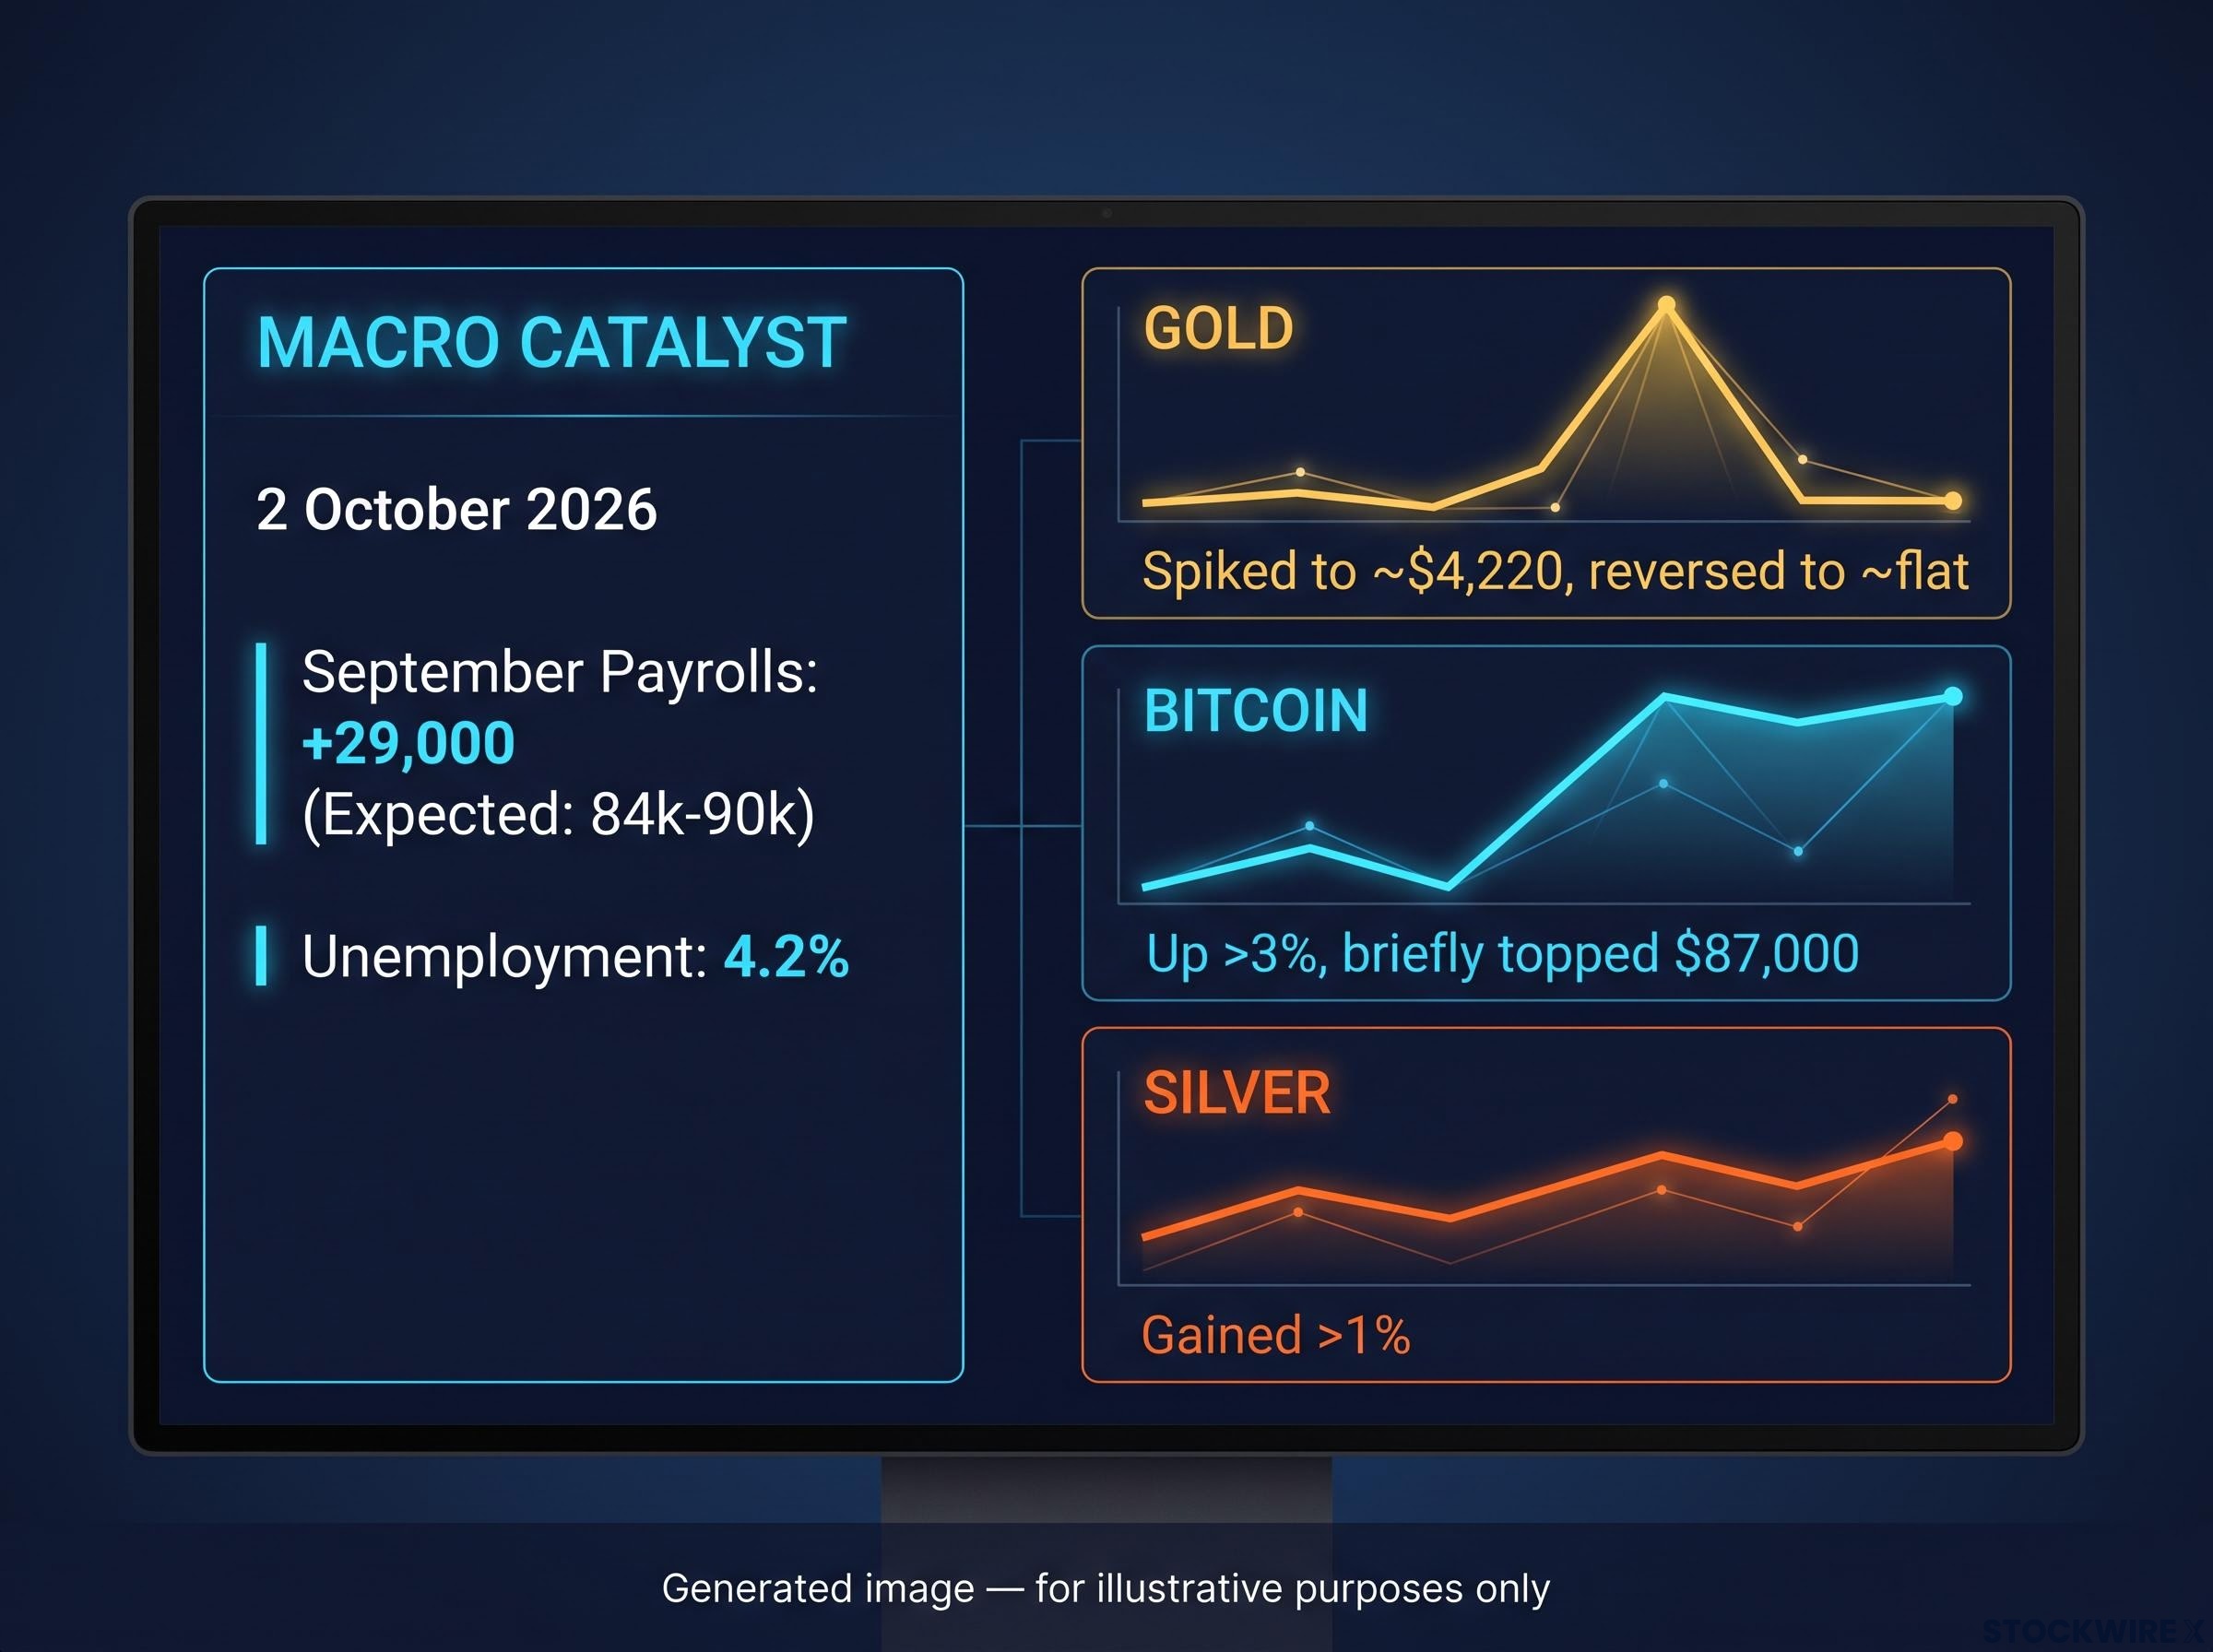
The payrolls miss that set the session in motion +29,000 actual, versus expectations of 84,000-90,000. A soft enough print to push bond yields lower and reset rate expectations in a single release.
A number that weak usually hands gold a clean tailwind. On this session, it did not hold.
Gold’s rally that wasn’t
Gold moved first and fastest. Spot gold briefly traded around $4,220 per ounce in the minutes after the release, the textbook flight-to-safety reaction to soft labour data. December Comex gold futures opened at $4,204.60 and were trading near $4,209.70 as of 6:23 a.m. ET.
Then the spike faded. By the close, spot gold ended essentially flat on the day. The initial surge had been fully surrendered.
Silver gained more than 1% in tandem with gold’s opening move. Analyst commentary from Tasty Live noted that silver held a more constructive technical posture than gold through the session, a distinction worth returning to later, because it suggests the problem on this day was specific rather than sector-wide.
Bitcoin’s different playbook
Bitcoin ran the opposite script. It climbed more than 3% intraday, briefly topping $87,000, a level broadly confirmed across market sources covering the session.
The difference was not the direction. Gold rose and Bitcoin rose. The difference was retention: Bitcoin held onto its gains into the close while gold’s advance evaporated.
One note on the figures. The original analyst commentary framed Bitcoin’s move as bringing it within proximity of $90,000; the confirmed intraday high across multiple outlets was approximately $87,000. The directional read holds even where the precise level does not, and the behavioural contrast is what matters: gold spiked and faded, Bitcoin advanced and stayed.
That asymmetry is the signal. Something structural, not a random intraday quirk, produced two opposite outcomes from the same catalyst, and the rest of the analysis is an attempt to explain exactly what.
When big ASX news breaks, our subscribers know first
Why gold keeps hitting ceilings it cannot break through
Gold’s faded rally was not bad luck. It was the predictable result of structural forces that a single soft data print cannot override, and they build on one another.
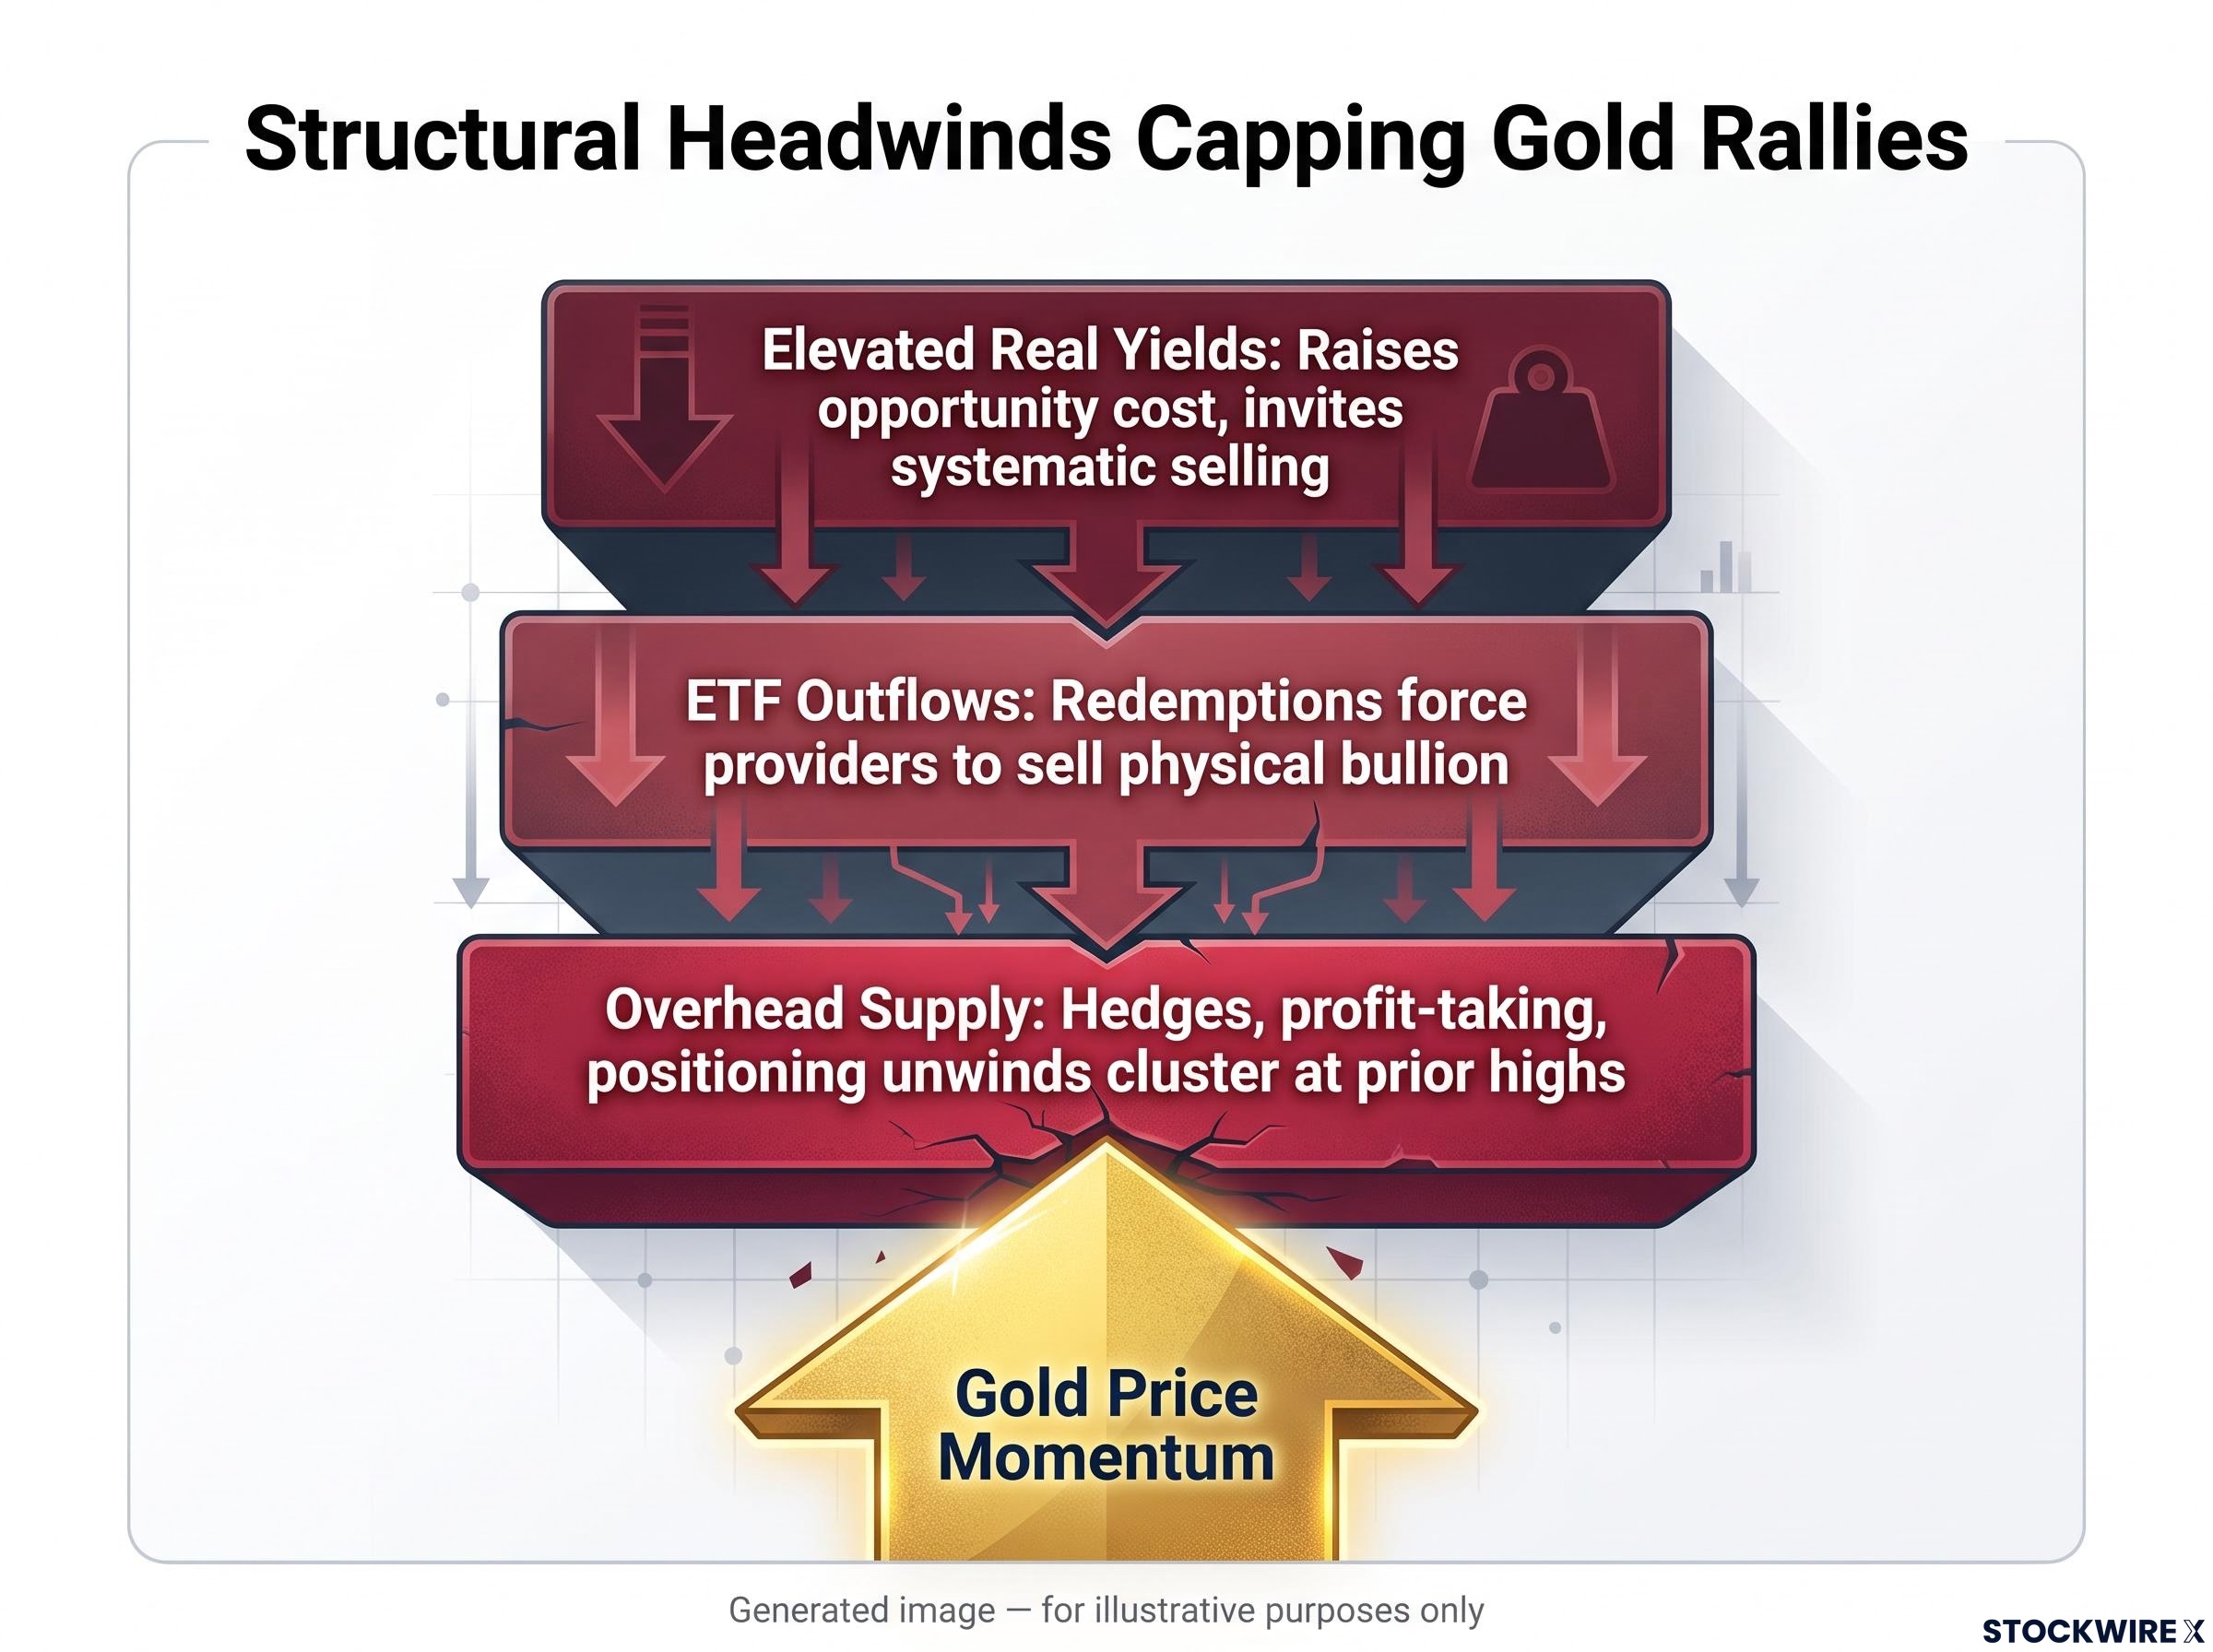
Start with real yields. Gold pays no income, so when inflation-adjusted bond yields are elevated, the opportunity cost of holding it rises and systematic selling tends to meet any strength. Commentary from UBS has tied gold weakness directly to higher real yields and an increased probability of further rate action, and prior episodes show how fast that drag reasserts: gold has hit multi-week lows and dropped more than 2% on renewed rate-hike bets, erasing dovish-print gains within days.
Then comes the flow mechanic. When markets expect rates to stay higher for longer, gold exchange-traded funds (ETFs, pooled investment vehicles that hold physical bullion) see persistent redemptions, which forces providers to sell gold into the market. That selling clusters near prior highs and caps rallies there.
The World Gold Council’s gold ETF flow data shows how persistently redemption cycles have weighed on gold prices through 2025-2026, with North American and European fund outflows creating exactly the kind of clustered selling pressure that caps rallies near prior highs.
Layer on producer hedging and positioning unwinds, and a pattern emerges that traders call overhead supply.
Overhead supply, defined The accumulated weight of sellers waiting at or above a given price level: ETF redemptions, mining company forward sales, and institutional profit-taking all converging near the same reference point, so each rally runs into a wall of supply.
The Tasty Live analyst identified exactly this on the session: substantial overhead supply above a key reference level actively suppressed gold’s ability to sustain its rally. The same commentary flagged a credibility problem, with gold and silver tracking equity market moves rather than acting as independent assets, which undermines their defensive value precisely when a hedge is supposed to work.
The following table consolidates the three load-bearing pieces.
| Structural factor | Mechanism | Effect on gold rallies |
|---|---|---|
| Elevated real yields | Raises the opportunity cost of holding a non-yielding asset | Invites systematic selling into any strength |
| ETF outflows | Redemptions force providers to sell physical bullion | Creates persistent supply that caps advances |
| Overhead supply | Hedges, profit-taking and positioning unwinds cluster at prior highs | Builds technical resistance that repeatedly turns rallies back |
For anyone holding gold, the read is this: in a rate-plateau environment, each failed rally is not an isolated disappointment but the same structural ceiling reasserting itself. That tells you to weigh gold exposure against durable real-yield pressure rather than reacting to individual dovish prints as though they signal a breakout.
The structural gold thesis built on central bank buying, fiscal deficits, and reserve de-dollarisation does not evaporate on a single session of failed price action; the forces identified in August 2026 remain intact even as overhead supply and real yield pressure prevent them from translating into near-term price gains.
What it actually means when Bitcoin acts like a macro hedge
Bitcoin’s retained gain demands the opposite question. Does holding onto a dovish-surprise rally make it a genuine macro hedge, or does it just mean the stars aligned for one session? Start with the strongest version of the bull case, then narrow it.
The institutional legitimacy argument
The institutional case rests on a few pillars. Bitcoin has a fixed, programmed supply, trades 24 hours a day across borders with deep derivatives markets, and sits outside any single sovereign’s control, features proponents argue make it a hedge against monetary debasement and policy risk.
The infrastructure has caught up to the narrative. Regulated futures, options, and spot exchange-traded products in major jurisdictions let hedge funds and asset managers hold Bitcoin inside existing risk frameworks, so flows around jobs reports and Fed meetings increasingly resemble macro positioning rather than retail speculation.
Institutional Bitcoin adoption has moved well beyond individual portfolio allocation: as of September 2026, 195 public entities hold approximately 1.23 million BTC inside engineered treasury structures combining convertible notes and fiat buffers, a structural shift that helps explain why Bitcoin now draws macro-positioned capital on dovish surprises rather than purely retail speculation.
BlackRock CEO Larry Fink has described Bitcoin in “digital gold” terms publicly since 2023, a marker of how mainstream the store-of-value framing has become.
Where the evidence actually supports and where it does not
The skeptical camp is just as substantial, and deserves equal weight.
The high-beta counterargument JPMorgan and others frame Bitcoin as a high-beta proxy for liquidity and speculative risk, pointing to its strong positive correlation with technology stocks across most periods since 2020.
The historical record supports a regime-dependent reading rather than a universal one. Three patterns define it:
- Liquidity abundance (much of 2020-2021): abundant easing and risk-on appetite drove Bitcoin to massively outperform gold.
- Tightening and risk-off (parts of 2022): gold held value while Bitcoin suffered deep drawdowns as speculative positions unwound.
- Dovish surprise without contagion (2 October 2026): soft data, lower yields, no acute flight-to-quality, and Bitcoin captures the upside.
The COVID-19 shock of March 2020 anchors the caution: Bitcoin initially sold off sharply alongside equities, while gold and long-duration Treasuries provided more consistent protection in the first moments of stress. And across major bear phases, Bitcoin has swung 50-80% peak-to-trough, far beyond anything gold typically delivers.
Here is the practical takeaway. Bitcoin’s outperformance on 2 October tells you something real about the current regime, a dovish surprise with no acute risk-off, but it would mislead you badly as a basis for assuming Bitcoin beats gold in every defensive scenario. The macro-hedge role is genuine and regime-dependent at the same time.
Silver’s divergence and what the precious metals split reveals
Return now to silver, because it reframes the entire session. The story on 2 October was not that precious metals failed universally. It was that gold specifically hit a ceiling silver did not share.
Silver’s technical setup looks meaningfully different. According to the Tasty Live analyst, silver broke above a significant resistance trend line around 21 August 2026 and has continued to respect that line as support, the opposite of gold’s repeated failures at overhead supply. Its major prior peak came on 29 January at roughly twice its current level, with the $60 level flagged as a potential base and support zone.
Silver’s relative resilience on 2 October is partly structural: the silver price drivers that matter most, real interest rates, the gold correlation, and Chinese industrial demand, created a different supply-demand context than the one capping gold, which is why the two metals can diverge sharply on the same session from the same macro trigger.
The analyst’s preference, stated plainly Given the overhead supply dynamics capping gold, the Tasty Live analyst expressed a clear preference for silver’s chart over gold’s.
The three-asset picture sits more clearly in one view.
| Asset | 2 October session outcome | Key technical condition | Structural headwind |
|---|---|---|---|
| Gold | Spiked to ~$4,220, reversed to ~flat | Repeated failures at overhead supply | Real yields, ETF outflows, supply overhang |
| Silver | Gained more than 1% | Holding above 21 August breakout line | Less supply overhang than gold |
| Bitcoin | Up more than 3%, briefly topped $87,000 | Retained gains into the close | Volatility, correlation and regime risk |
The implication for your thinking is specific. The ceiling problem is gold-specific, not a precious metals problem, which means treating “precious metals” as shorthand for “gold” risks missing a more constructive option within the same asset class. A blanket rotation out of precious metals and into Bitcoin on the basis of this one session may be an overcorrection that writes silver out of the picture prematurely.
Making an allocation call when safe havens disagree
Pull the three-asset picture together and a usable framework emerges, not a trade to copy. Gold is constrained by structural headwinds that individual data prints are unlikely to overcome. Silver shows a more constructive setup within the precious metals space, anchored by its 21 August breakout and $60 support. Bitcoin can outperform as a macro hedge under specific conditions, a dovish surprise without acute risk-off, but carries risks that limit its reliability as a primary defensive holding.
Those Bitcoin-specific risks deserve equal weight to the bull case:
- Volatility: historical peak-to-trough drawdowns of 50-80%, far beyond gold’s typical range.
- Regulatory uncertainty: legal status, custody and taxation rules can shift across jurisdictions, triggering repricings unrelated to any macro signal.
- Liquidity and market structure: exchange failures and leverage unwinds can thin order-book depth exactly when a hedge needs to be executed.
The most useful question to ask before allocating is which regime the market is actually in. That answer determines which asset is likely to provide genuine protection versus performing well for an entirely different reason.
- Identify the macro trigger type. Is this a dovish data surprise, a tightening shock, or an acute geopolitical event?
- Assess whether risk-off contagion is present. Dovish surprises without flight-to-quality favour Bitcoin; acute stress historically favours gold.
- Map to the asset most historically consistent with that combination. Match the regime to the hedge, rather than chasing whichever safe haven just performed best.
The lesson of 2 October is not that Bitcoin beats gold. It is that the right hedge depends on the regime being navigated, and an investor who can identify regime type before allocating is better positioned than one who reacts after the fact.
For investors wanting to map the full sequence before the next catalyst arrives, our full explainer on macro transmission across asset classes traces how a single geopolitical shock moves oil, equities, bonds, gold, and currencies simultaneously, with worked examples from September 2026.
This article is for informational purposes only and should not be considered financial advice. Investors should conduct their own research and consult with financial professionals before making investment decisions. Past performance does not guarantee future results, and financial projections are subject to market conditions and various risk factors.