
Investors rarely get two clean macro signals landing within four days of each other. This week, they got both: a US-China tariff reduction covering roughly $60 billion of goods on 28 September 2026, and a September jobs report on 2 October 2026 showing payrolls grew by just 29,000 with unemployment at 4.2%.
Each development, read on its own, is already significant. The tariff deal addresses the supply-side inflation worry that has shadowed equity positioning all year. The jobs miss speaks to the demand side, and to what the Federal Reserve does next. They arrived in the same window because they sit at opposite ends of the same inflation-and-growth question that has driven rate expectations throughout 2026.
The interaction is the actual story here. This piece gives you a framework for deciding which of the two signals deserves more weight in your Q4 positioning, and why reading them together produces a more durable conclusion than either does alone.
What the tariff agreement actually delivers, and what it leaves unresolved
On the surface, the deal looks substantial. The US and China agreed to reciprocal tariff reductions on roughly $60 billion of non-sensitive goods, structured as a “30-for-30” framework: each country can import $30 billion of goods from the other at reduced rates. The arrangement followed a bilateral meeting between President Trump and President Xi and grew out of recommendations from the US-China Board of Trade.
The mechanics are more concrete than most trade headlines. On the US side, 1,619 items across 77 product categories gain lower tariffs entering China, spanning agricultural commodities, wood products, cosmetics, and medical devices. Chinese goods moving the other way include small appliances, toys, holiday items, and children’s car seats.
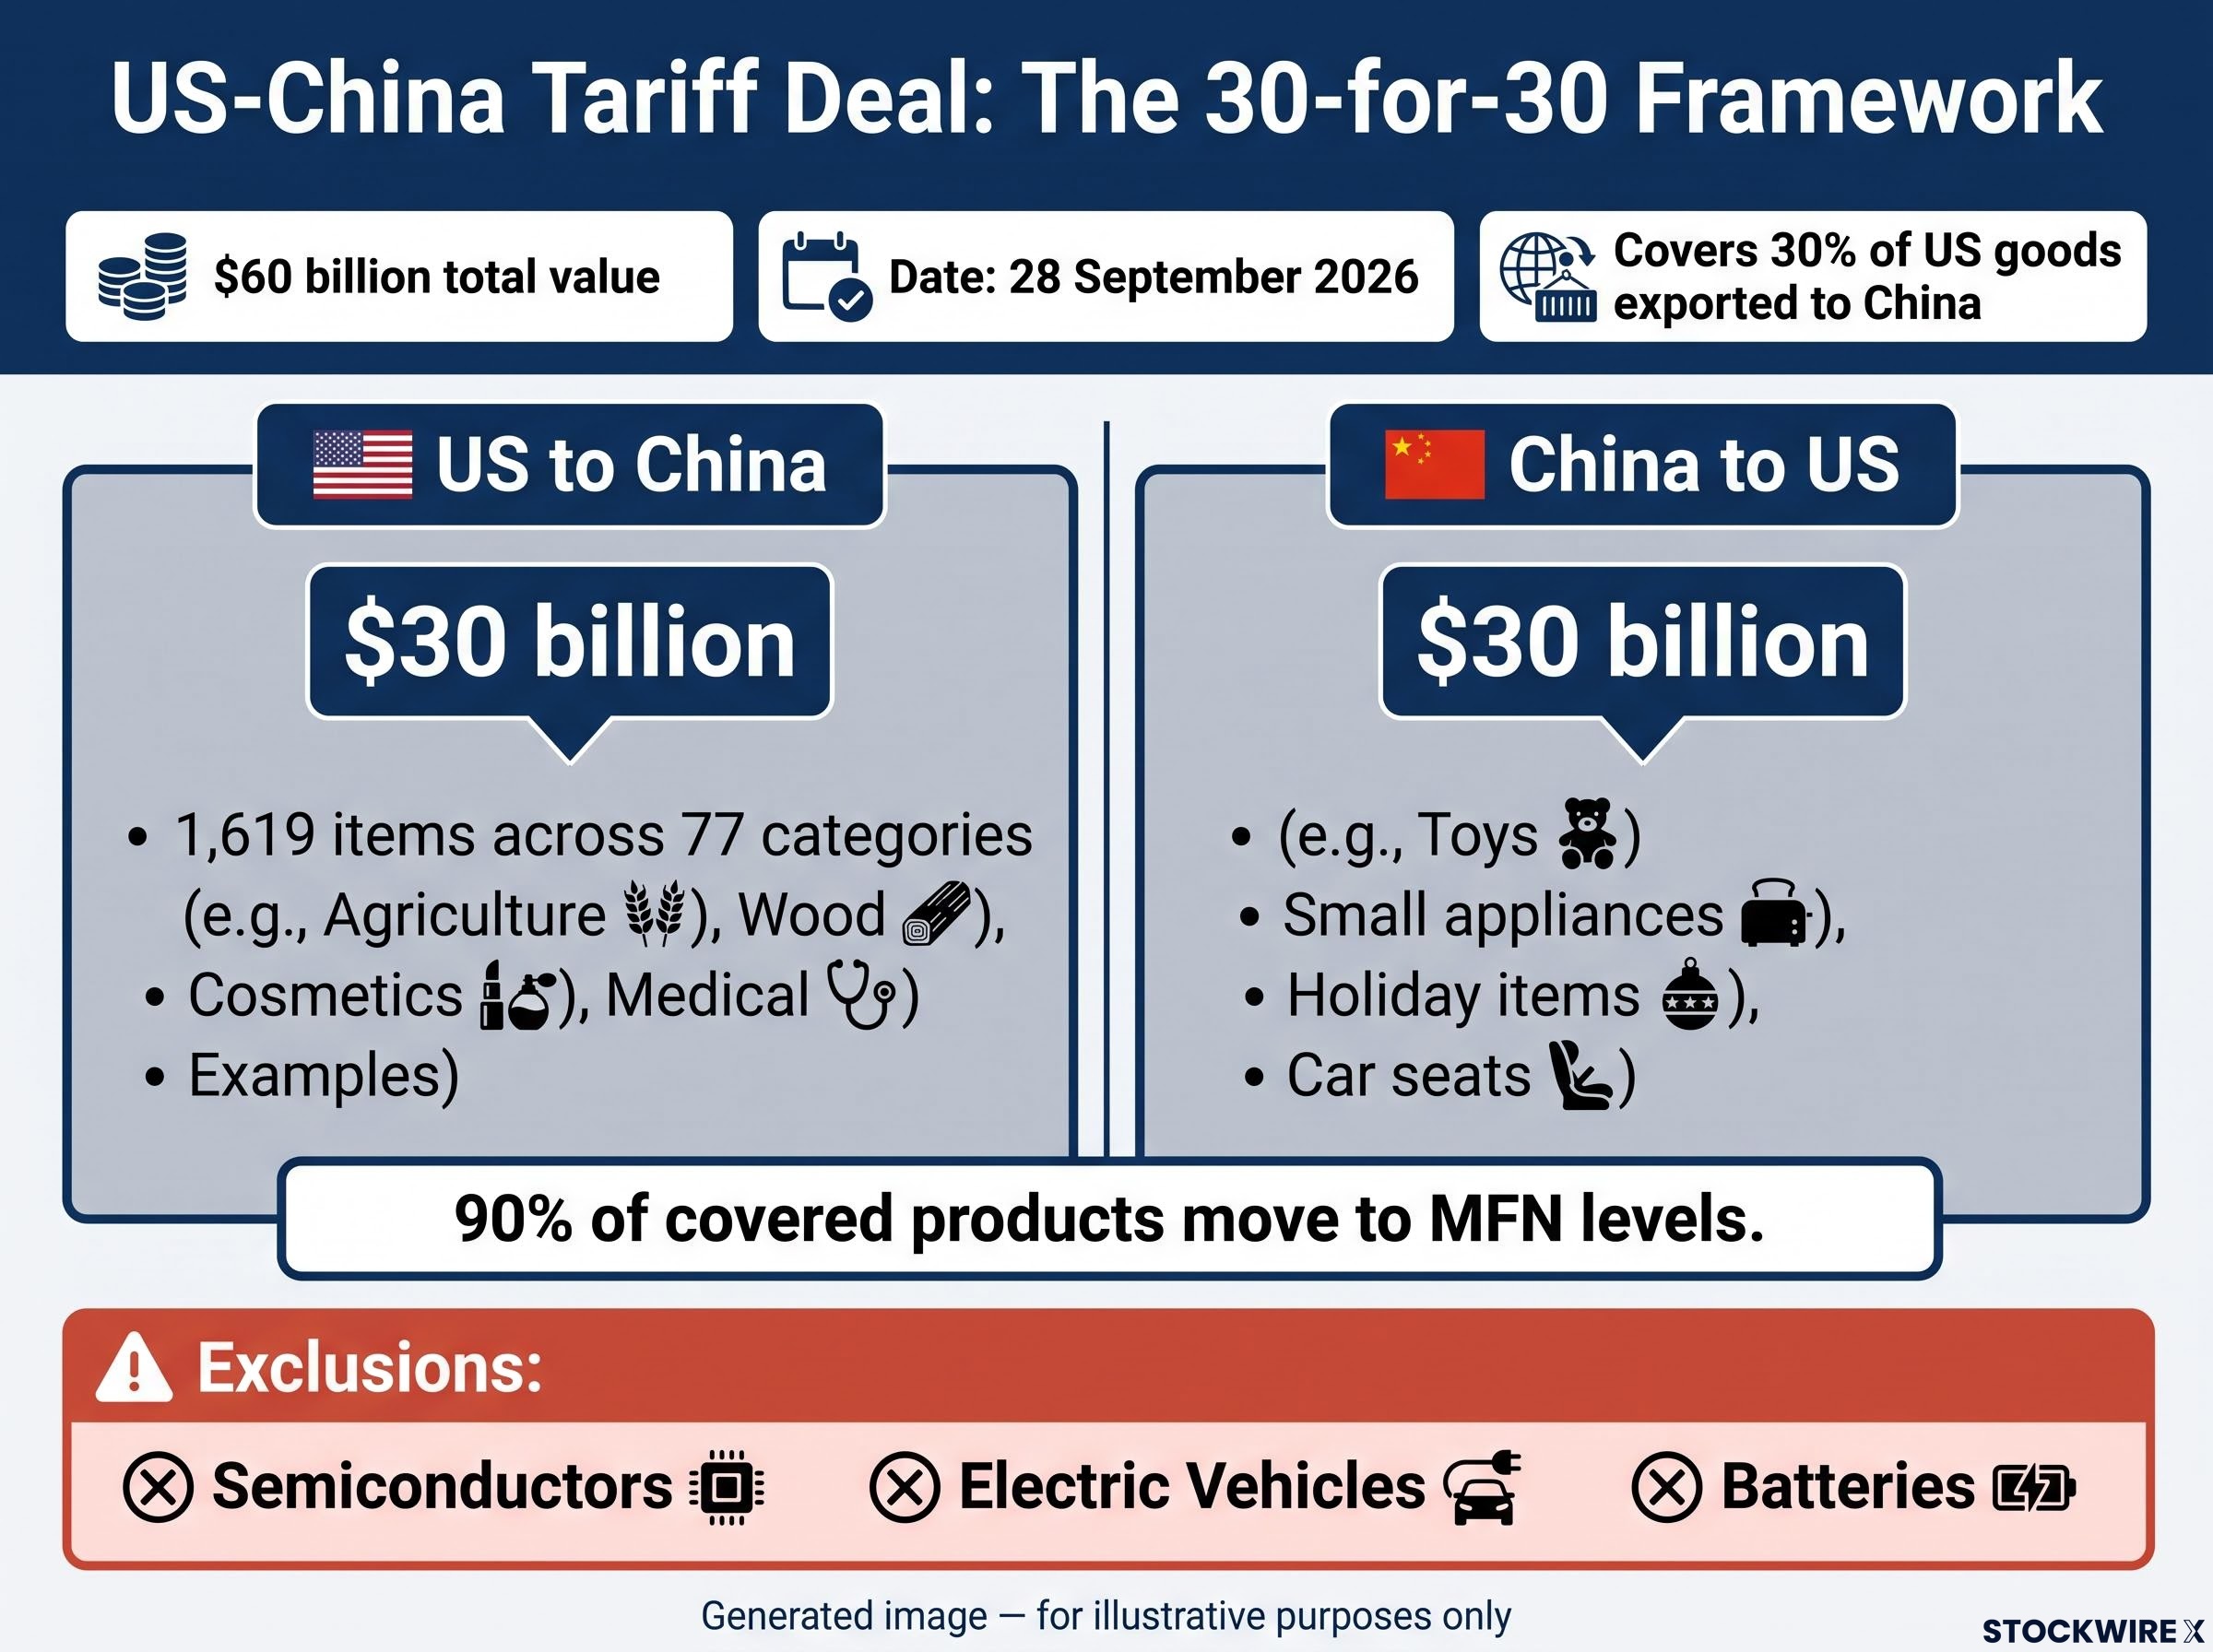
According to the Chinese commerce ministry, tariff rates on approximately 90% of covered products will move to most-favoured-nation (MFN) levels, effectively eliminating the country-specific additional tariffs on those goods.
Here is where the confidence should narrow. The deal explicitly excludes semiconductors, electric vehicles, and batteries, the three sectors that carry the greatest strategic and national-security weight for both governments. These remain under prior tariff regimes.
That exclusion tells you something important: the sectors most central to the rivalry between the two economies have been deliberately ring-fenced out of the agreement. The deal delivers genuine clarity on consumer and agricultural goods, but the highest-stakes friction points are untouched.
The structural fault lines on AI chip export controls and Taiwan sit entirely outside the scope of any tariff negotiation, grounded in national-security law with bipartisan Congressional backing, which means investors who price the trade optimism without discounting those unresolved tensions risk mispricing tail risk in technology and semiconductor portfolios.
There is also an implementation gap. As of 3 October 2026, neither government has released the full tariff rate schedules or complete product lists, so some precise mechanics remain undisclosed. The lists may also be adjusted by mutual agreement, no more than annually.
For your positioning, the lesson is to price the perimeter accurately. The agreement is constructive for sectors inside its scope, US agriculture and consumer-goods supply chains among them, but it offers no cover for the strategic-tech exposure that dominates many growth portfolios.
| Category | Example products | Trade direction |
|---|---|---|
| Agricultural commodities | Corn, wheat, beef, dairy, poultry, seafood | US to China |
| Wood and materials | Wood products | US to China |
| Consumer and medical | Cosmetics, medical devices | US to China |
| Household goods | Small appliances, toys, holiday items, children’s car seats | China to US |
When big ASX news breaks, our subscribers know first
How September’s jobs report changes the Fed calculus
The number that moved markets was not 29,000 on its own. It was the gap. Economists had expected a payroll gain of around 90,000, according to Robert Half’s summary, which means the September print landed 61,000 below consensus. That distance, more than the absolute figure, is what gave the report its force.
The data accumulated into a pattern rather than a single surprise. Three figures tell the deceleration story:
- September payrolls rose 29,000 (BLS, 2 October 2026), well short of expectations.
- August payrolls were revised down to 133,000 from a prior estimate of 162,000.
- The 12-month average monthly gain of 45,000 places September firmly below trend.
Unemployment ticked to 4.2%, with 7.1 million people unemployed. A print this far below forecast, paired with a downward revision to the prior month, signals that the labour market is losing momentum faster than professional forecasters anticipated. That changes the plausibility of another Fed hike materially, not marginally.
The framing split was immediate.
Fed rate path signals from the September FOMC decision sit in direct tension with what the labour data implies: the dot plot projected a median of 4.1% through both 2026 and 2027, yet long-term unemployment indicators were already crossing thresholds that historically precede recession, not stabilisation.
The BLS described payrolls and unemployment as having “changed little” over the month. Robert Half characterised hiring as having “cooled considerably.” Same data, opposite emphasis.
Two readings of the same number
The first reading is genuine weakness. A very small payroll gain, an uptick in unemployment to 4.2%, and a downward August revision together suggest employers are turning cautious, possibly reflecting softer demand or margin pressure. Read as a pattern rather than three isolated points, it looks like a labour market beginning to slow in earnest.
The second reading is normalisation. Against a long stretch of strong gains and low unemployment, modest hiring and a slightly higher jobless rate may simply mark a transition to a sustainable pace. Fisher Investments leans this way, framing the softer data as reducing imminent tightening pressure rather than signalling deterioration.
Fisher Investments also challenges the reflex that slower job growth automatically implies inflation risk. The firm notes that inflation-adjusted wage growth was reportedly negative for much of 2026 even as employment rose, which undercuts the assumption that stronger wages would necessarily be a market negative.
One caveat holds regardless of which reading you favour: September figures are subject to revision, and a single downside surprise can reflect timing or seasonal factors rather than a regime change. Economists generally wait for a multi-month pattern before calling a turn.
Why the combination of these two signals is greater than the sum of its parts
Read separately, each event is a data point. Read together, they describe a shift in the macro backdrop, and that is the distinction worth your attention.
The mechanism is compression from both sides. The tariff agreement reduces trade uncertainty, which lowers supply-side inflation risk. The soft jobs data cools demand-side inflation pressure. The inflation risk premium is being squeezed from two directions at once, which is a different thing from being squeezed from one.
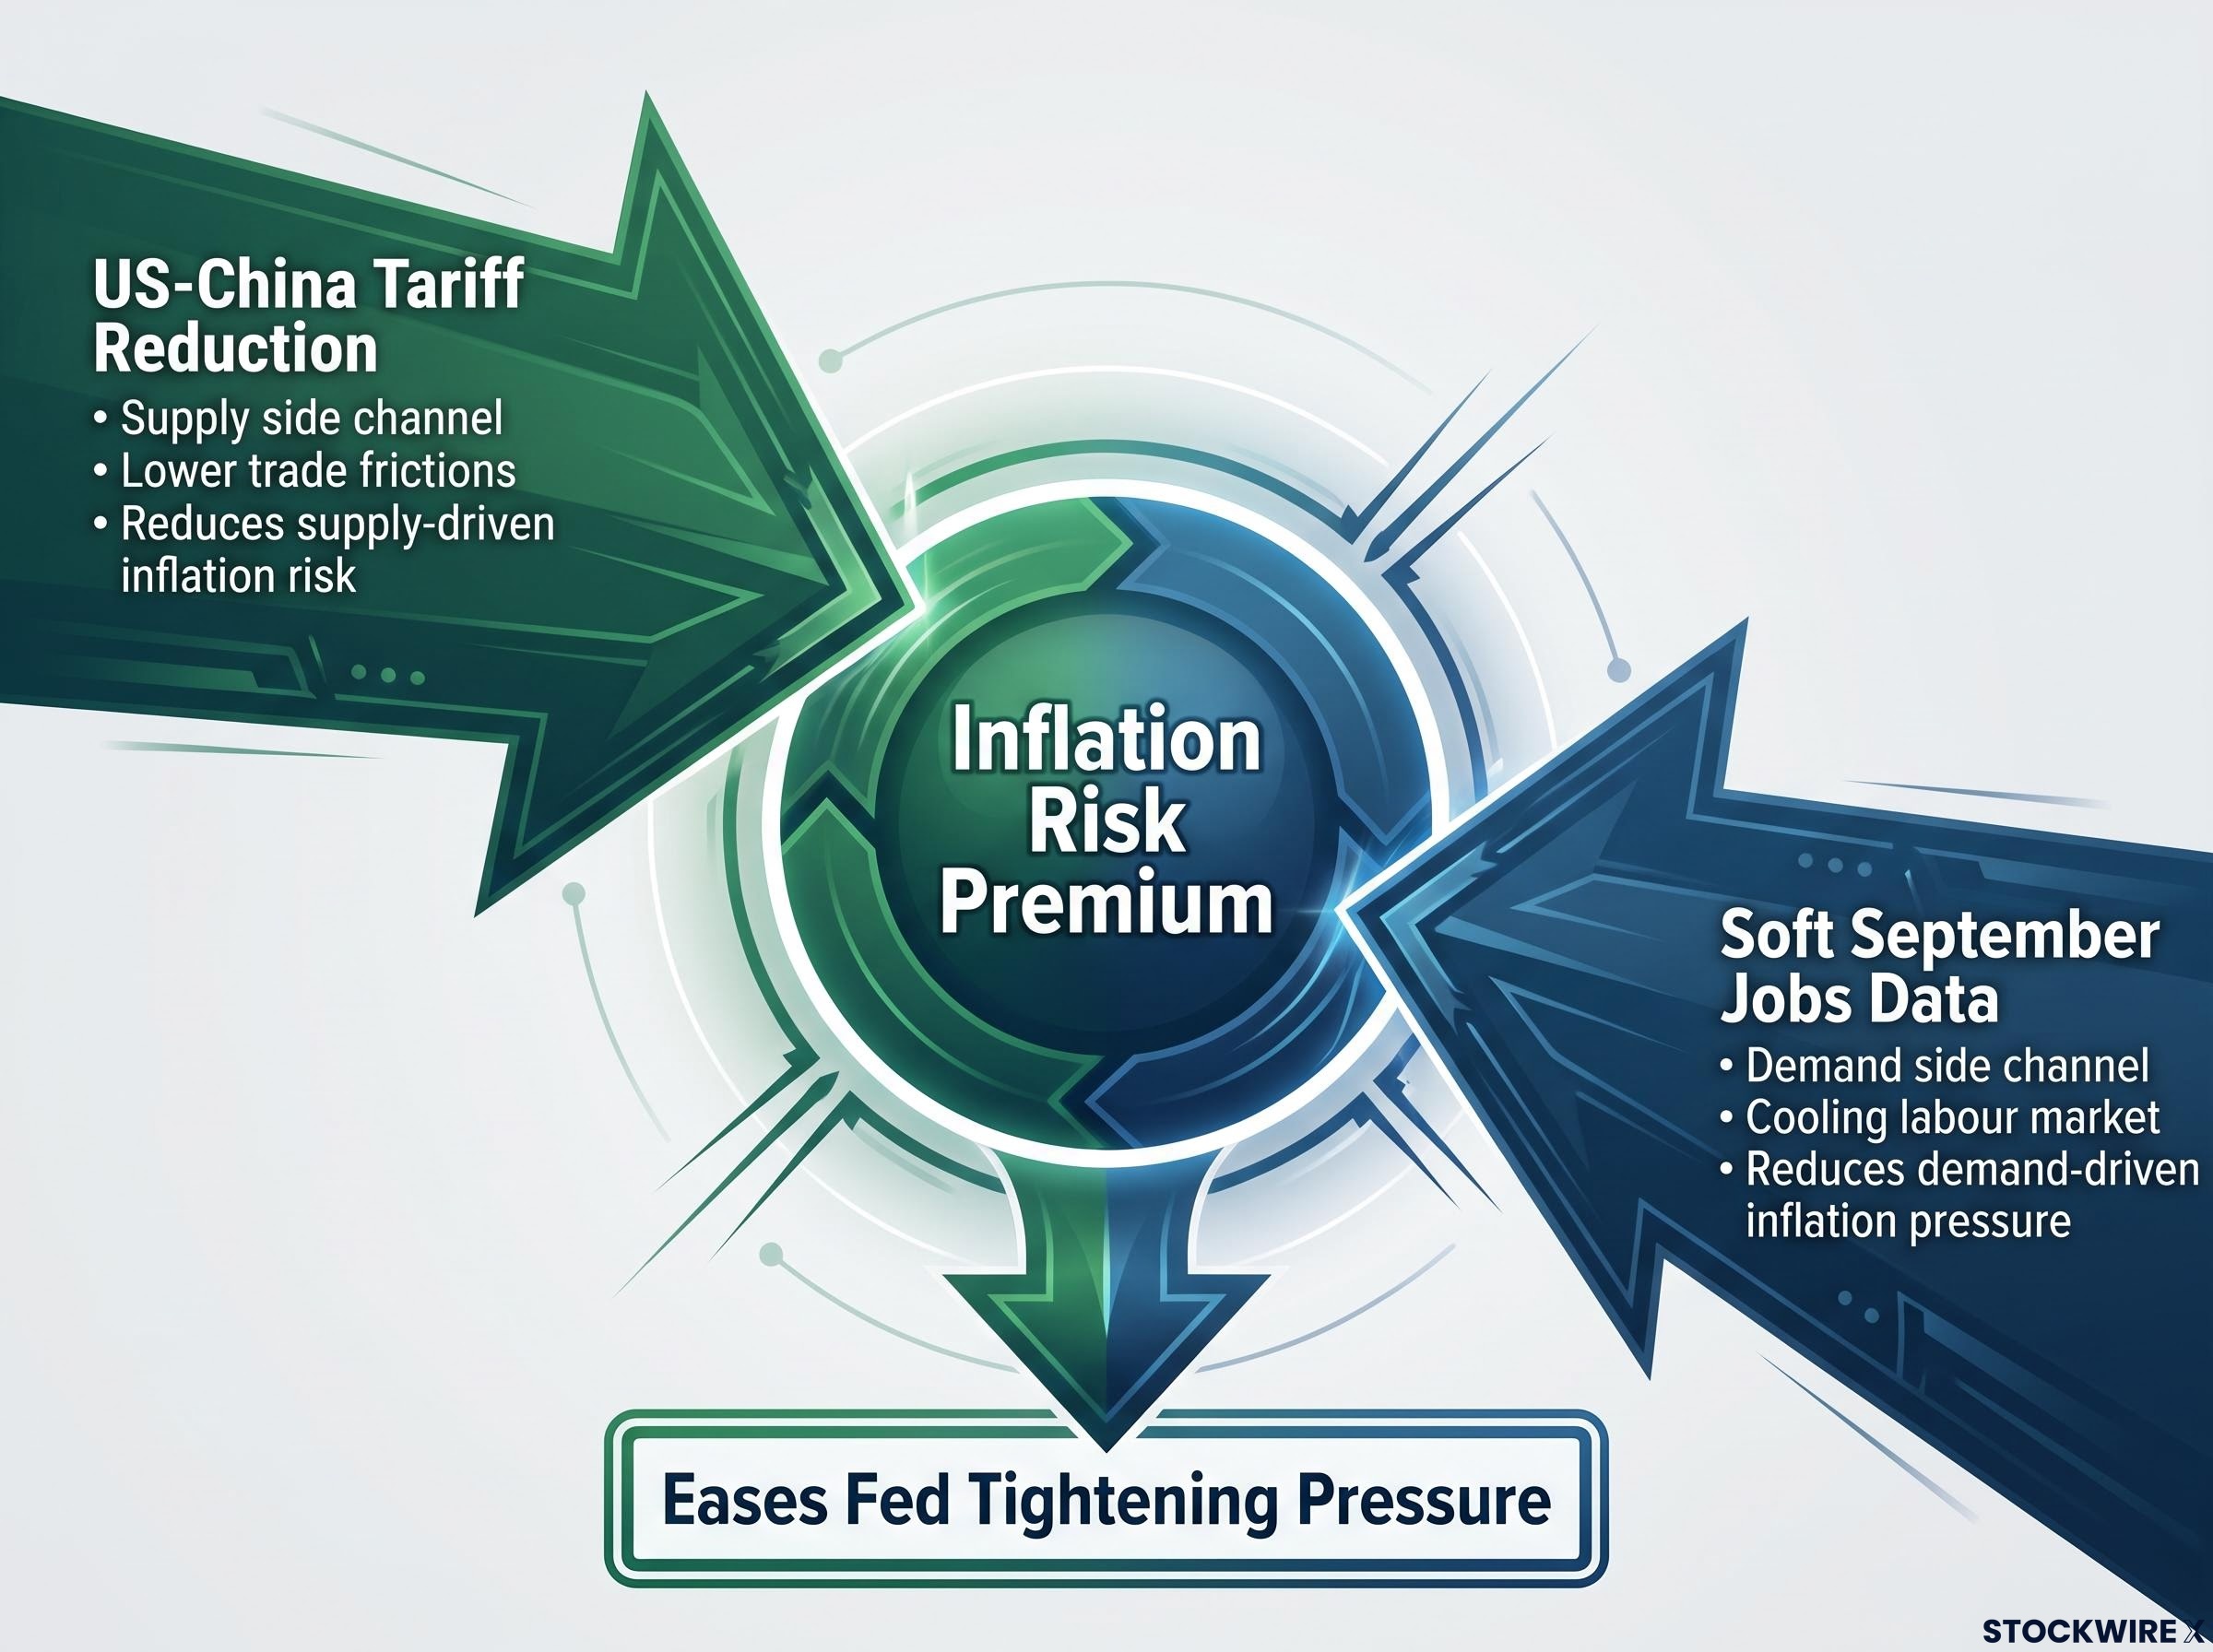
That dual compression feeds directly into expected real rates. If trade-driven inflation risk declines while the labour market cools without collapsing, it becomes rational to anticipate a more dovish Fed path and lower future short-term rates. Fisher Investments notes the softer September report and downward revisions partially alleviated investor concerns about further increases.
The scale matters here too: the tariff agreement covers roughly 30% of US goods exported to China, so the trade-side relief is not trivial. What makes this week unusual is not that good news arrived twice. It is that both pieces address the same underlying anxiety, inflation-and-rates pressure, through different but reinforcing channels. That is what makes the combined signal more durable than either alone.
| Catalyst | Channel | Effect on inflation risk | Effect on Fed expectations |
|---|---|---|---|
| US-China tariff reduction | Supply side (lower trade frictions) | Reduces supply-driven inflation risk | Eases pressure to tighten on inflation grounds |
| Soft September jobs data | Demand side (cooling labour market) | Reduces demand-driven inflation pressure | Strengthens case to hold or eventually cut |
Where the risk to this picture sits
The constructive case carries an asymmetry. Neither signal is locked in, and three durability risks deserve monitoring.
First, the tariff product lists are revisable annually, so future political shifts could add or remove items. Second, the excluded strategic sectors, semiconductors, EVs, and batteries, remain live friction points capable of reigniting tension. Third, the September jobs figure is a single data point that may be revised.
Trade truce durability is the variable the 10 January 2027 expiry date makes legible: China’s suspension of retaliatory tariffs on US soybeans, corn, and rare-earth exports is explicitly time-limited and revocable, which means the constructive supply-side signal the current agreement delivers could reverse on a single political decision.
There is a geopolitical layer too. Reuters notes the tariff cuts are intertwined with an AI dialogue initiative, meaning the trade relief is embedded in a broader diplomatic process whose trajectory could influence whether the reductions hold. These are not reasons to dismiss the signals. They are the variables you should track to judge whether the constructive backdrop survives Q4.
What investors historically get wrong when trade and labour data move together
The trap in weeks like this is the reflex that slower job growth and softer wages must mean inflation risk or an economy rolling over. Fisher Investments argues the reasoning behind that reflex is flawed, noting that wages frequently rise in response to existing inflationary conditions rather than acting as an independent cause of inflation.
Fisher Investments characterises the wage-inflation link as backwards: wages frequently rise in response to existing inflation rather than driving it, which means softer wage dynamics are not automatically a warning sign.
If you accept the wage-inflation assumption uncritically, you misread cooling job growth as a threat. It may instead be exactly the data the Fed needs to hold rates steady and eventually ease, which is the opposite conclusion for rate-sensitive positioning.
The second trap is over-extrapolation. A single jobs miss and a partial tariff deal are not a regime change. Treating them as one risks positioning too aggressively for a dovish pivot the Fed has not signalled. Recall the framing divergence itself, the BLS saw figures that “changed little” while Robert Half saw hiring that “cooled considerably.” That gap is a reminder that the data supports more than one honest interpretation.
The appropriate posture is to update probability weights on rate paths and trade scenarios, not to make binary calls on one week of data. Three caveats are worth carrying into Q4:
- September figures are a single month and subject to revision.
- Tariff product lists are revisable annually, so the deal’s scope can shift.
- No direct Fed communication has confirmed either signal’s policy implications.
Two constructive signals warrant recalibration, not capitulation to a bull or bear narrative.
What Q4 looks like from here, and which variables actually matter
Less trade uncertainty plus softer labour data is a constructive combination for risk assets and long-duration exposures in the near term. The conviction you attach to it, though, should be calibrated to the durability risks already on the table, not treated as a settled regime shift.
Three forward variables will determine whether the backdrop holds:
- The October jobs report. It will reveal whether September was an outlier or the start of a trend.
- The first formal tariff rate schedules and product lists. These will clarify the deal’s actual scope, still undisclosed as of 3 October 2026.
- The next Fed meeting and communications. These will confirm or deny the dovish inference the market is currently drawing from context rather than guidance.
That last point matters most. With no direct Fed communication linking the jobs data and the tariff deal to future policy, investors are reading signal from context, not authoritative guidance. That is precisely when disciplined framework thinking beats reactive positioning.
Fisher Investments offers a useful baseline: global growth has stayed resilient partly because businesses adapt strongly when trade conditions shift, and this agreement shows cooperation can follow extended conflict. The firm views the tariff reduction as significant because it decreases a well-known source of uncertainty rather than compounding it.
Anchor to those three variables and you can tell a genuine regime shift from a one-week signal cluster, and adjust your Q4 posture with proportionate conviction rather than overconfidence.
For investors wanting to stress-test the dovish inference the market is drawing from the September jobs data, our deep-dive into the Fed’s rate hold decision examines the divided 9-3 vote, the downward BLS payroll revisions, and the JP Morgan scenario framework that maps three distinct investor postures against the FOMC’s next move.
This article is for informational purposes only and should not be considered financial advice. Investors should conduct their own research and consult with financial professionals before making investment decisions. Past performance does not guarantee future results. Financial projections are subject to market conditions and various risk factors, and forward-looking interpretations are speculative and subject to change based on market developments.