Glanbia Surges 15% as Q1 Earnings Double Analyst Estimates
4 hrs ago

Glanbia shares surged as much as 9.3% on 29 April 2026, the largest single-day move in recent memory, after the Irish nutrition company delivered Q1 results that beat analyst consensus on virtually every line. The result arrived alongside a guidance upgrade to the upper end of the range, double-digit price increases already implemented in April, and an acknowledged risk that those increases will dampen volumes for the rest of the year. Investors now face a question more nuanced than the share price reaction suggests.
The Q1 beat was broad. Glanbia reported like-for-like revenue growth of 7.2% against a consensus estimate of 4.6%, with group volumes running at 8.2% versus an anticipated 2.5%. What follows breaks down exactly what drove the outperformance, what the revised guidance signals, why whey costs are forcing the company’s hand on pricing, and what the risk-reward trade-off looks like from here.
The magnitude of the Q1 beat was not confined to a single segment. Group volumes came in at 8.2%, more than triple the 2.5% consensus had pencilled in. Like-for-like revenue growth of 7.2% cleared the 4.6% estimate by a wide margin.
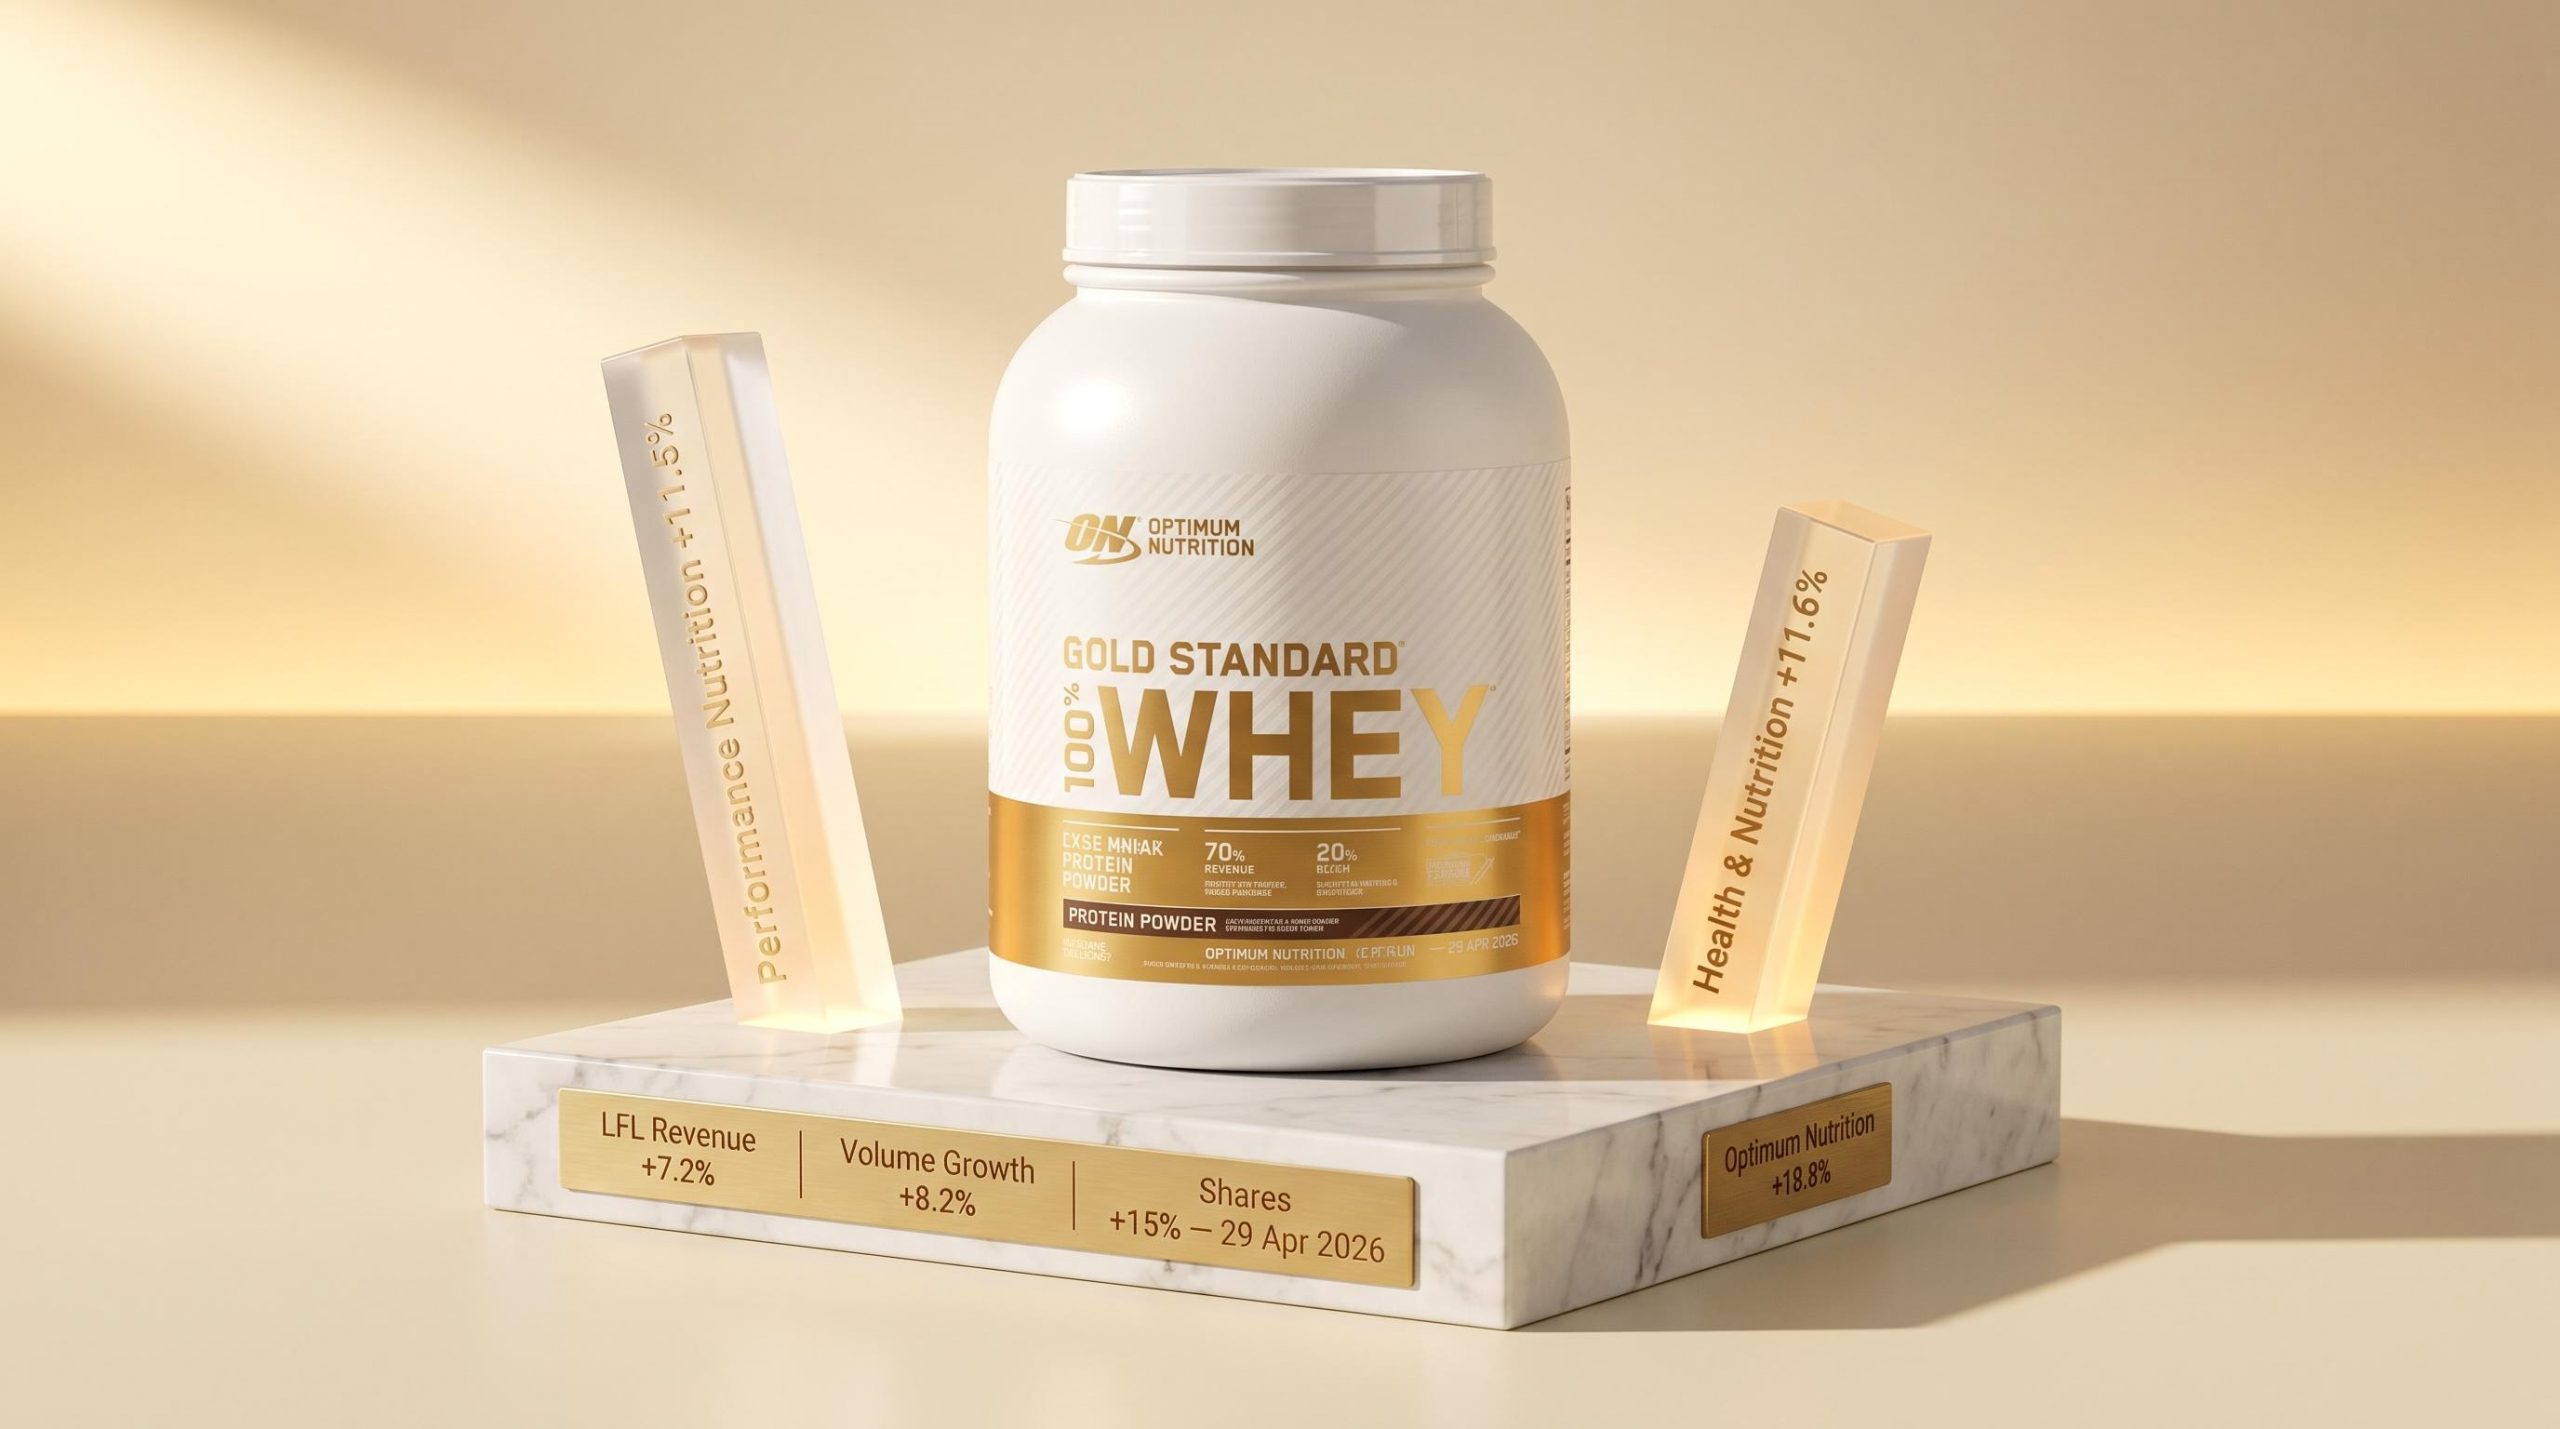
Performance Nutrition delivered 11.5% like-for-like growth against a consensus forecast of 7.2%. Health and Nutrition was even further ahead, posting 11.6% versus an expected 4.9%.
Health and Nutrition volume growth of 12.5% in Q1 2026 was the detail that most surprised the analyst community, given consensus had modelled just 4.9% like-for-like for the segment; that magnitude of outperformance is consistent with structural category growth rather than a pull-forward of demand.
| Metric | Q1 2026 Actual | Consensus Estimate |
|---|---|---|
| Group Volume Growth | 8.2% | 2.5% |
| Group LFL Revenue Growth | 7.2% | 4.6% |
| Performance Nutrition LFL | 11.5% | 7.2% |
| Health and Nutrition LFL | 11.6% | 4.9% |
When multiple segments and geographies exceed forecasts simultaneously, it points to underlying demand strength rather than a one-off tailwind. That kind of breadth is what typically supports a durable re-rating rather than a single-session spike.
Optimum Nutrition posted revenue growth of 18.8%, with Gold Standard Whey and Creatine cited as the products with the strongest commercial momentum. The brand’s acceleration accounted for a substantial share of Performance Nutrition’s overall beat.
International Performance Nutrition grew 23.4%, confirming that demand strength is geographically distributed rather than concentrated in a single market. That geographic spread matters: it reduces the risk that the Q1 result was driven by promotional timing or channel-specific inventory builds in any one region.
The pricing decisions Glanbia made in April did not come from a position of choice. They came from a commodity market that has moved structurally against every whey buyer in the industry.
Whey prices have risen nearly fourfold since 2023, driven by demand for high-protein products that has structurally outpaced whey processing investment.
The paradox is specific: overall global milk production is growing, yet the capacity to convert that milk into whey isolate and concentrate has not kept pace. The result is a bottleneck that is distinct from the broader dairy market and resistant to short-term correction.
USDA Dairy Market News weekly reporting confirming structural tightening in whey protein concentrate markets shows prices reflecting demand that continues to outpace available processing throughput rather than any transient supply shock.
Three reinforcing pressures are sustaining the imbalance:
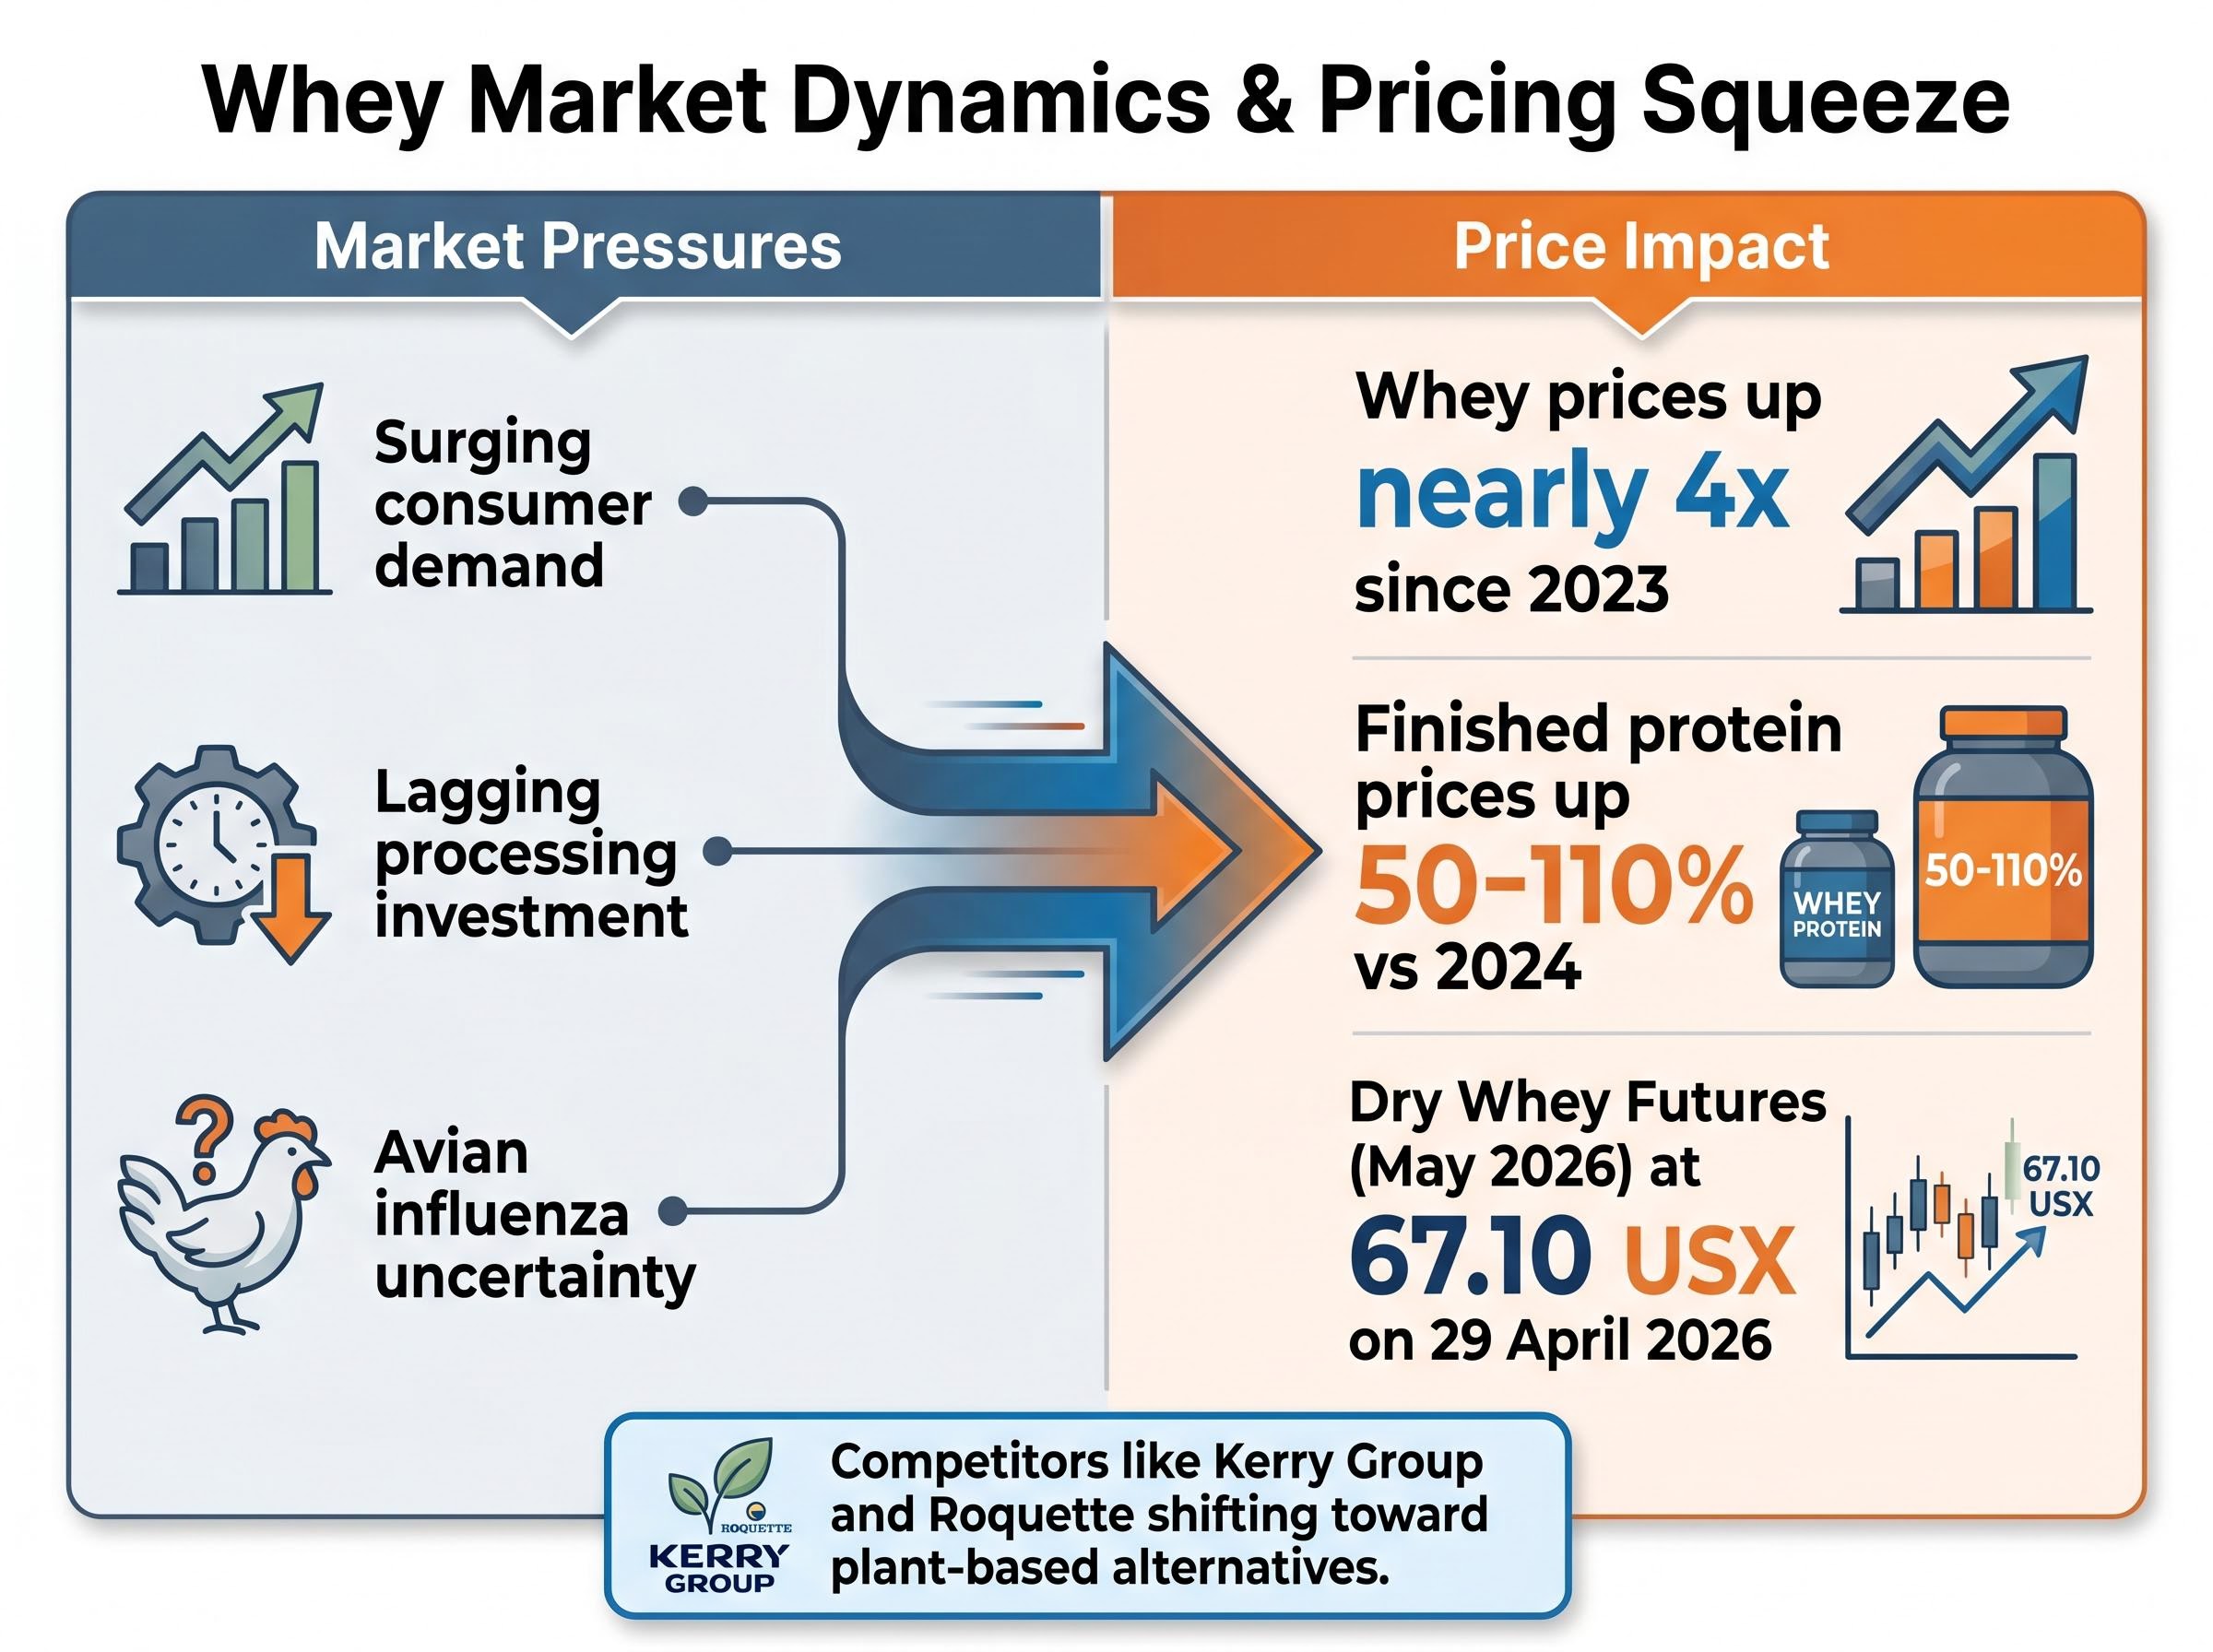
Industry-wide, finished protein product prices have risen 50-110% versus 2024 levels. Dry Whey Futures for May 2026 sat at 67.10 USX as of 29 April 2026. Kerry Group and Roquette are among competitors shifting emphasis toward plant-based protein alternatives in response to the volatility.
Glanbia’s own Dairy Nutrition segment illustrates how sharply dairy sub-markets can diverge within the same quarter: volumes grew 6.4%, but pricing fell 4.4% due to negative cheese market dynamics. The whey tailwind and the cheese headwind exist simultaneously within the same business.
WPC 34% spot prices of $1.60–$1.70 per pound sit at the intersection of Glanbia’s two largest segments: the same input cost that is compressing Performance Nutrition margins is simultaneously the tailwind lifting Dairy Nutrition EBITDA, which is why the net guidance upgrade masks opposing forces within the business.
Management moved FY2026 adjusted earnings per share (EPS) guidance to the upper end of the 7-11% growth range. The revised midpoint sits at approximately 9%, above the prior Bloomberg consensus of approximately 8%.
The upgrade has two distinct sources. First, Dairy Nutrition EBITDA guidance was raised to $160-170 million from a prior range of $150-160 million, directly reflecting elevated whey pricing flowing through to that segment’s margins. Second, Performance Nutrition organic sales growth guidance was lifted to the top of the medium-term 5-7% target range.
| Guidance Metric | Prior Range | Revised Range |
|---|---|---|
| Adjusted EPS Growth | 7-11% (midpoint ~8%) | Upper end of 7-11% (midpoint ~9%) |
| Dairy Nutrition EBITDA | $150-160 million | $160-170 million |
| Performance Nutrition Organic Sales Growth | Within 5-7% range | Top of 5-7% range |
The nuance investors should register: the guidance upgrade is partly funded by the same elevated whey prices that are simultaneously squeezing costs on the Performance Nutrition side. The net benefit depends on which effect dominates through the second half of 2026, and that answer is not yet available.
Q1 volume growth of 9.2% in Performance Nutrition was strong. But that growth was achieved against a pricing contribution of only 2.3%, carried over from Q4 2025 increases. The double-digit price increases enacted in April 2026 represent a materially larger shock than anything consumers absorbed during the first quarter.
Management acknowledged that some degree of volume elasticity is anticipated through the remainder of fiscal 2026.
Mintel’s 2026 US nutrition drinks research identifying price as a primary barrier to increased product usage — with economic pressures intensifying consumer sensitivity to shelf price changes — lends independent weight to management’s caution around volume elasticity under the new pricing regime.
The distinction matters. Q1 proved demand was resilient under modest pricing. It did not prove demand will hold under the substantially steeper increases now reaching shelves. CEO Hugh McGuire flagged geopolitical uncertainty as an additional factor the company is monitoring, adding a second layer of demand risk beyond pricing alone.
The conditions in Q1 versus the conditions ahead look different:
If competitors face the same whey cost environment and are also raising prices, category-level demand softness becomes the primary risk rather than market share loss. That is a harder problem to manage, because it cannot be solved by competitive positioning alone.
Shares closed at €19.15 on 29 April 2026 following the 9.3% gain (some sources cite 8.6%, noting the discrepancy). After-hours trading pushed the price to €19.26.
Analyst price targets ranging from EUR 19.2 to EUR 22.18 against a pre-rally close of EUR 17.52 reflect genuinely differing assumptions about how much H2 execution risk to embed, rather than disagreement about the Q1 result itself — a spread that gives investors a concrete valuation range to set against the post-rally share price.
The tension between these two cases is genuine. The guidance upgrade and Q1 breadth are real. The volume risk from pricing that has not yet flowed through to consumers is also real. Neither case is obviously wrong.
The Q1 beat and guidance upgrade are credible and consensus-beating. The structural whey cost environment benefits Dairy Nutrition EBITDA but simultaneously creates the consumer pricing shock that could limit Performance Nutrition volume growth through the second half. Both of these statements are true at the same time.
The real story of fiscal 2026 will be written in Q2 and Q3, when the full impact of April pricing flows through to consumer purchasing behaviour. Investors tracking Glanbia should monitor the Q2 update for the first volume data point under the new pricing regime, which will be the clearest signal of whether the guidance upgrade is well-founded or needs revisiting.
This article is for informational purposes only and should not be considered financial advice. Investors should conduct their own research and consult with financial professionals before making investment decisions. Past performance does not guarantee future results. Financial projections are subject to market conditions and various risk factors.
Glanbia reported Q1 2026 like-for-like revenue growth of 7.2% against a consensus estimate of 4.6%, with group volumes of 8.2% versus an anticipated 2.5%, representing a broad beat across all segments including Performance Nutrition and Health and Nutrition.
Glanbia upgraded its FY2026 adjusted EPS guidance to the upper end of its 7-11% growth range, driven by a raised Dairy Nutrition EBITDA forecast of $160-170 million (up from $150-160 million) and Performance Nutrition organic sales growth lifted to the top of the 5-7% target range.
Whey prices have risen nearly fourfold since 2023, forcing Glanbia to implement double-digit price increases in April 2026; the cost squeeze compresses Performance Nutrition margins while simultaneously benefiting Dairy Nutrition EBITDA, creating opposing forces within the same business.
Management acknowledged that double-digit price increases enacted in April 2026 are expected to dampen volumes for the remainder of fiscal 2026, with Q1 volume strength having been achieved under a much smaller pricing contribution of just 2.3% carried over from Q4 2025.
Following the 9.3% single-day gain that pushed shares to a close of approximately EUR 19.15 on 29 April 2026, analyst price targets range from EUR 19.20 to EUR 22.18, reflecting differing views on how much H2 2026 execution risk to price in.