Glanbia Surges 9% After Q1 Volumes Triple Analyst Forecasts
5 hrs ago

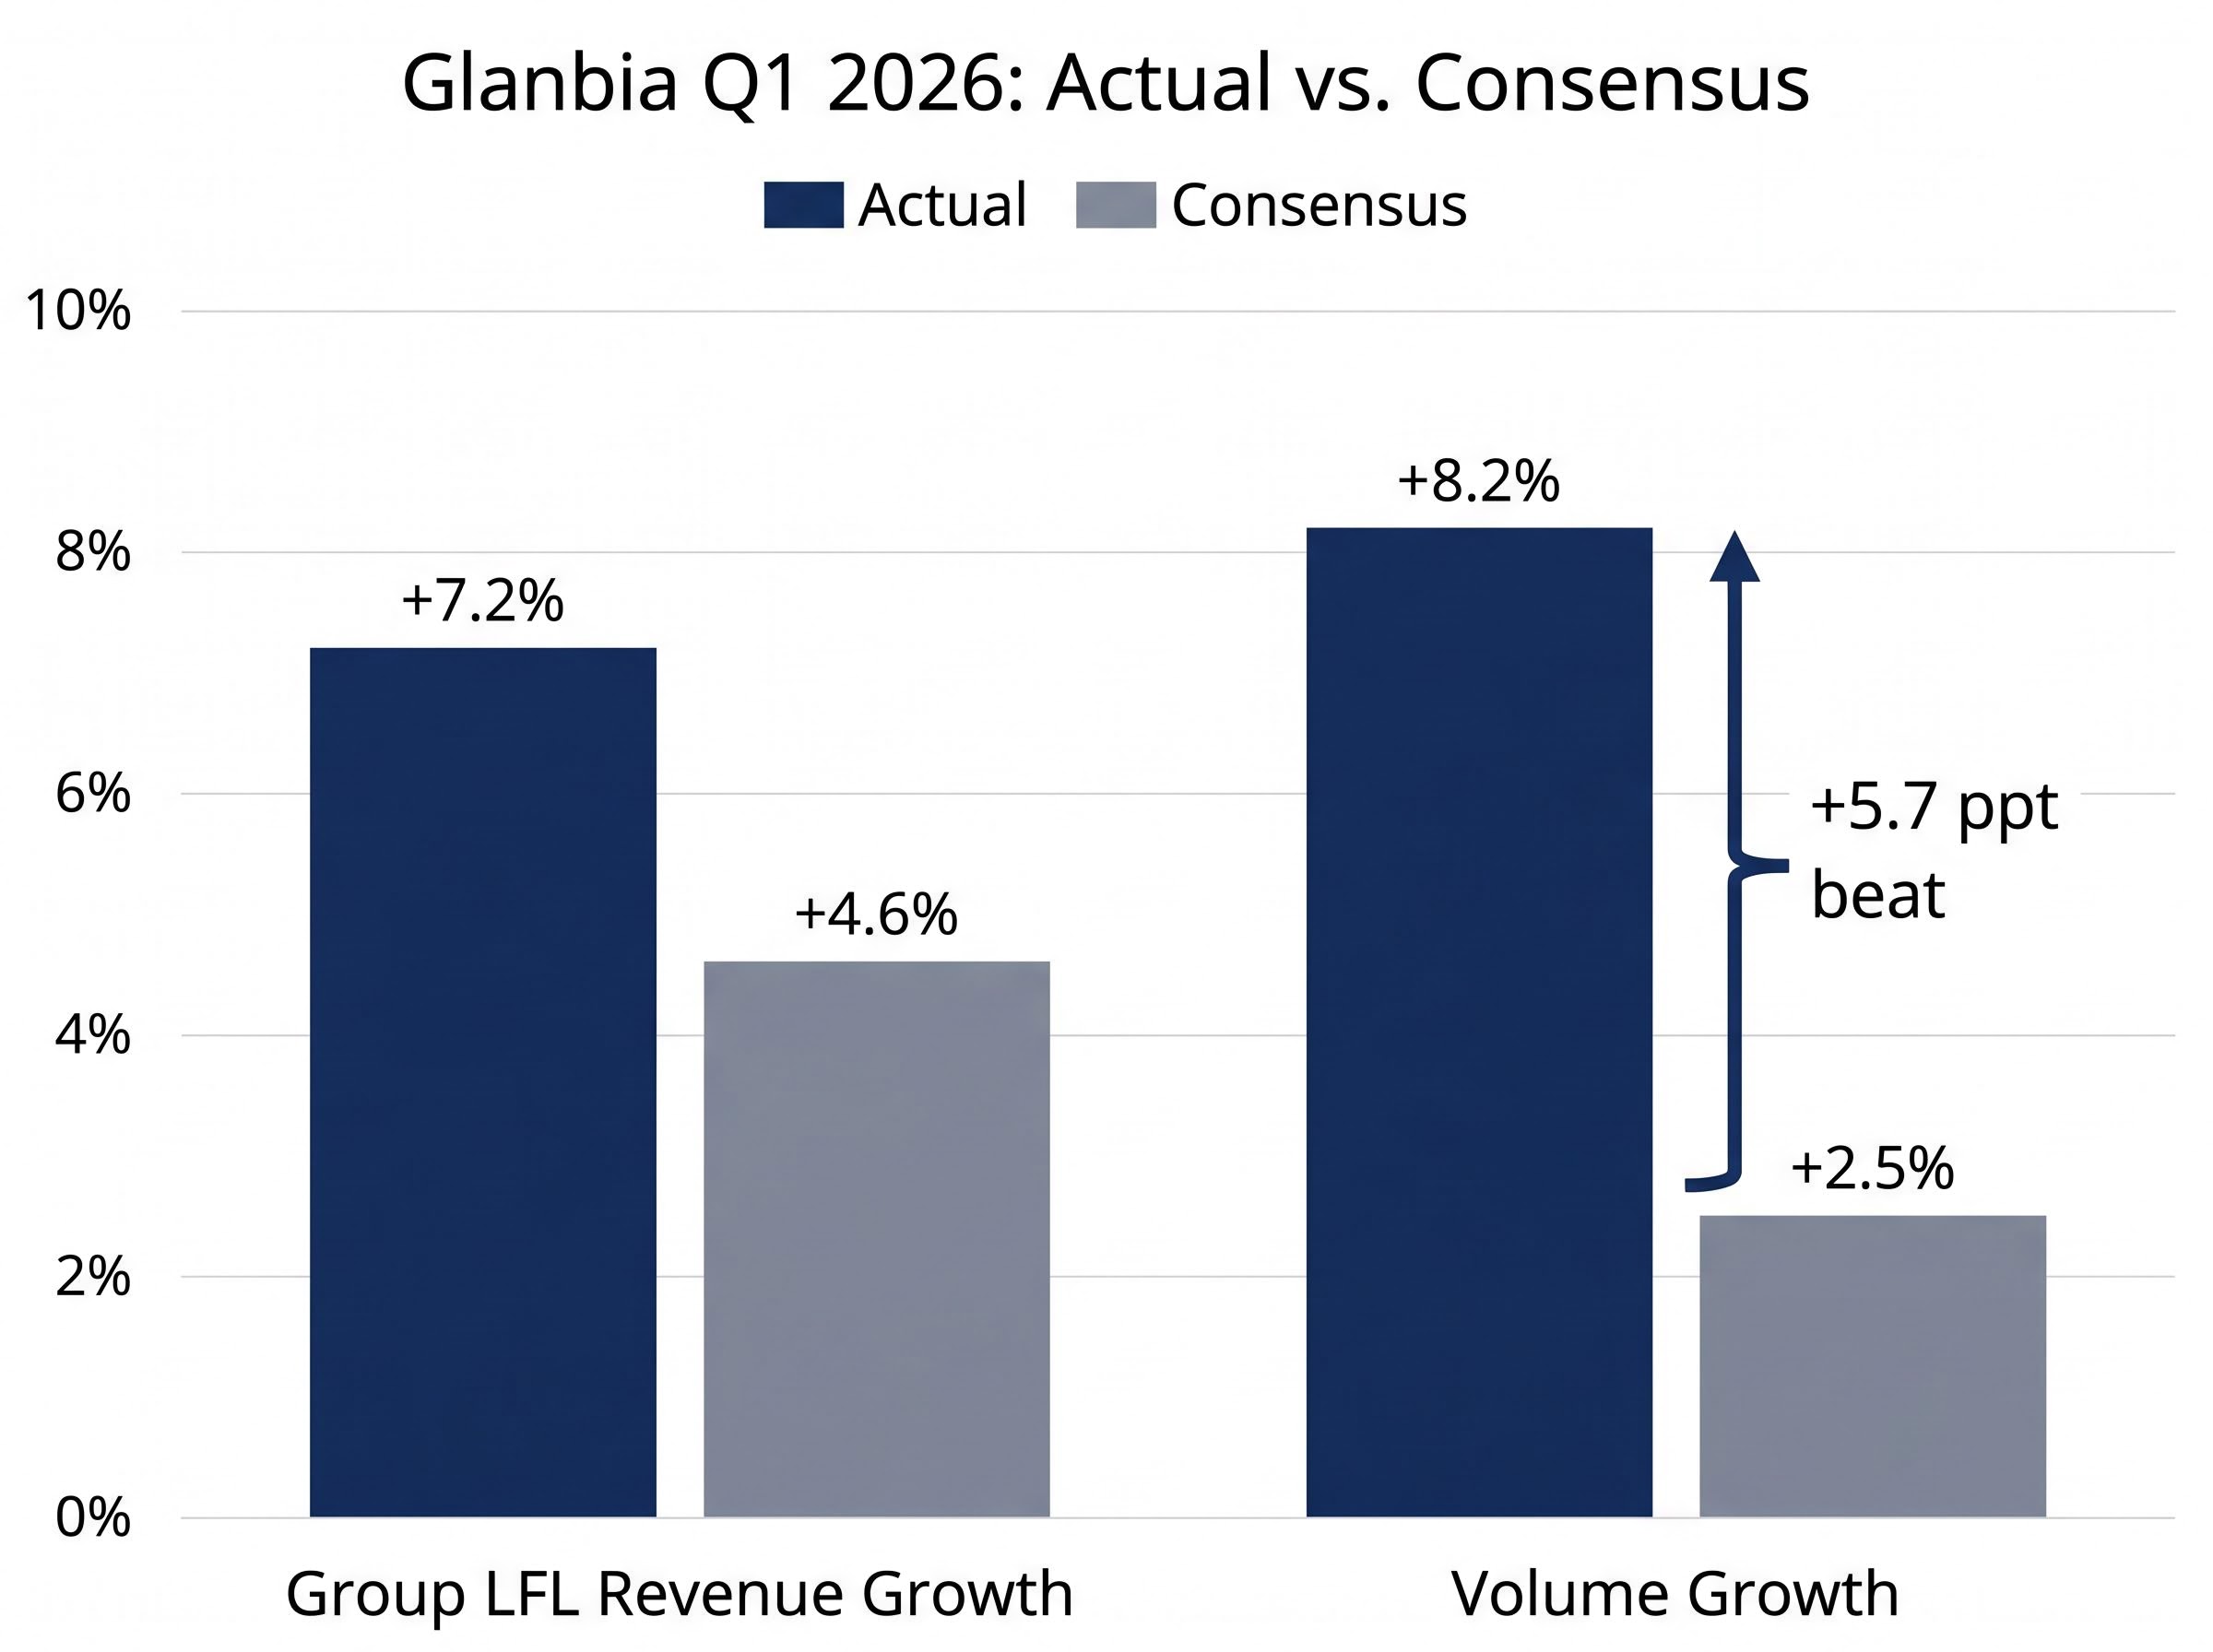
Glanbia PLC shares surged 8.6% on 29 April 2026 after the Irish nutrition company delivered a Q1 earnings report that beat analyst forecasts on every measurable dimension. The Q1 2026 Interim Management Statement, released at 7:00am GMT, revealed group like-for-like (LFL) revenue growth of 7.2% against a consensus estimate of 4.6%, with volume growth of 8.2% dwarfing the expected 2.5%. The outperformance was not isolated to a single unit: both Performance Nutrition and Health and Nutrition more than doubled their respective consensus growth forecasts.
What follows breaks down the headline numbers, explains what drove the beat at the divisional level, and examines what the upgraded guidance signals for investors tracking the company’s medium-term trajectory.
The gap between what the market expected and what Glanbia delivered is visible in a single table.
| Metric | Actual | Consensus | Beat (ppts) |
|---|---|---|---|
| Group LFL Revenue Growth | +7.2% | +4.6% | +2.6 |
| Volume Growth | +8.2% | +2.5% | +5.7 |
| Price Movement | -1.0% | N/A | N/A |
The beat was not concentrated in one lever. Volume growth of +8.2% did the heavy lifting, while pricing was marginally negative at -1.0%, producing a combined LFL figure of +7.2%. Total group revenue rose 3.8%.
Volume growth of 8.2% against a consensus of 2.5% represents a 5.7 percentage point beat, the widest Q1 volume surprise Glanbia has delivered during the current reporting cycle.
That volume/price split matters. Volume-led growth reflects genuine demand expansion rather than cost pass-through, and the scale of the miss on volume suggests that the market had substantially underestimated underlying brand demand heading into 2026.
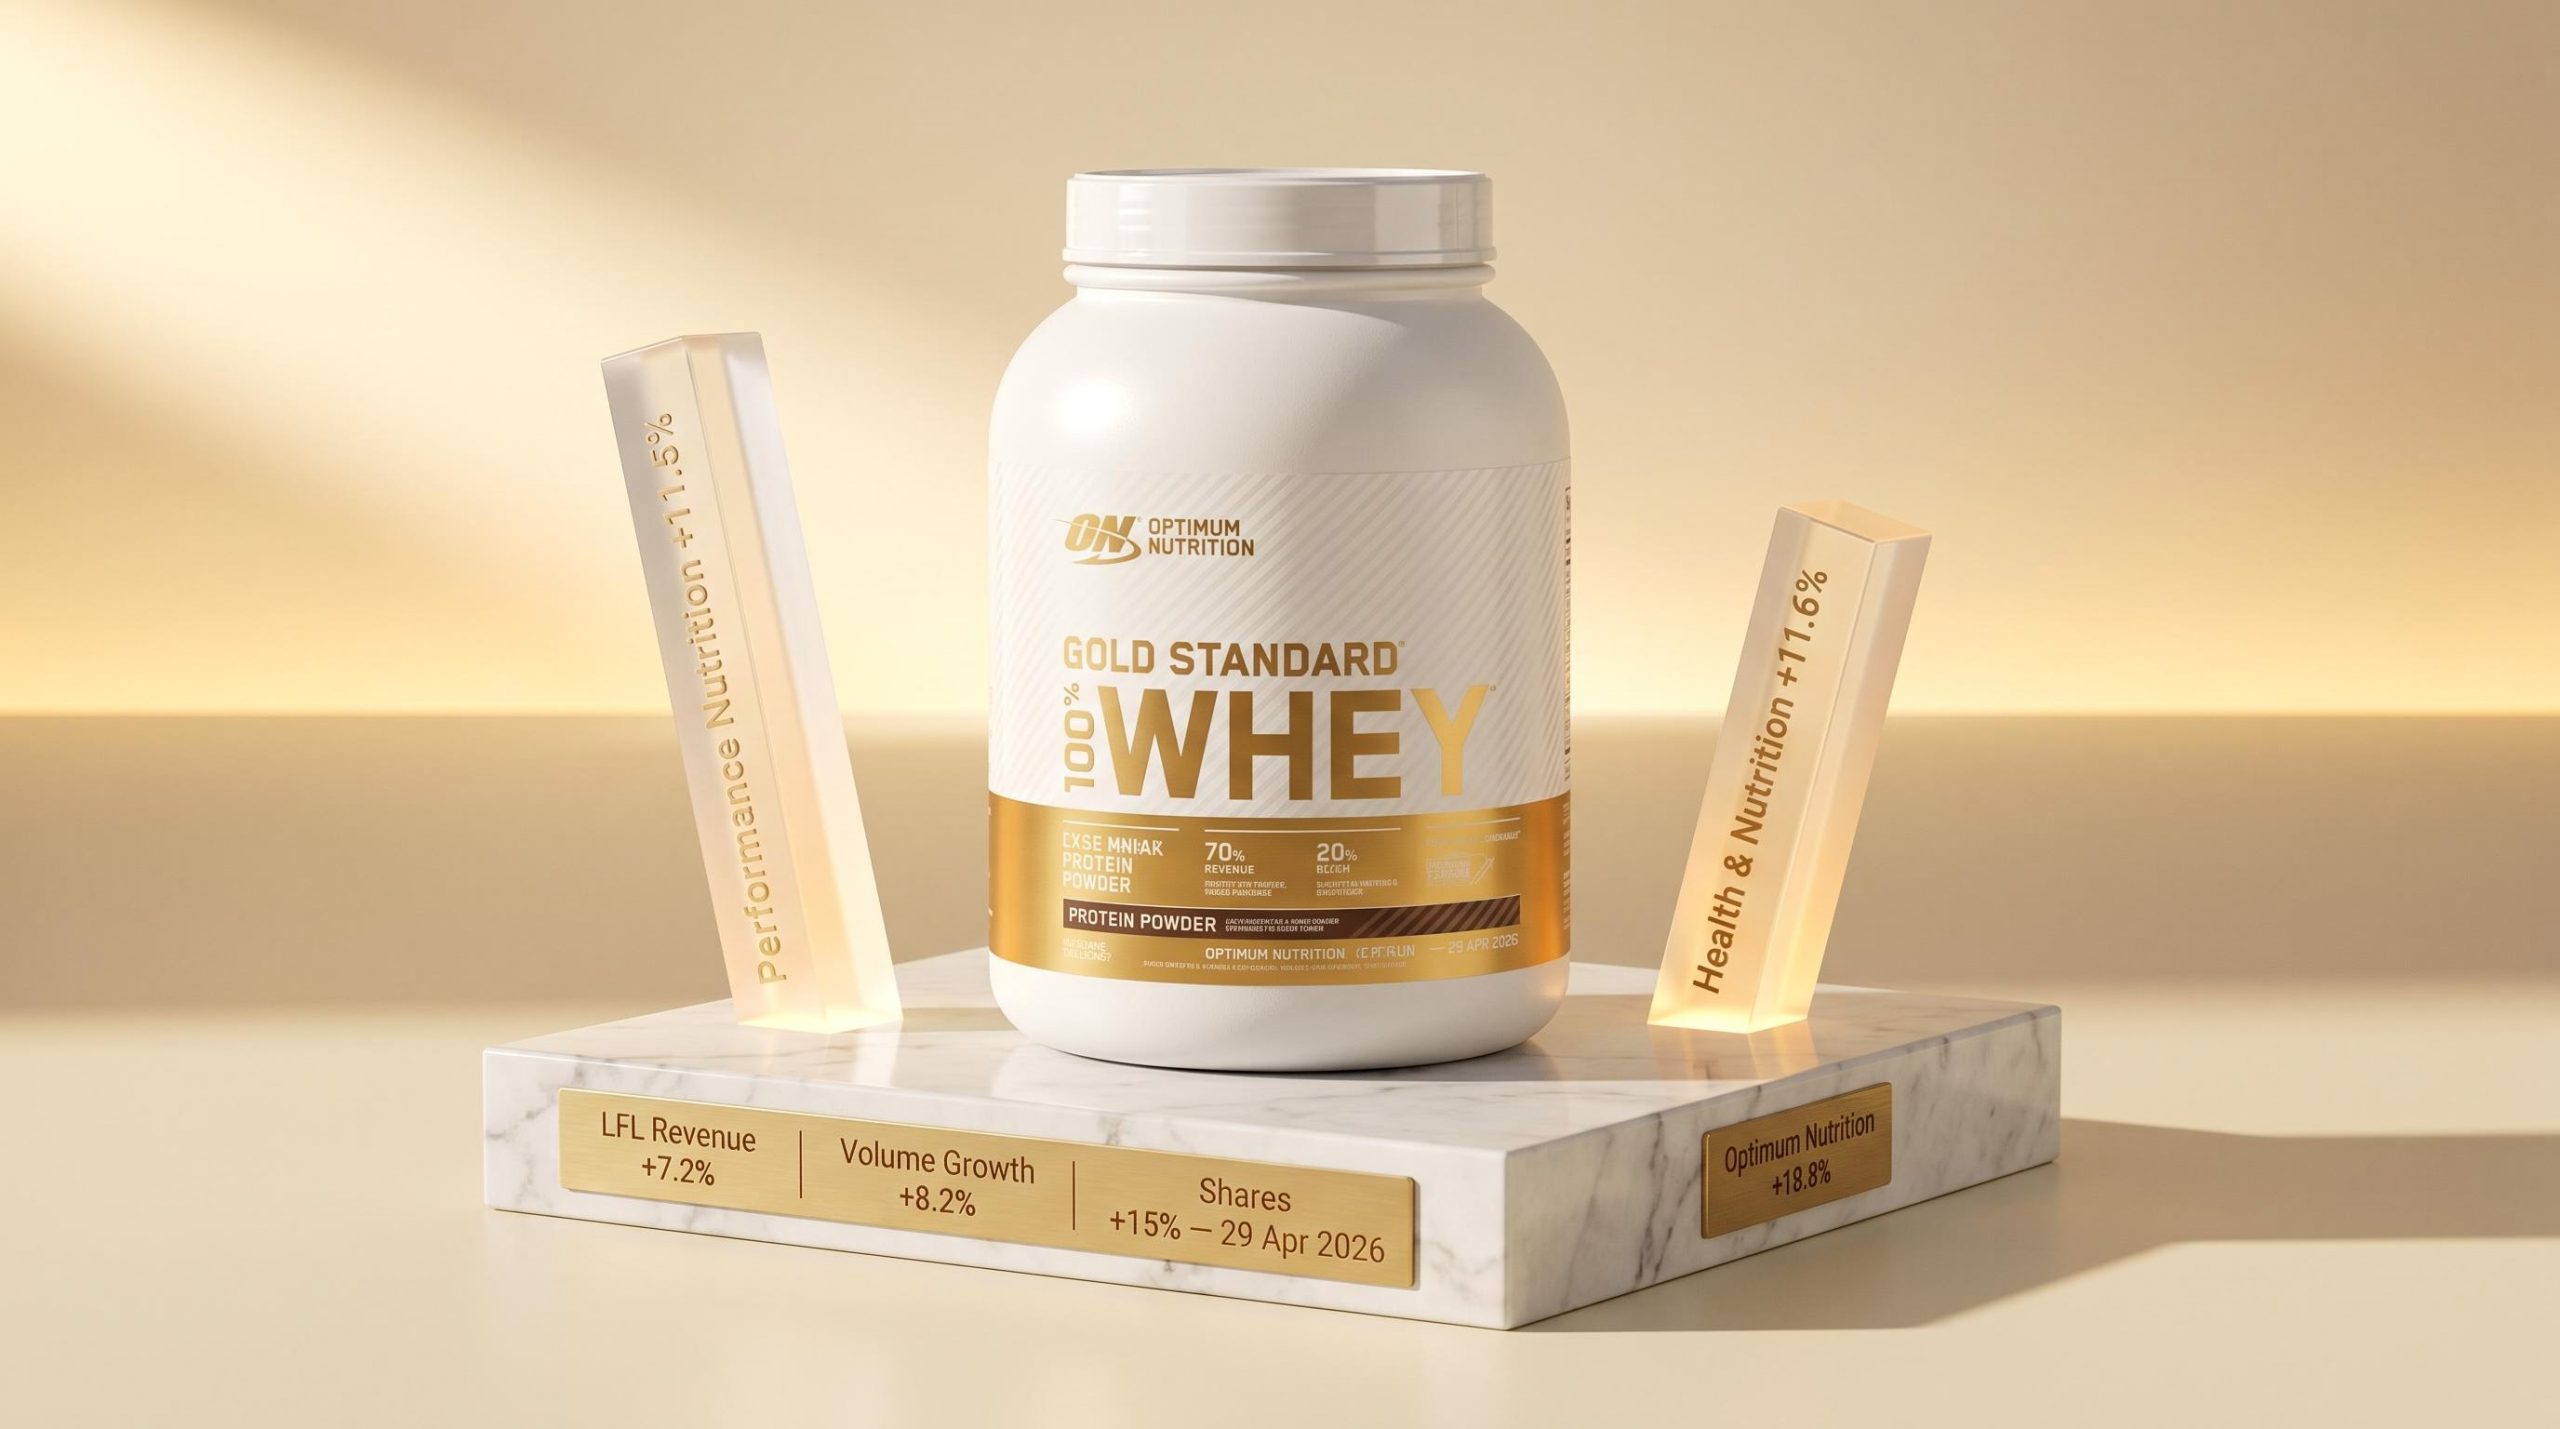
The group-level headline flowed primarily from Performance Nutrition, where LFL revenue growth reached 11.5% against a consensus estimate of 7.2%. Within that segment, the Optimum Nutrition brand was the standout, delivering 18.8% growth.
The PN volume/price breakdown reinforces the quality of the beat:
Product lines including Gold Standard Whey and the Creatine range drove domestic momentum, supported by 2025 launches (Creatine Plus, Clear Whey and Collagen) that primed the pipeline heading into this year.
The Euromonitor sports nutrition growth data for 2024-2025 recorded a 9% increase in current value terms across the category, driven by expanding gym culture and an aging consumer base prioritising protein intake, the same demand tailwinds visible in Glanbia’s volume acceleration.
Management has raised PN medium-term organic sales growth guidance to the top of the 5-7% range.
The 23.4% international PN growth figure is the metric that separates a strong quarter from a structurally significant one. Set against overall PN growth of 11.5%, international markets grew at more than double the segment rate.
Glanbia management attributed the result to sustained brand momentum and broad-based geographic expansion, though no specific regional breakdown was provided in the IMS. For investors assessing whether this beat is replicable, the international skew is the signal: growth driven by new market penetration carries a longer runway than a domestic restocking cycle.
Every figure cited so far rests on a single analytical framework: like-for-like revenue growth. For readers encountering the term for the first time, the decomposition works in three steps.
Volume-led growth reflects genuine demand expansion, not cost pass-through. It is typically regarded as a higher-quality earnings signal in consumer nutrition reporting.
The Health and Nutrition segment illustrates the same pattern: LFL of 11.6%, volume of +12.5%, price of -0.9%. Across both major segments, demand did the work.
Health and Nutrition delivered LFL growth of 11.6% against a consensus of 4.9%, more than doubling market expectations. Volume expansion of 12.5% powered the result, with pricing marginally negative at -0.9%.
The beat was not confined to the higher-growth segments. Dairy Nutrition, the lower-margin legacy unit, posted LFL growth of 2.0% with volume of +6.4% and a price decline of -4.4%. The headline from this division was the EBITDA guidance upgrade: management raised the Dairy Nutrition full-year outlook to $160-$170 million, up from prior guidance of $150-$160 million.
| Segment | LFL Growth (Actual) | Volume | Price |
|---|---|---|---|
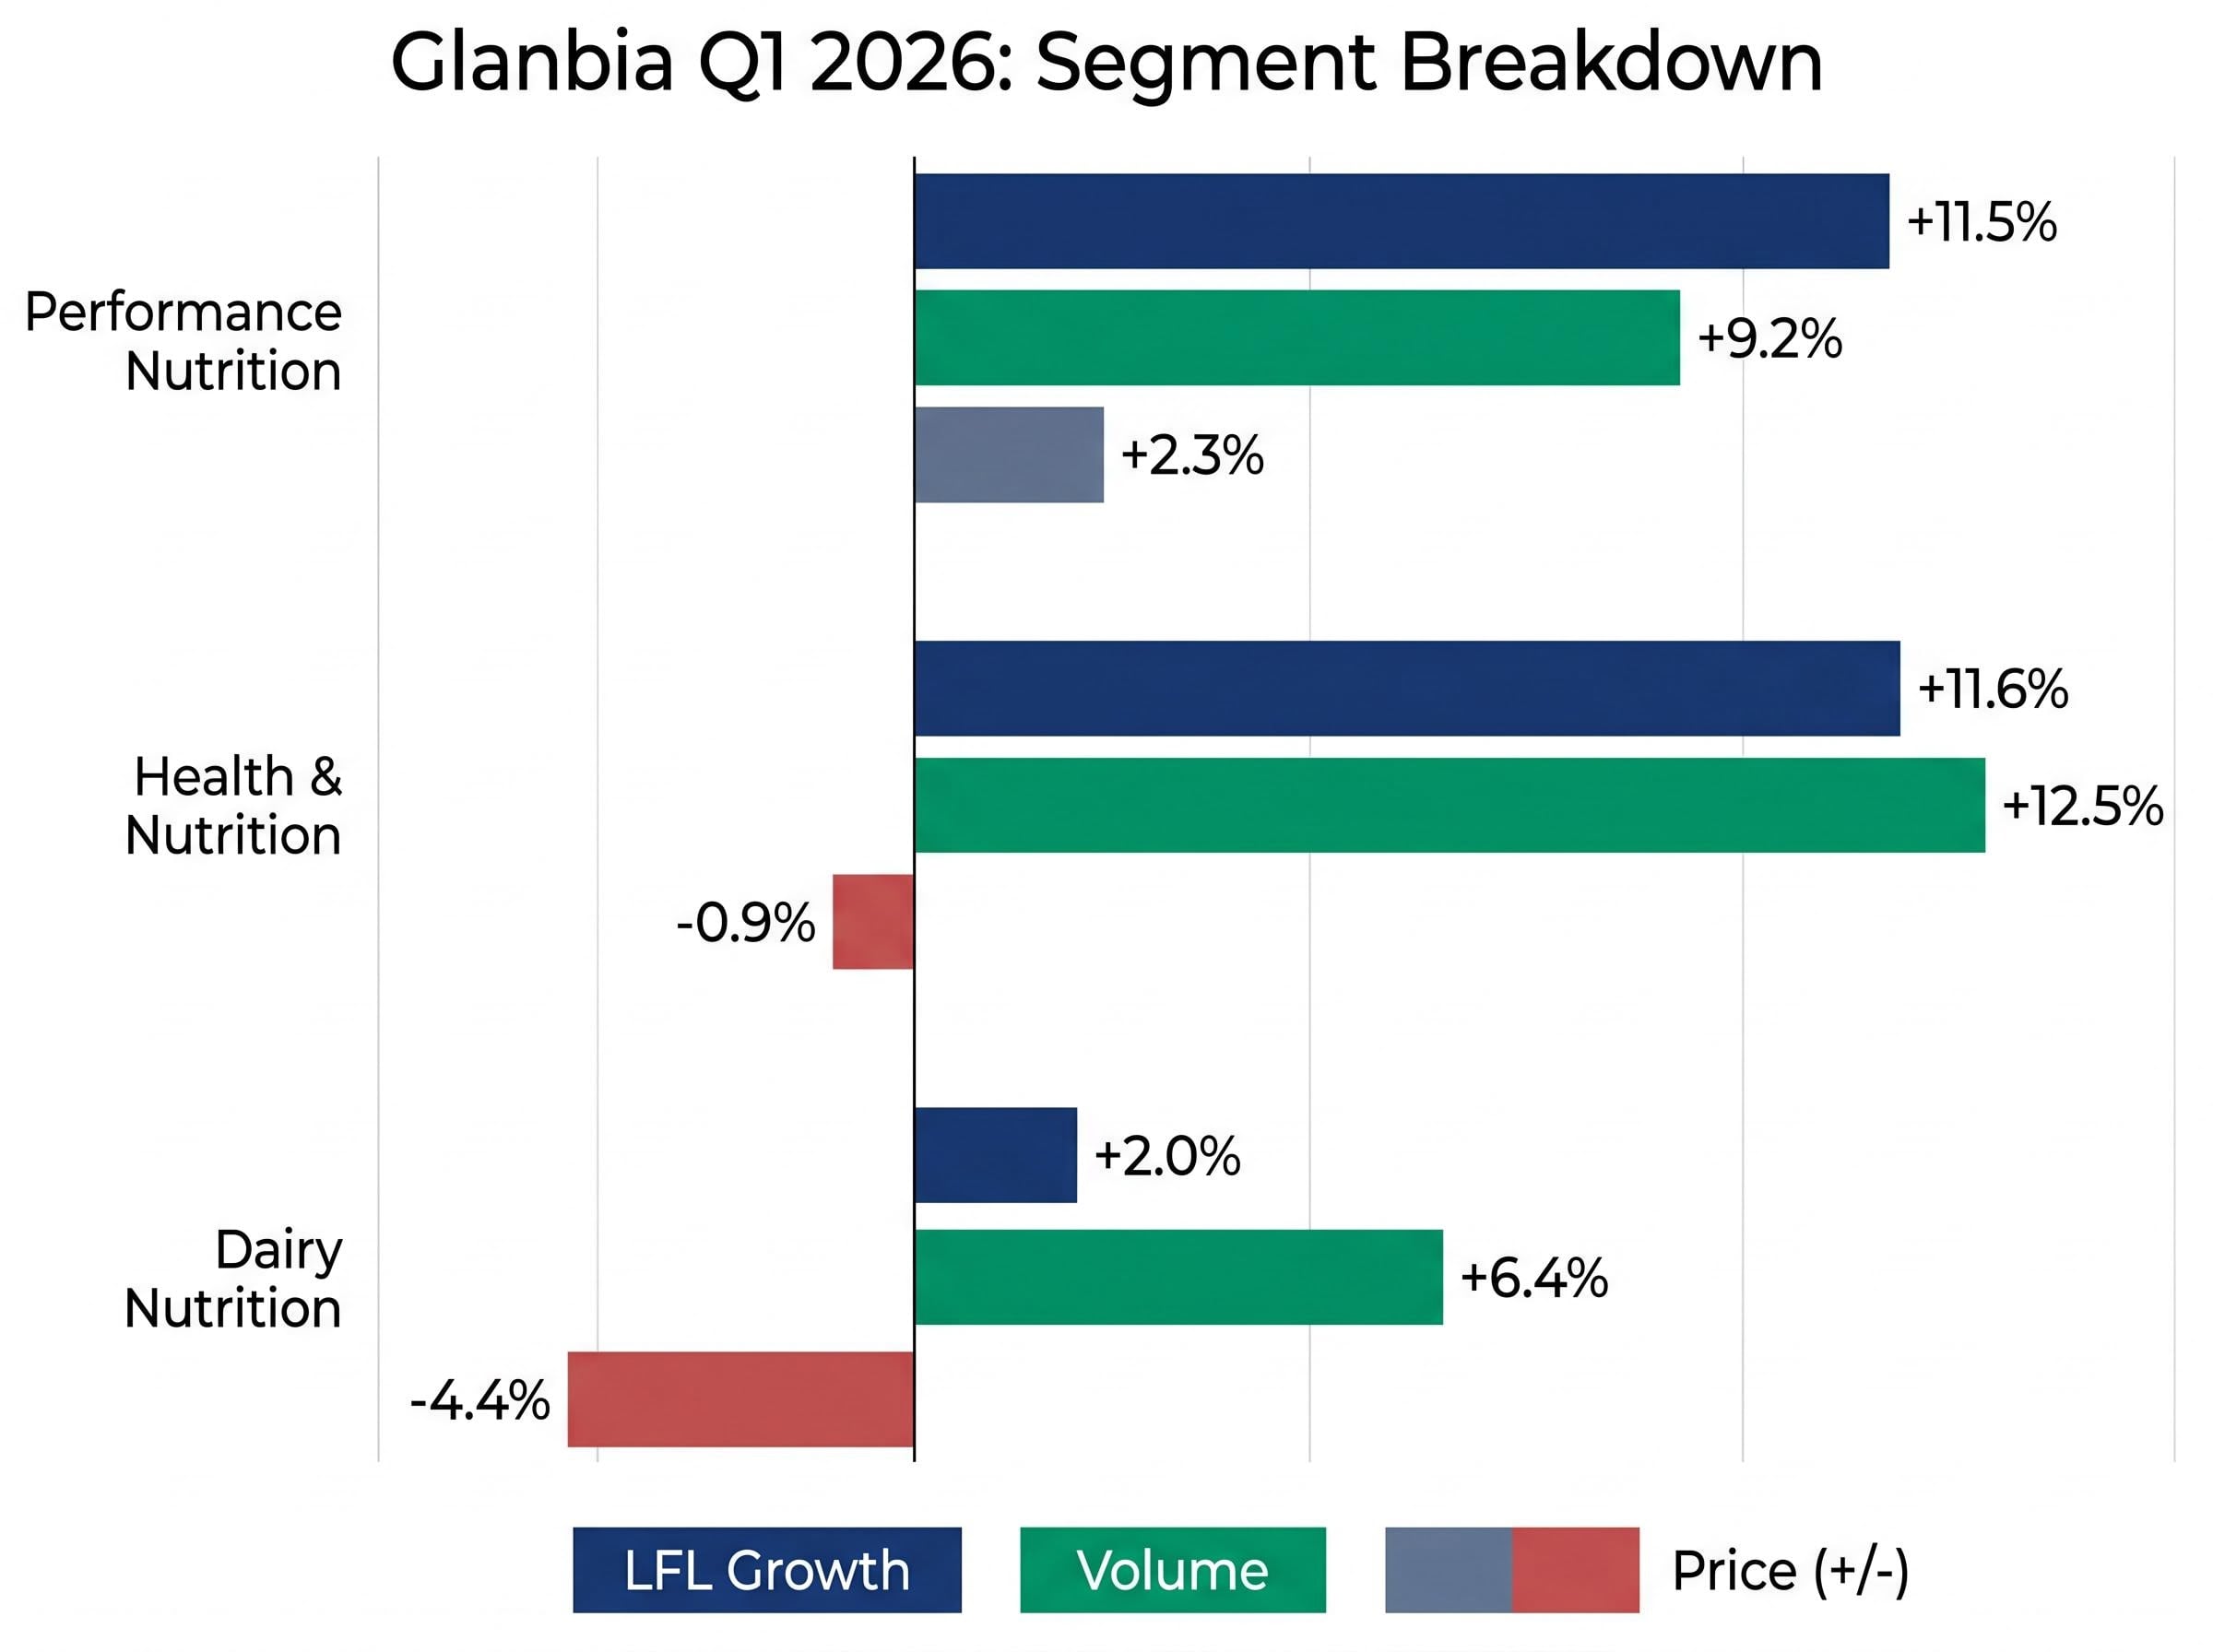
| Performance Nutrition | +11.5% | +9.2% | +2.3% |
| Health & Nutrition | +11.6% | +12.5% | -0.9% |
| Dairy Nutrition | +2.0% | +6.4% | -4.4% |
The -4.4% price decline in Dairy Nutrition reflects the input cost environment that has defined the whey market over the past three years. US Whey Protein Concentrate (WPC) prices stood at $1.60-$1.70 per pound as of 24 April 2026, while WPC80 benchmark prices have approached €20,000 per metric ton, compared to approximately €5,000 three years prior.
The DCA Market Intelligence WPC80 benchmarks recorded a price of approximately €20,250 per metric tonne as of early April 2026, confirming that the elevated input cost environment Glanbia cited is a market-wide phenomenon rather than a company-specific exposure.
Glanbia implemented double-digit price increases across the dairy portfolio in April 2026 to offset these costs. Management flagged that some volume elasticity should be expected through the remainder of fiscal 2026 as consumers respond to higher pricing. The EBITDA upgrade in this context signals that the company is managing input cost pressure more effectively than the market had anticipated.
The operational outperformance translated directly into a full-year guidance revision. Glanbia now guides adjusted EPS growth to the upper end of the 7-11% constant currency range for FY 2026, implying approximately 9% growth against a prior Bloomberg consensus of approximately 8%.
Adjusted EPS growth is now guided to the upper end of the 7-11% constant currency range for FY 2026. Prior Bloomberg consensus sat at approximately 8%.
In corporate earnings communications, “upper end of guidance” language after a single quarter is a deliberate signal. Management teams that move guidance this early are signalling confidence that Q1 strength reflects a sustained trajectory rather than a timing anomaly. The signal carries weight precisely because it arrives with three quarters of execution still ahead.
The April 2026 double-digit price increases introduce demand elasticity risk that did not feature in the Q1 reporting period itself, since those increases post-date the quarter, meaning the H1 2026 results will be the first read on whether Optimum Nutrition’s brand premium holds volume at materially higher price points.
The breadth of the upgrade reinforces the confidence:
For investors, this is the single most actionable data point from the IMS. It directly revises the earnings trajectory and explains the 8.6% share price response on the day of the announcement.
Three themes define the Q1 report. Volume-led growth across all three divisions demonstrated demand quality that the market had not priced in. The outperformance was broad-based, spanning Performance Nutrition, Health and Nutrition, and Dairy Nutrition. And management’s willingness to upgrade guidance after a single quarter signals confidence in the sustainability of the trajectory.
The outstanding risk factor remains elevated whey input costs. With WPC80 approaching €20,000 per metric ton and double-digit price increases now live across the dairy portfolio, the volume elasticity management has flagged will be the metric to watch through the second half of fiscal 2026.
Key investor takeaways from the Q1 IMS:
The next scheduled disclosure point is the H1 2026 results.
Investors weighing the investment thesis against the execution risks ahead of H1 2026 results will find our deep-dive into Glanbia’s H2 outlook and analyst price targets, which examines consensus price target ranges from 19.2 EUR to 22.18 EUR against the pre-rally price of 17.52 EUR and models the scenarios under which brand premium sustains volume through the second half.
This article is for informational purposes only and should not be considered financial advice. Investors should conduct their own research and consult with financial professionals before making investment decisions.
Like-for-like revenue growth strips out the distorting effects of acquisitions, disposals, and currency movements to show the underlying organic performance of a company's existing operations. For Glanbia's Q1 2026 results, LFL growth of 7.2% was driven predominantly by volume expansion of 8.2%, signalling genuine demand growth rather than price-led inflation.
Glanbia reported group LFL revenue growth of 7.2% against a consensus estimate of 4.6%, and volume growth of 8.2% against a consensus of just 2.5%, representing a 5.7 percentage point beat on volume alone. Both the Performance Nutrition and Health and Nutrition segments more than doubled their respective consensus growth forecasts.
Following the Q1 beat, Glanbia revised its full-year guidance to the upper end of the 7-11% adjusted EPS growth range in constant currency for FY 2026, implying approximately 9% growth against a prior Bloomberg consensus of around 8%. Dairy Nutrition EBITDA guidance was also raised to $160-$170 million from the prior $150-$160 million range.
Optimum Nutrition delivered 18.8% growth in Q1 2026, supported by strong domestic demand for products including Gold Standard Whey and the Creatine range, as well as 2025 product launches such as Creatine Plus, Clear Whey, and Collagen. International Performance Nutrition markets grew even faster at 23.4%, suggesting broad geographic demand expansion.
The primary risk flagged by Glanbia management is elevated whey input costs, with WPC80 benchmark prices approaching 20,000 euros per metric ton, prompting double-digit price increases across the dairy portfolio in April 2026. Management acknowledged that some volume elasticity should be expected through the remainder of fiscal 2026 as consumers respond to higher prices.