
The commodity prices enriching producers today are quietly financing the conditions that will undo them, and for the first time this cycle, the official data lets investors watch it happen in quarterly increments.
Three institutional reports published in September 2026 point to the same uncomfortable conclusion for commodity bulls. The IEA’s Oil Market Report, the EIA’s Short-Term Energy Outlook, and the USDA’s WASDE converge on a picture in which a global oil market running a deficit of nearly 2 mb/d today is set to flip to a surplus approaching 5 mb/d within twelve months, while U.S. soybean output hits a record harvest and corn trades well above what it costs to grow.
The same price signals driving commodity-linked equities and exchange-traded funds higher are now triggering the supply responses that historically precede a sharp reversal.
Here is the framework for reading that supply-side evidence across oil and agriculture, and for deciding whether current commodity exposure reflects the market that exists today or the one the data suggests is coming.
The oil market’s quiet countdown: from a 1.97 mb/d deficit to a 4.90 mb/d surplus
Start where most investors are pricing from: genuine tightness. The EIA’s September 2026 outlook shows global oil consumption exceeding production by 1.97 mb/d across 2026, WTI crude trading near $90-100 per barrel, and a tracked heating oil and diesel index up an extraordinary 160% year-on-year. On the spot screen, this looks like a seller’s market.
The forward balance tells a different story. Read the EIA’s quarterly progression and watch the deficit shrink, then invert entirely.
| Quarter | Balance (mb/d) | Direction |
|---|---|---|
| Q3 2026 | 2.96 | Deficit |
| Q4 2026 | 1.71 | Deficit |
| Q1 2027 | 3.01 | Surplus |
| Q2 2027 | 5.05 | Surplus |
| Q3 2027 | 5.23 | Surplus |
| Q4 2027 | 6.25 | Surplus |
Within four quarters the market moves from a near-3 mb/d shortfall to a surplus above 6 mb/d. Annualised, the swing is stark.
The voluntary cut unwinding completed in August 2026, when seven OPEC+ members approved a final 188,000 BPD increase that closed the full 1.65 million BPD cut cycle begun in April 2023, is precisely the supply return the EIA’s surplus projections assume will materialise through 2027.
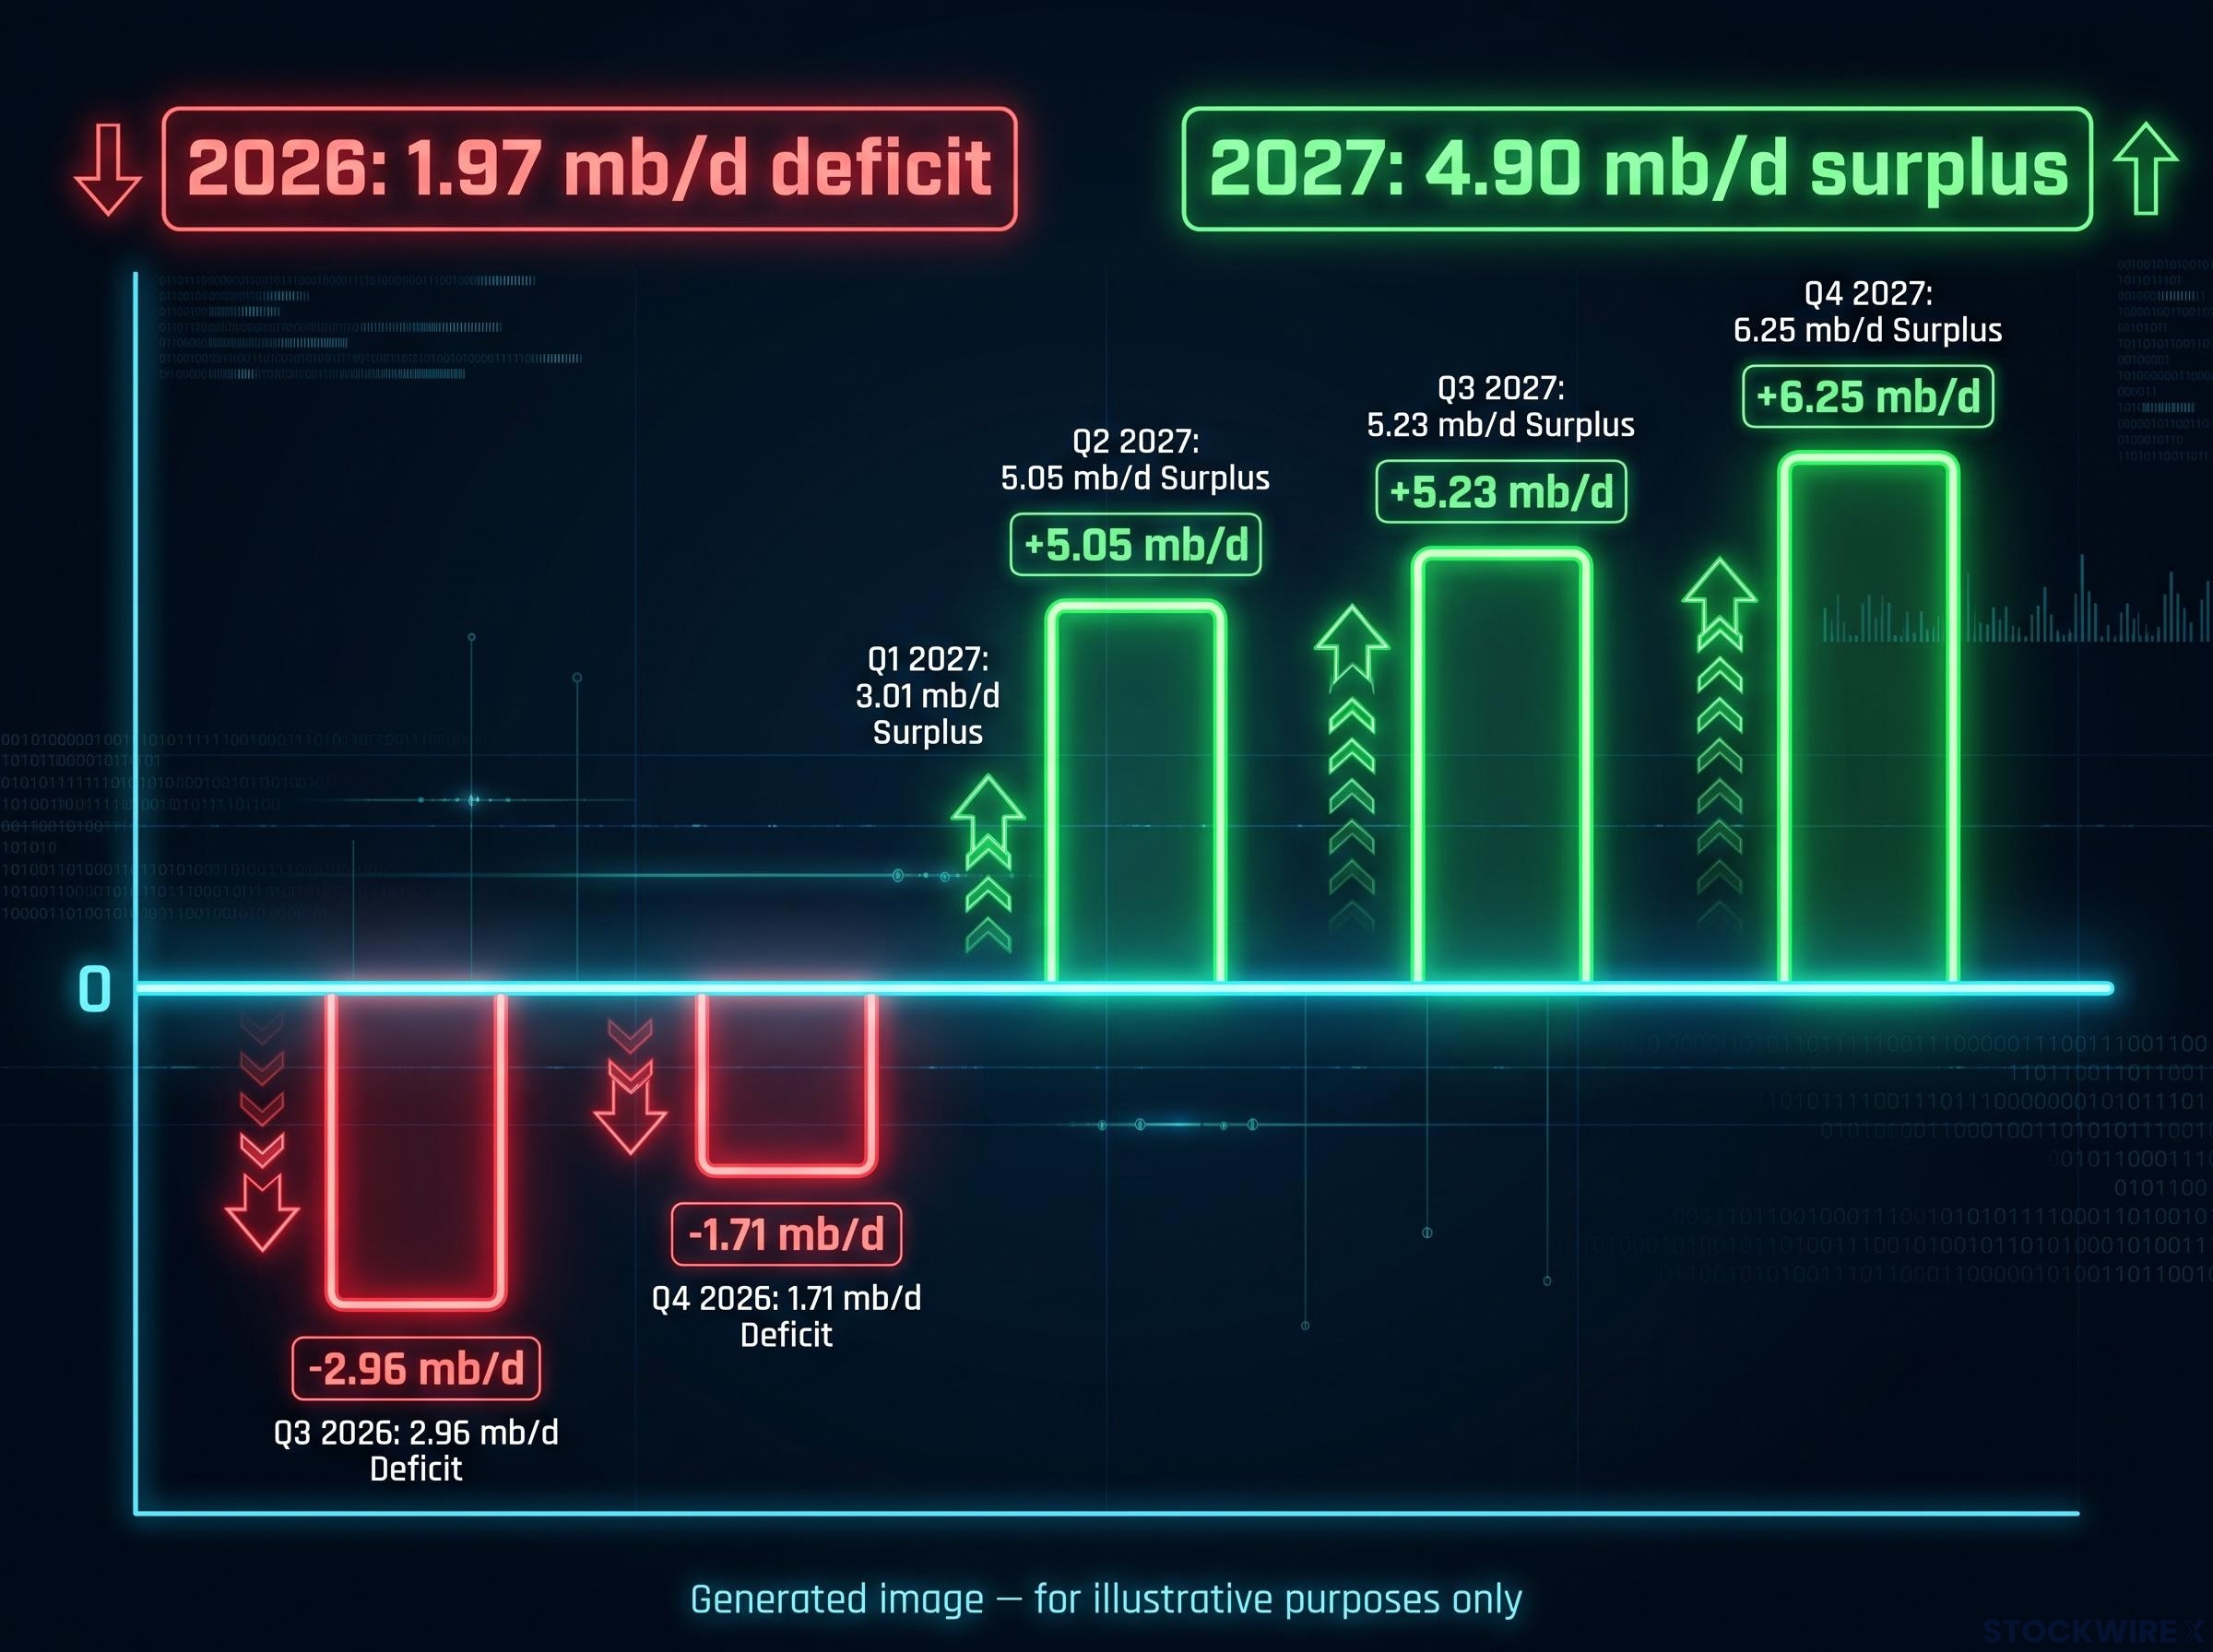
The EIA’s baseline forecasts a global surplus of 4.90 mb/d in 2027, arriving directly after a 1.97 mb/d deficit in 2026.
The IEA’s September report frames the same reversal from the demand side. World oil demand is projected to decline by 2.5 mb/d in 2026, a downward revision of 940,000 b/d from the prior month, with world supply averaging 100.7 mb/d as more than 10 mb/d of Gulf production sits shut in on security concerns. A demand recovery of 2.6 mb/d is expected in 2027, but it arrives just as that latent Gulf capacity returns to market.
This is the read investors should take from the quarterly table. Today’s $90-plus oil is priced for a world in which Gulf disruptions persist indefinitely. If they ease even partially, the surplus does not just appear, it appears faster and larger than most energy equity valuations currently assume, with North American combined liquid fuel supply now approaching 90 mb/d against an 11 mb/d deficit at the 2008 price peak.
When big ASX news breaks, our subscribers know first
Why high prices are building their own replacement
Here is the structural irony. Sustained high fossil fuel prices cure themselves, not by destroying supply, but by funding the very technologies that erode long-run demand. Every cycle of expensive oil accelerates the transition that makes the next recovery shallower.
Three forces are compressing the demand ceiling:
- Electric vehicle adoption, now running at roughly 62% of global EV sales concentrated in China, with Asian manufacturing driving costs steadily lower.
- Efficiency gains, already baked into the IEA and EIA medium-term demand outlooks and partly responsible for the 940,000 b/d demand revision in September.
- North American supply dominance, with combined output approaching 90 mb/d, a structural shift that turns the region from price-taker into price-setter.
This is not a theoretical drag. Both the IEA and EIA have already incorporated EV penetration and efficiency into their forecasts, which is precisely why their demand figures keep moving lower rather than higher.
The North American supply story reinforces the ceiling from the other direction. U.S. shale operates on a short production cycle, meaning barrels respond to price within months rather than years. Any recovery that pushes crude higher invites shale supply back quickly, capping the rally before it becomes durable.
North American supply dominance is only half of the structural ceiling story; China’s demand lever is the other half, with imports deliberately compressed from roughly 11.6 million barrels per day in 2025 to 8.45 million barrels per day in July 2026 as NEV penetration hit 65.1% of new car sales, a coordinated demand buffer that absorbed pressure OPEC alone could not have managed.
The divergence within the energy complex makes the point visible today. Crude is up roughly 60% year-to-date while U.S. natural gas is down about 20%, a split that shows structural factors biting unevenly across fuels.
What this tells you about positioning is direct. If EV adoption and efficiency represent a one-way ratchet on demand rather than a reversible headwind, then even a well-managed OPEC+ supply shock is likely to produce a shorter, shallower price recovery than the last one. That has consequences for how long any long position in oil equities can reasonably be expected to work.
Corn at 523 cents, soybeans above $13: prices this far above cost are an invitation, not a harbour
The agricultural market is running the same script on a different clock, and the September WASDE shows the supply response is already underway.
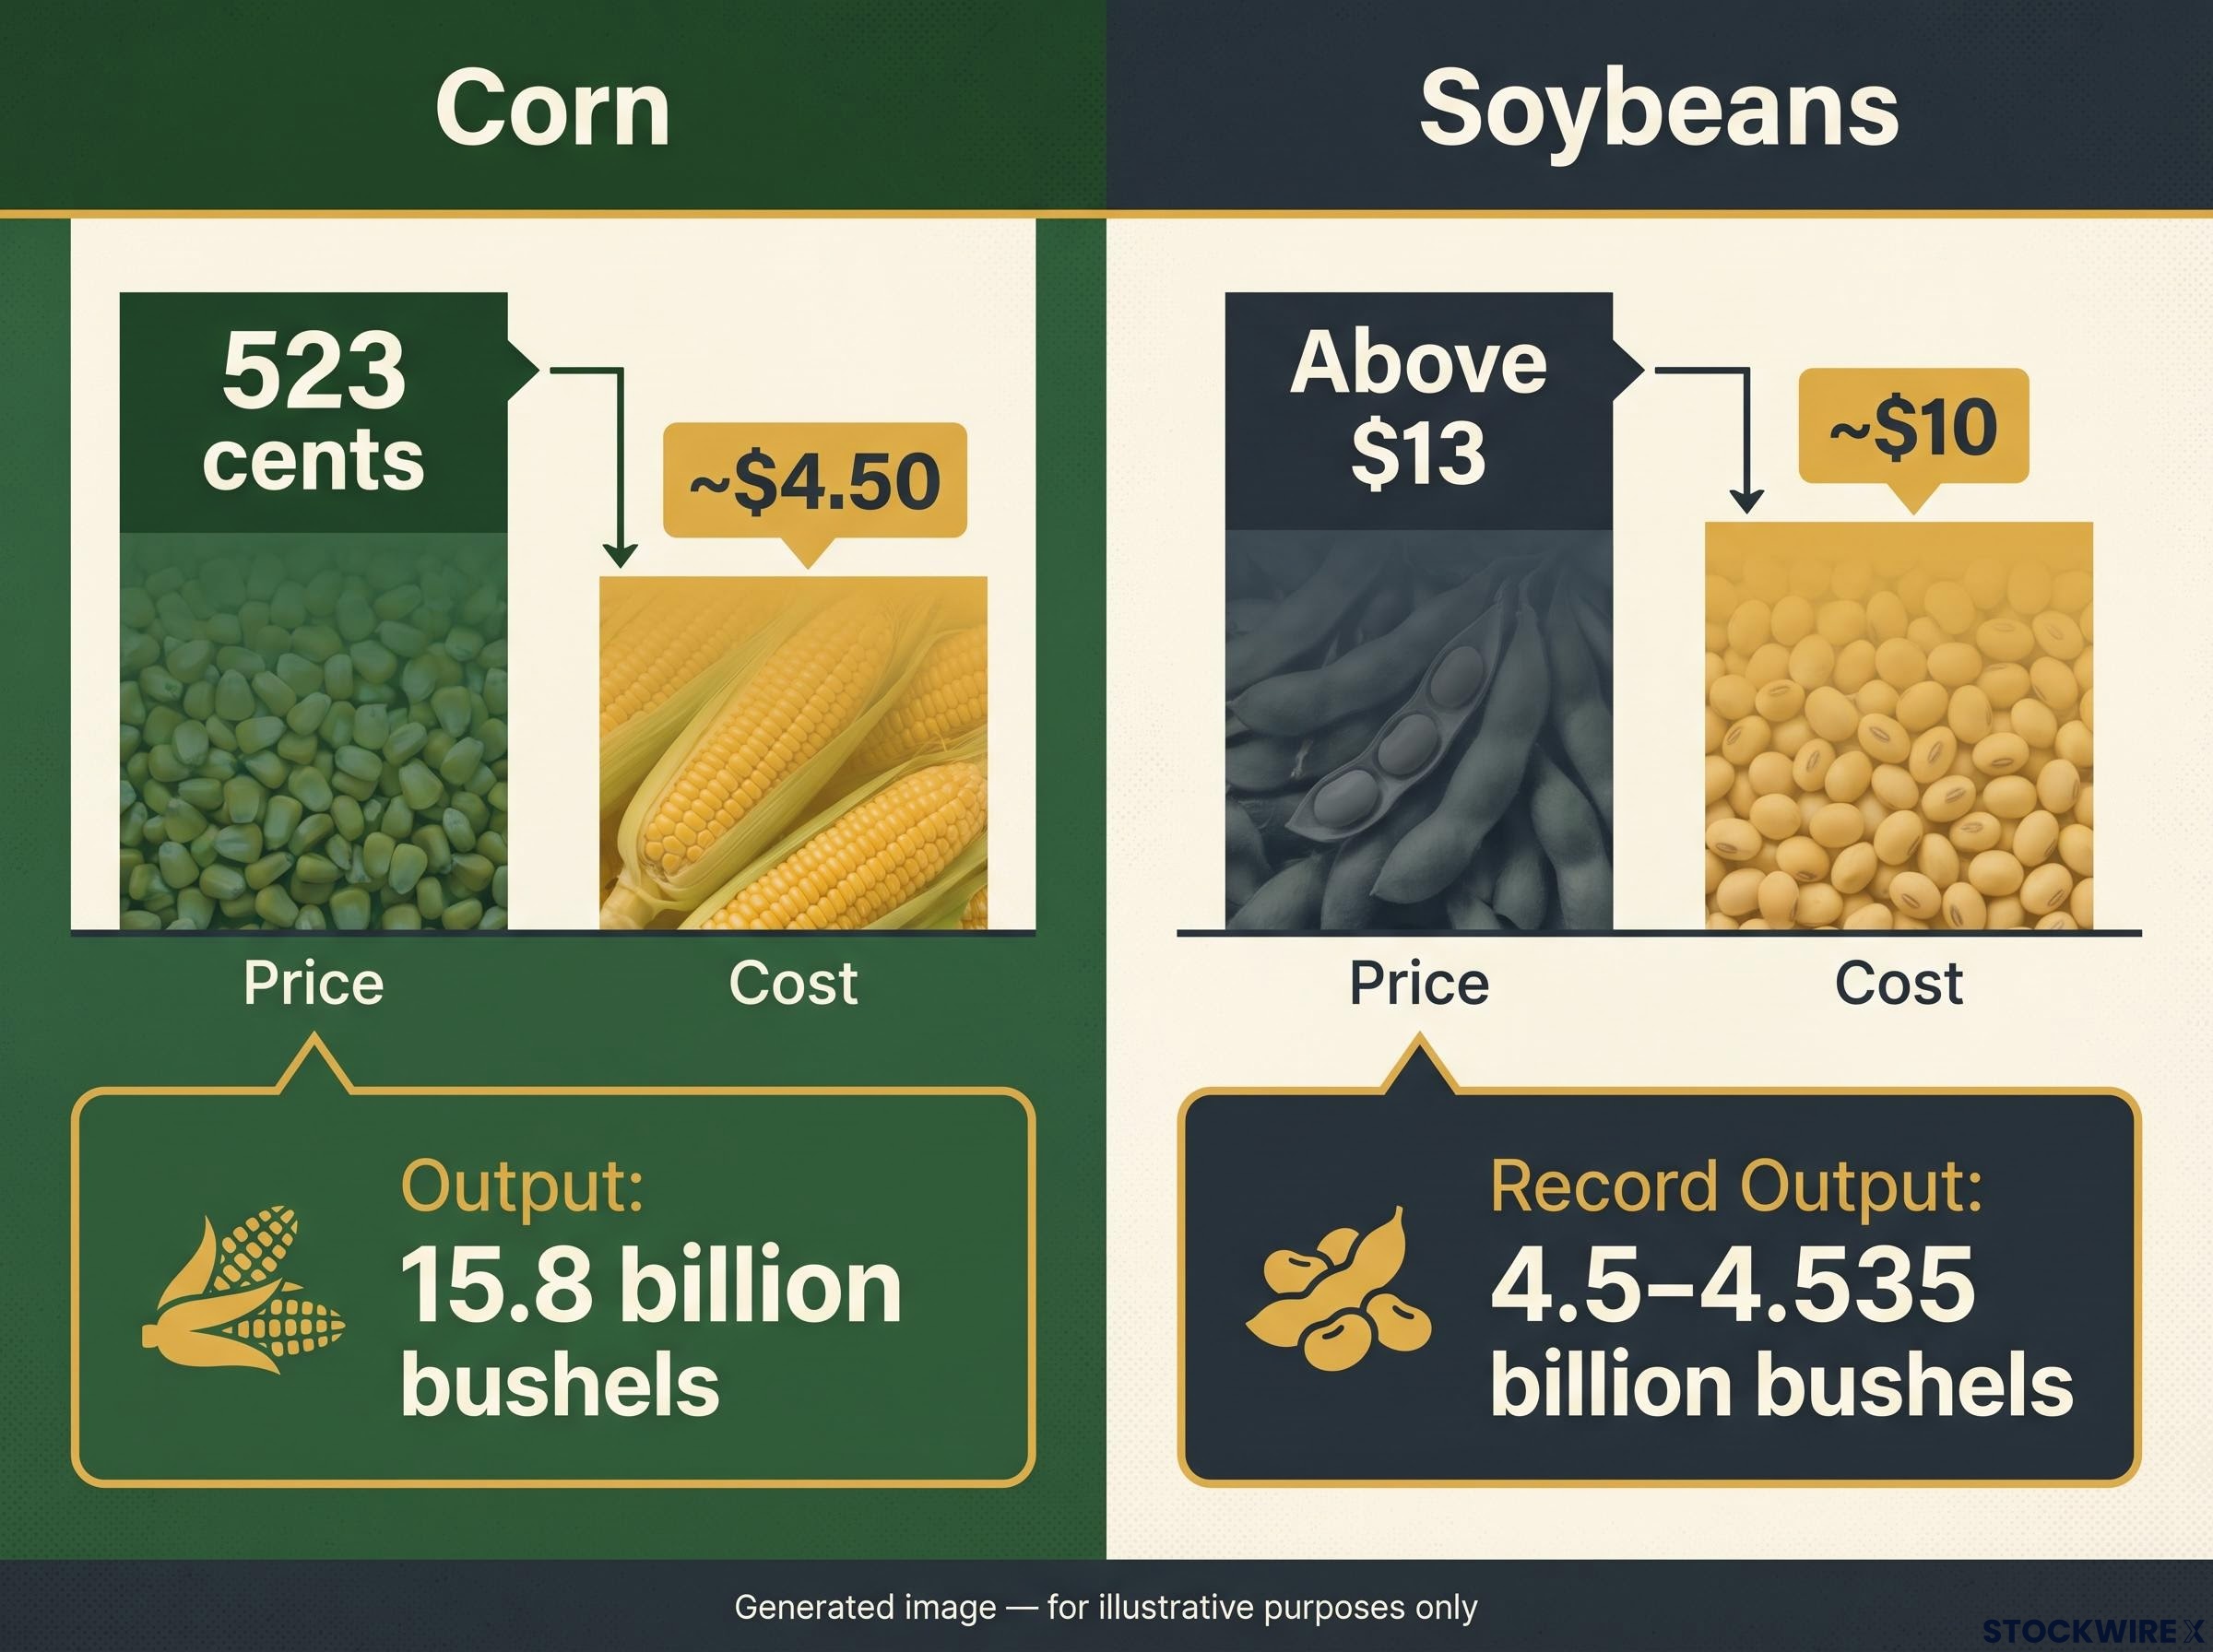
The USDA’s WASDE Report No. 675, issued 11 September 2026, put U.S. soybean production at a record 4.5-4.535 billion bushels, lifted by higher harvested area and a national yield of 52.8 bpa. Corn production came in at 15.8 billion bushels despite a weather-driven yield cut of 2.2 bpa to 178.5 bpa, and the soybean export forecast was raised 25 million bushels to 1.69 billion bushels.
Now look at the margins driving farmer behaviour.
| Commodity | Current Price | Production Cost | 2026/27 Output | Key Supply Risk |
|---|---|---|---|---|
| Corn | 523 cents/bushel | ~$4.50/bushel | 15.8 billion bushels | Weather-driven yield swings |
| Soybeans | Above $13/bushel | ~$10/bushel | 4.5-4.535 billion bushels (record) | Brazil acreage expansion |
Both sit comfortably above the cost of production, and that is the whole problem.
Soybeans above $13 a bushel against a marginal cost near $10 is not a signal of structural scarcity. It is a standing invitation to plant more.
The cobweb cycle: how one to three seasons of optimism become years of oversupply
Agricultural economists describe this pattern as a cobweb cycle, a self-correcting loop that plays out in three predictable steps. A price spike pushes grain well above production cost. Higher expected margins prompt farmers worldwide to expand acreage and invest in yield. Because planting decisions take at least a season to reach the market, the resulting supply boom typically lands 1-3 seasons later, lifting ending stocks and forcing prices back toward or below marginal cost.
The post-2012 precedent confirms it is not theoretical. After the 2012 U.S. drought spiked corn and soy, expanded acreage and yield recovery across the Midwest and the Brazilian Cerrado produced multi-year surpluses and markedly lower prices through the mid-2010s.
Brazil is what makes this cycle global and fast. The country now supplies roughly 44% of world soybeans, a share that has doubled over two decades, and its planting season runs six months offset from the U.S. That offset matters: high prices draw a planting response across South America that lands in the opposite hemisphere’s growing season, turning a single supply boost into a year-round wave.
The biofuel linkage deepens the exposure. One-third of the domestic corn crop is diverted to ethanol and one-third of soybeans to biodiesel, tying grain demand floors directly to energy policy.
What this means for agricultural exposure is uncomfortable. The current record soybean harvest may be the opening act of a multi-season supply build, not its peak, and any ETF or agribusiness equity priced for sustained high grain prices deserves stress-testing against that possibility.
What the bears get wrong: the risks that could delay a glut
The supply-side case is directional, not certain, and the counter-arguments deserve real weight rather than a token caveat. Four objections carry genuine analytical force:
OPEC intervention capacity is a genuine counter-risk, but its structural reach has narrowed considerably: the cartel now controls roughly 27-28% of global crude supply following the UAE’s formal withdrawal in May 2026, down from a historical peak above 50%, which materially limits how much coordinated cutting can offset a surplus at the scale the EIA projects for 2027.
- OPEC+ intervention capacity. Coordinated production cuts can absorb surplus and re-inflate prices if they fall too far.
- Geopolitical disruption risk. More than 10 mb/d of Gulf production is currently shut in, a reminder that baseline supply assumptions can be removed abruptly.
- Agricultural climate shocks. A single bad season can reverse a multi-year supply build, as the summer 2026 corn yield loss of 2.2 bpa from excessive rainfall shows in real time.
- Structural demand floors. Petrochemicals, aviation, and emerging-market industrialisation keep underlying oil demand from simply collapsing.
The underinvestment argument sits underneath all of these. Years of capital restraint in upstream oil and gas outside U.S. shale have left non-OPEC supply leaning on existing producing assets with natural decline rates. The nominal 2027 surplus therefore depends on geopolitical conditions holding and Gulf capacity returning on schedule, neither of which is guaranteed.
Near-term tightness could also amplify any fresh shock. The EIA projects U.S. distillate inventories falling below 100 million barrels in September 2026 and staying below the five-year low through much of 2027, leaving middle distillates vulnerable to a sharp spike.
For investors, the signals worth monitoring are specific:
- OPEC+ production cut announcements.
- Gulf infrastructure repair timelines.
- South American weather through the northern hemisphere winter planting season.
- Biofuel mandate changes that move ethanol and biodiesel demand floors.
- China import data, given its pivotal role in soybean and corn feed demand.
Here is the read to take from the counter-case. These risks are mostly event-driven rather than structural, which means they are sources of timing uncertainty around a directional thesis, not reasons to dismiss it. The structural forces, EV adoption and North American supply dominance, point one way; the event-driven risks simply govern when the surplus arrives.
Positioning for a market that prices today and ignores tomorrow
Oil and agriculture are telling the same story on slightly different clocks. Both show prices well above marginal cost, official forecasts building toward surplus, and supply responses already visible in the data. For an investor with diversified commodity exposure, that convergence creates a layered set of decisions rather than a single call.
The asymmetry is the heart of it.
The commodity supercycle framework offers the bullish counter-case in its most coherent form: multi-decade supply underinvestment colliding with policy-anchored demand in energy transition and reshoring creates conditions where structural price support can persist well beyond what a single-cycle surplus analysis implies, and investors holding long positions often cite this thesis as their primary justification for staying the trade.
A 4.90 mb/d oil surplus or a multi-season soybean supply build could compress prices toward marginal cost over several quarters, while OPEC+ cuts or a climate shock tend to produce shorter, sharper spikes. The downside builds slowly and the upside arrives in bursts, which favours tactical rather than strategic long positions.
Three questions belong in the next portfolio review:
- Are your commodity-linked equity positions priced for current spot levels, or for the 12-18 month supply build the EIA and USDA data describe?
- Is your agricultural exposure weighted toward producers who benefit from high input-cost environments, or toward those most exposed to price normalisation?
- Have you accounted for the biofuel linkage, where any change to renewable fuel standards feeds directly into corn and soybean price floors?
With commodity prices running roughly 15-30% above marginal production cost, the risk in current commodity portfolios runs to the downside. Investors who engage the supply-side data now can act before the surplus reaches the price. Those who wait for the price signal are, by definition, acting after the damage is done.
This article is for informational purposes only and should not be considered financial advice. Investors should conduct their own research and consult with financial professionals before making investment decisions. Past performance does not guarantee future results, and these forecasts are speculative and subject to change based on market developments, geopolitical events, and weather conditions.