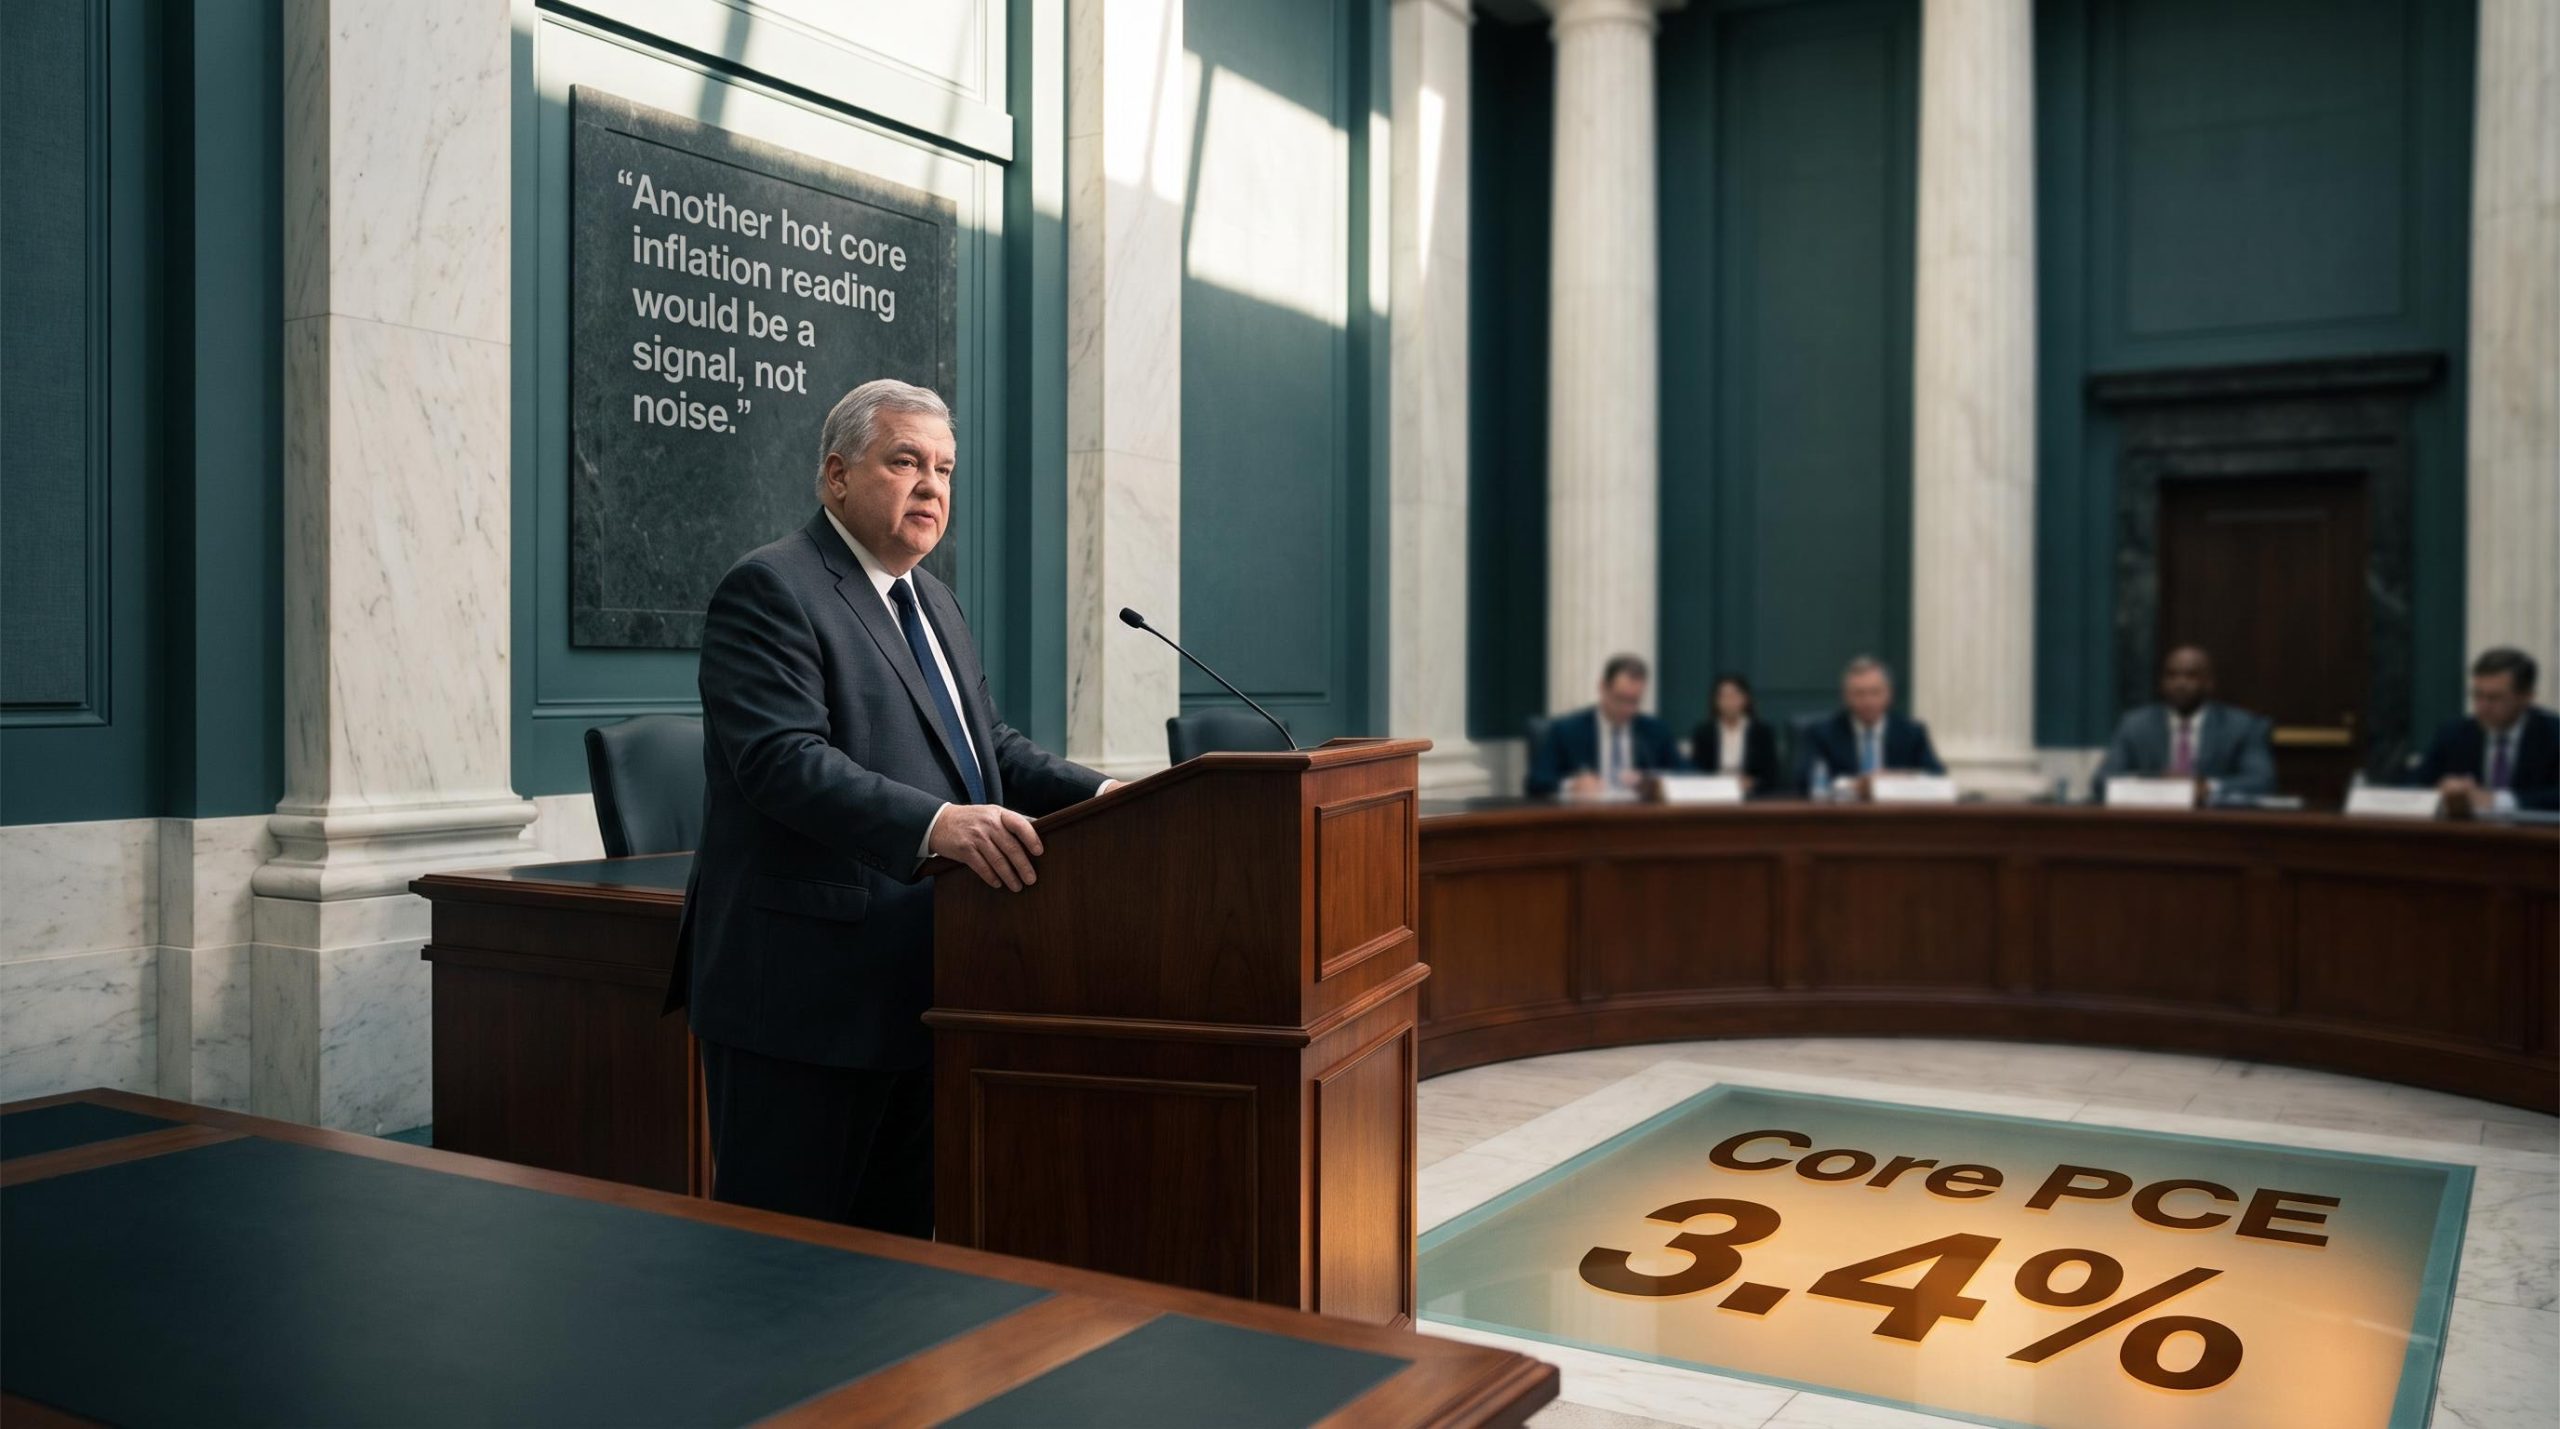
The VIX looks calm. Equities keep grinding higher in aggregate. And yet every time Fed Governor Christopher Waller steps to a podium, stocks fall. The pattern has repeated across six public appearances in 2026, each one pulling rate-cut expectations further from the market’s grasp.
The data underneath explains the pattern. Core Personal Consumption Expenditures (PCE), the Fed’s preferred inflation gauge, rose from 3.0% in December 2025 to 3.4% in May 2026. Headline PCE hit 4.1% over the 12 months through May 2026. The rate-cut narrative that carried markets into the year has been quietly buried, and Waller is the official who keeps shovelling dirt on the grave.
Here is what the data and the rhetoric together are telling you about the remainder of 2026: why Waller’s communications have become the single most important signal for the rate path, why the calm VIX understates the macro risk you are carrying, and which parts of your portfolio are most exposed to a world where higher-for-longer is no longer a warning but the operating assumption.
How Christopher Waller went from dissenter to inflation hawk in six months
Waller’s shift did not happen overnight. It happened in five documented stages, each one a response to data that came in hotter than the last. Traced in sequence, the pivot looks less like a surprise and more like the only rational response to what the numbers were saying.
- January 2026: Waller dissented from the Federal Open Market Committee (FOMC), the Fed’s rate-setting body, favouring an additional 25 basis-point cut on concerns about labour market softening.
- March 2026: He shifted to counselling “caution for now,” making further cuts explicitly data-dependent.
- 17 April 2026: He warned that the Iran conflict and tariff effects risked creating a “more lasting increase in inflation,” stepping back from the cutting path entirely.
- 22 May 2026: He urged the Fed to remove its “easing bias” from the policy statement, arguing a future rate hike should be just as plausible as a cut, and cited inflation running at approximately 3.8%.
- 13 July 2026: He described inflation as “taking off” relative to a stabilising labour market and issued his sharpest warning to date.
“Another hot core inflation reading would be a signal, not noise.” — Christopher Waller, 13 July 2026
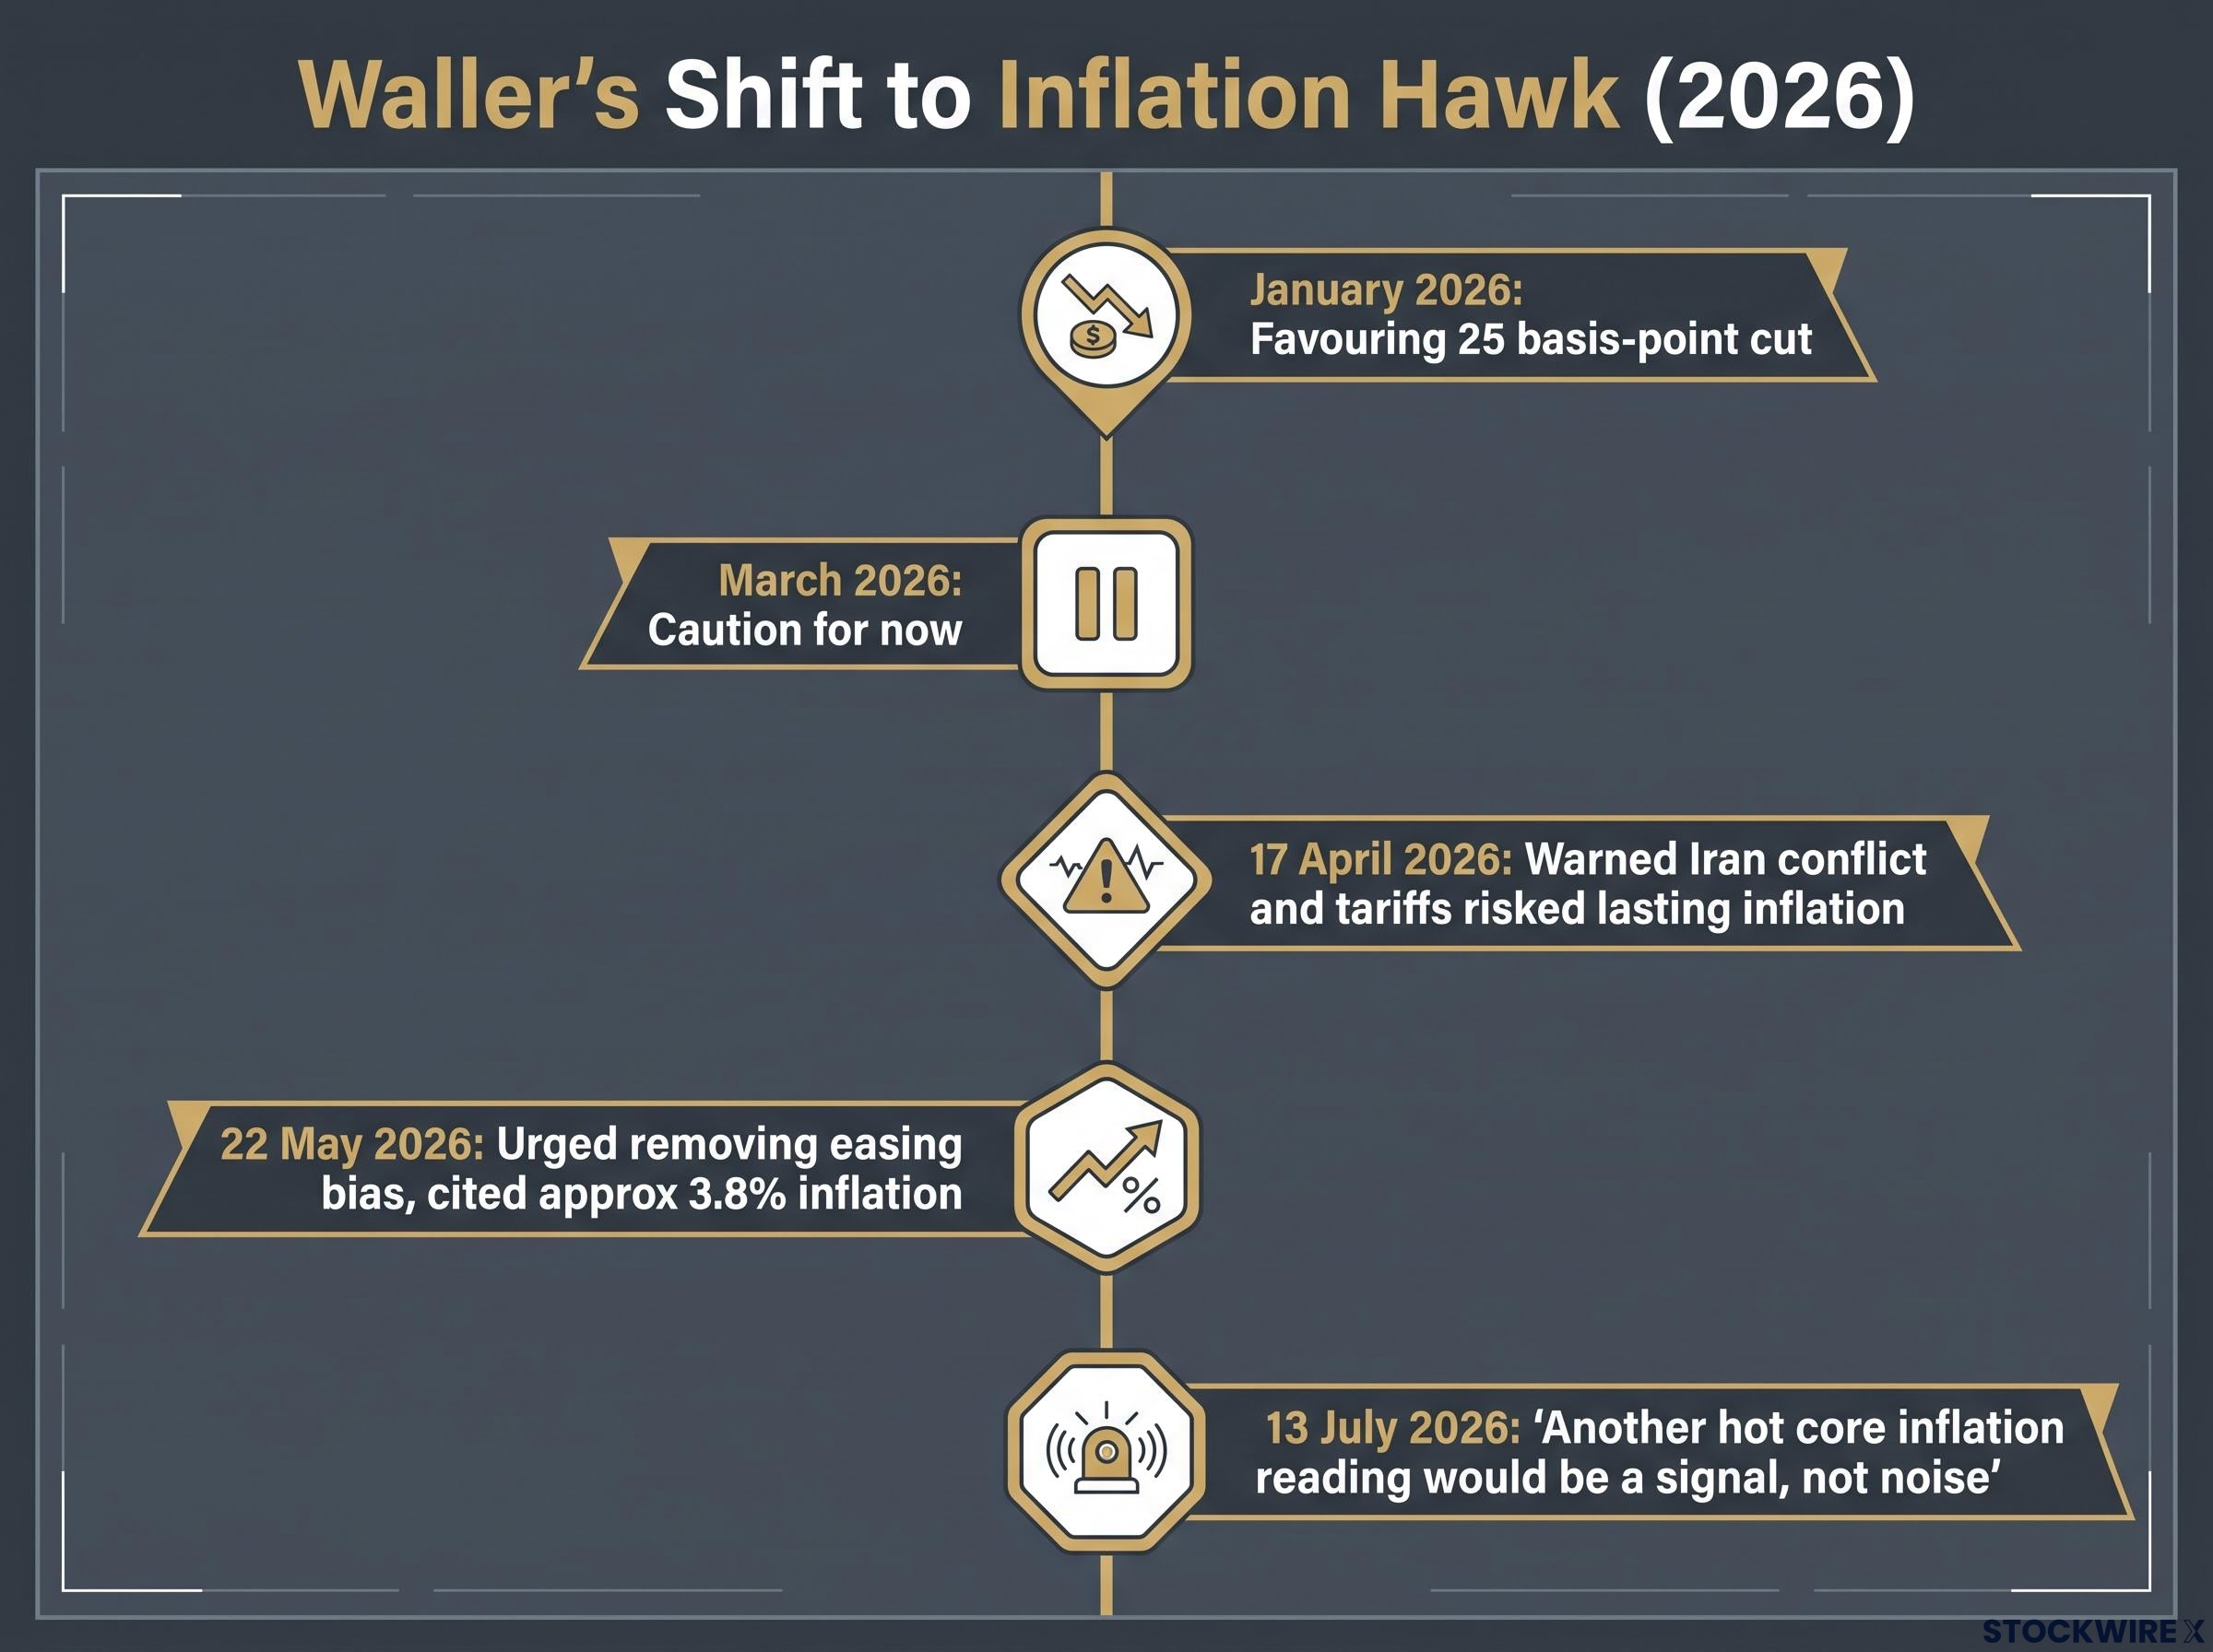
That final statement is not an outlier. It is the rhetorical endpoint of a six-month evolution driven by core PCE rising from 3.0% to 3.4% and headline PCE reaching 4.1%. Each speech closed off one option (cuts) and opened another (holding, then potential hiking).
The core PCE data released in June 2026 landed exactly at 3.4% year-over-year, matching consensus but sitting 140 basis points above the Fed’s 2% target, providing the precise empirical foundation that Waller’s April and May communications had already anticipated.
What this tells you is that the next Fed move is now genuinely symmetric. Rate cuts and rate hikes sit on the same table. If you are still pricing in relief by year-end, you are working from a script that Waller has explicitly discarded, one speech at a time.
When big ASX news breaks, our subscribers know first
Contradictory signals: elevated yields and a subdued VIX in the same environment
Two market signals that should not coexist are sitting side by side in mid-2026: elevated short-end Treasury yields and a historically subdued VIX. One says macro risk is real and rising. The other says the market is not particularly worried about it.
The VIX has remained historically subdued through mid-2026 despite compounding uncertainties: sticky inflation, hawkish Fed rhetoric, geopolitical volatility from the Iran conflict, and a rate path that now includes tightening as a live option. On the surface, that reads as reassurance. Underneath, three structural factors explain why implied volatility has stayed low even as macro stress has risen:
- Institutional under-hedging: When large investors are not aggressively buying downside protection, implied volatility embedded in equity options stays low regardless of what the macro environment is doing.
- Index concentration: A narrow group of mega-cap technology and AI-linked companies has carried a disproportionate share of index performance, dampening headline volatility even as smaller names experience larger swings.
- An intact AI capital expenditure cycle: Sustained spending on AI infrastructure continues to support earnings for the dominant index constituents, compressing perceived near-term risk in those names.
The actual session-level data tells a different story from the VIX headline.
In one closely watched post-Waller session, the S&P 500 shed roughly 19 points, while the Russell 2000 bore the heaviest losses at around 1.2%, with the NASDAQ also finishing in negative territory at approximately 0.6%.
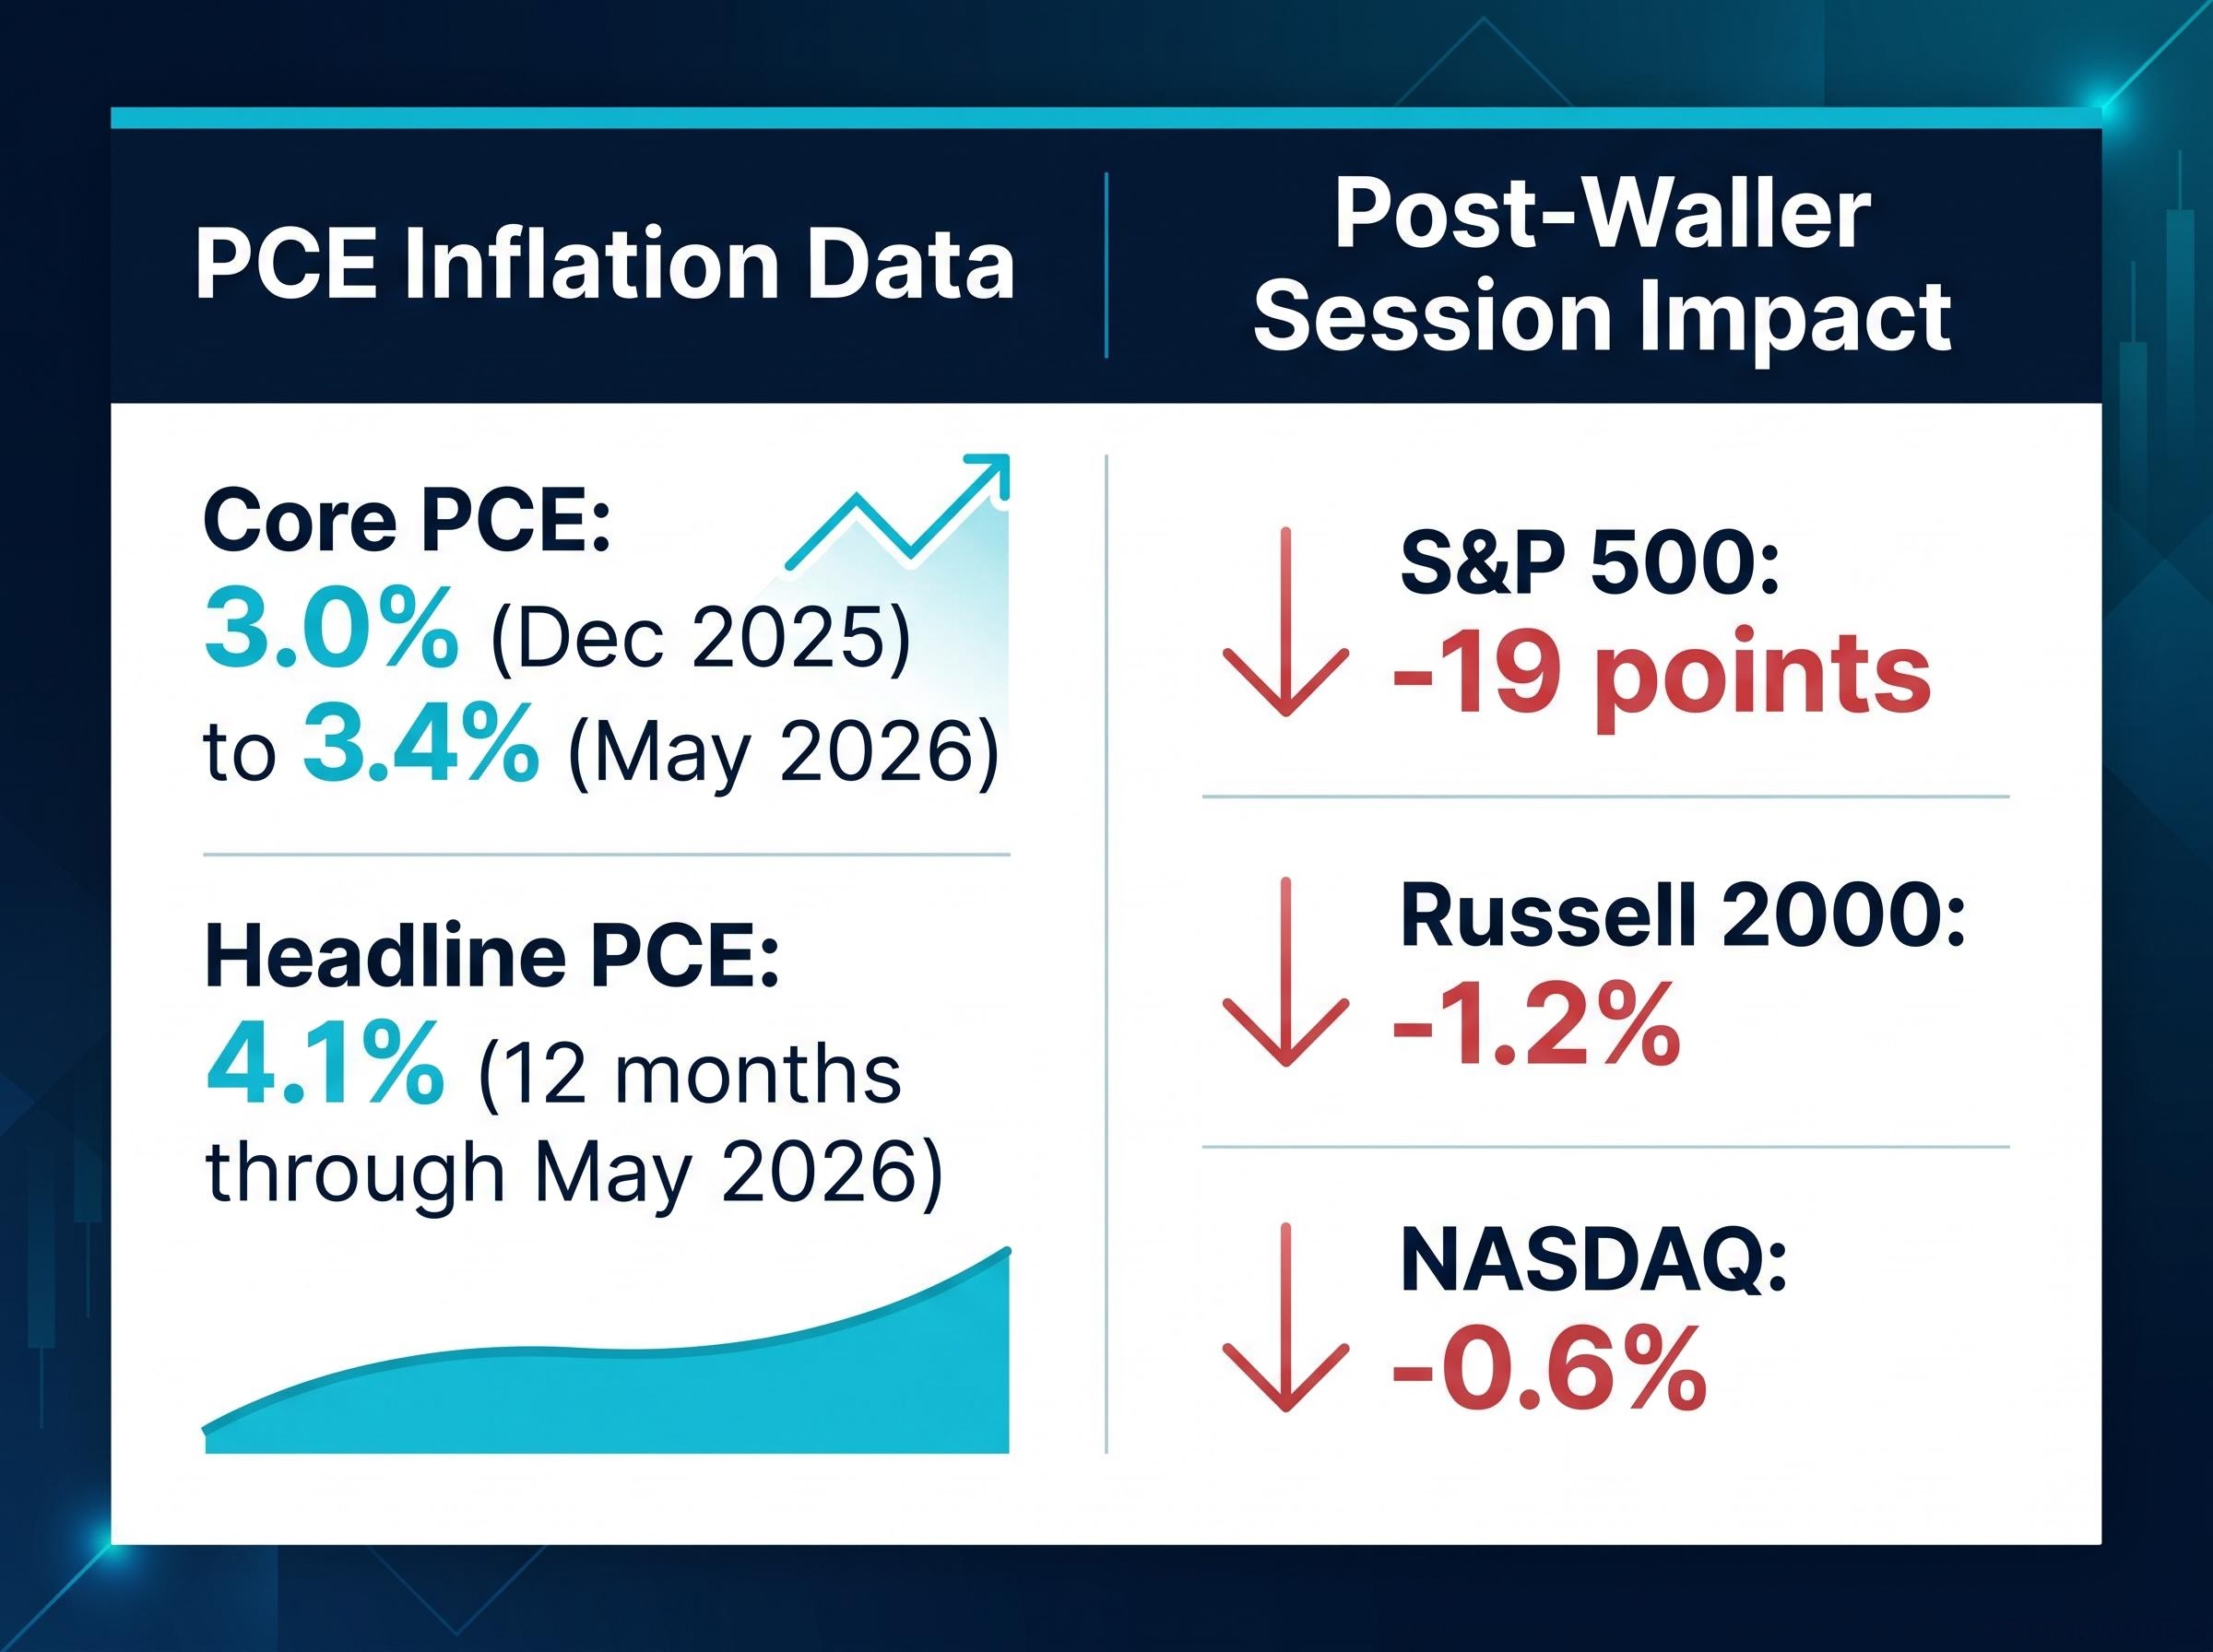
That cross-asset pressure, concentrated in rate-sensitive and small-cap names, is the macro risk the VIX is not capturing. When short-end Treasury yields climb, they raise the opportunity cost of holding assets that generate no income, meaning gold, silver, and cryptocurrencies all face a structural disadvantage as risk-free rates become increasingly competitive alternatives.
A subdued VIX when macro uncertainty is this elevated does not mean risk is low. It means downside protection is cheap. For your portfolio, that is a distinction worth acting on rather than finding comfort in.
The VIX and valuation divergence now visible across major indices reflects a documented structural phenomenon: the spot VIX measures realised volatility expectations over 30 days, a materially different question from whether equities are correctly priced on a multi-year horizon, and conflating the two leads investors to misread calm conditions as macro safety.
Fed independence under pressure: how Waller’s data-driven stance shapes bond markets
Waller is a Trump appointee operating inside an administration that has publicly favoured lower interest rates. That political context is not background colour. It is a live pricing input for bond markets.
Every time Waller reinforces data-driven hawkish messaging, he is making a documented choice to resist political pressure. He has defended the 2% inflation target as a “credible pledge,” even while conceding he would personally prefer it expressed as a range.
Central bank independence functions as a yield curve pricing input because markets must continuously estimate whether the institution’s reaction function reflects incoming data or political pressure, and the Nixon-Burns episode of the early 1970s remains the canonical example of what happens to long-term rates when that distinction collapses.
“Changing the target now would damage credibility.” — Christopher Waller on the 2% inflation target
He has repeatedly emphasised keeping the Fed’s “reaction function,” the framework markets use to predict how the Fed will respond to incoming data, clearly understood. That means no pre-commitment to a rate path that data could contradict. Dan Newman, CEO of Futurum Group, has framed Waller’s communications as a central interpretive lens for the current trading environment, noting that his speeches function as real-time signals about both inflation policy and institutional integrity.
The anticipated Jackson Hole appearance later this summer is widely viewed as a necessary institutional signal, regardless of whether it changes the policy substance. Waller needs to be seen defending independence in a visible, high-profile forum.
When Fed independence becomes a spread compressor
Here is the mechanism that makes independence a pricing input, not just a governance principle. When markets believe the Fed is being politically managed, long-term yields rise to compensate for the perceived loss of inflation discipline. Bond market vigilantes, the large institutional investors who demand higher yields when they suspect fiscal or monetary laxity, force tighter financial conditions in a disorderly fashion. That tightening hits harder than any single rate decision because it reprices the entire yield curve at once.
Waller’s hawkish consistency is doing the work of containing this premium. Even when individual sessions show equity declines after his speeches, those declines are far less disruptive than the alternative: a disorderly repricing of term premiums across 10-year and 30-year Treasuries. If you hold rate-sensitive assets, you are benefiting from Waller’s independence signalling whether you recognise it or not.
Portfolio exposure in a higher-for-longer world: four pressure points to address
Waller’s policy stance translates directly into four concrete portfolio pressure points. Each one connects his documented position to a specific mechanism affecting a specific set of assets.
| Pressure Point | Mechanism | Asset Classes Affected | Investor Action |
|---|---|---|---|
| Duration risk | Waller’s willingness to hold or hike means long-duration bonds carry meaningful price risk from further yield increases | Long-dated Treasuries, investment-grade corporate bonds | Evaluate shifting toward shorter maturities or floating-rate instruments |
| Small-cap vulnerability | Floating-rate debt and refinancing costs rise as policy stays restrictive, squeezing margins for leveraged firms | Russell 2000, small and mid-cap equities with high debt loads | Assess small-cap overweight as an implicit bet on a dovish turn Waller has not endorsed |
| Non-yielding asset headwinds | Elevated short-end Treasury yields offer competitive income, raising the opportunity cost of holding zero-yield assets | Gold, silver, cryptocurrencies | Recognise the structural headwind persists unless a flight-to-safety shock overwhelms yield considerations |
| Volatility hedging opportunity | A subdued VIX prices downside protection cheaply while macro uncertainty remains elevated | Equity portfolios broadly | Evaluate tail-risk hedges or structured downside protection while implied volatility understates actual risk |
The Russell 2000’s disproportionate 1.2% session decline after Waller’s remarks illustrates the small-cap pressure point in real time: these firms carry more floating-rate exposure and face higher refinancing costs in a restrictive environment.
Two additional overlays compound these structural pressures. Seasonally unfavourable patterns traditionally apply to equities in late summer and early autumn, a period now underway. And U.S. election uncertainty introduces fiscal, regulatory, and taxation policy risk that remains unresolved through the remainder of 2026. The combination means the cost of being wrong without a hedge is asymmetrically higher than the cost of the hedge itself, a calculation worth making explicitly rather than deferring to the calm VIX as validation.
What changes Waller’s calculus, and what to watch for the rest of 2026
Waller has told you exactly what he is watching. The surveillance framework is embedded in his own speeches, and tracking his specific language thresholds gives you a materially earlier read on Fed pivot risk than waiting for formal rate decisions.
Four variables deserve active monitoring in his upcoming communications, starting with the Jackson Hole appearance and running through subsequent FOMC meetings:
- Core inflation language: Waller has stated that another “hot” core inflation reading would be “signal, not noise” and could justify renewed tightening. Watch whether that threshold tightens or loosens in his phrasing.
- Labour market framing: His January dissent was rooted in labour market softening concerns. A meaningful deterioration in employment data is the specific condition he has identified as capable of shifting his stance back toward accommodation.
- Energy and tariff pass-through commentary: He has flagged Iran-linked energy price volatility and tariff effects as key watch variables for inflation persistence. Changes in how he characterises these risks will signal whether he sees inflation broadening or narrowing.
- Easing-bias removal status: His May call to remove the easing bias from the policy statement was a structural shift, not a rhetorical flourish. Whether the FOMC acts on that recommendation in coming meetings is a concrete policy marker.
The remainder of 2026 and into 2027 represents a window of genuine policy optionality rather than a foregone conclusion. Rate cuts and rate hikes both remain on the table. That demands active monitoring, not a set-and-forget portfolio stance.
For investors wanting to understand precisely what data threshold would shift Waller’s calculus toward accommodation, our full explainer on the Fed’s five-point convergence test details the simultaneous conditions across four inflation gauges and activity data that the FOMC requires before any easing step becomes credible.
The equity declines that follow Waller’s hawkish speeches are a feature of policy clarity, not a sign of policy error. The Fed is telling markets it will not engineer a quick return to the conditions that supported the last cycle. Investors who understand that distinction, and who track the specific triggers Waller has laid out, are positioned to read the next shift before it arrives in a formal rate decision.
This article is for informational purposes only and should not be considered financial advice. Investors should conduct their own research and consult with financial professionals before making investment decisions. Past performance does not guarantee future results. Financial projections are subject to market conditions and various risk factors.