The 2-year Treasury yield is trading above the upper bound of the fed funds range, a configuration that historically precedes policy tightening, not easing. As of 14 May 2026, the bond market is sending a message the Federal Reserve has not yet officially acknowledged. A hotter-than-expected April PPI print (6.0% year-over-year versus 4.8% consensus) and a core CPI beat (3.6% versus 3.4% expected) have materially repriced the rates debate in a single week. What was once a minority view, no cuts in 2026, has moved rapidly toward the centre of Wall Street consensus. This analysis examines what Yardeni Research’s “none-and-done” framework means for bond investors: how to read the signals the market is already pricing, where major forecasters agree and disagree, and what duration and positioning adjustments are warranted in a prolonged higher-for-longer regime.
What the April inflation data actually changed
The repricing started with a single number. April final demand PPI came in at +1.4% month-over-month and +6.0% year-over-year, the fastest annual pace since December 2022 and a full 1.2 percentage points above the 4.8% consensus. Treasury yields jumped 10 basis points within hours.
The following day’s core CPI print confirmed the signal: +3.6% year-over-year versus +3.4% expected. On its own, a 20-basis-point beat might be dismissed. Paired with the PPI shock, it was not.
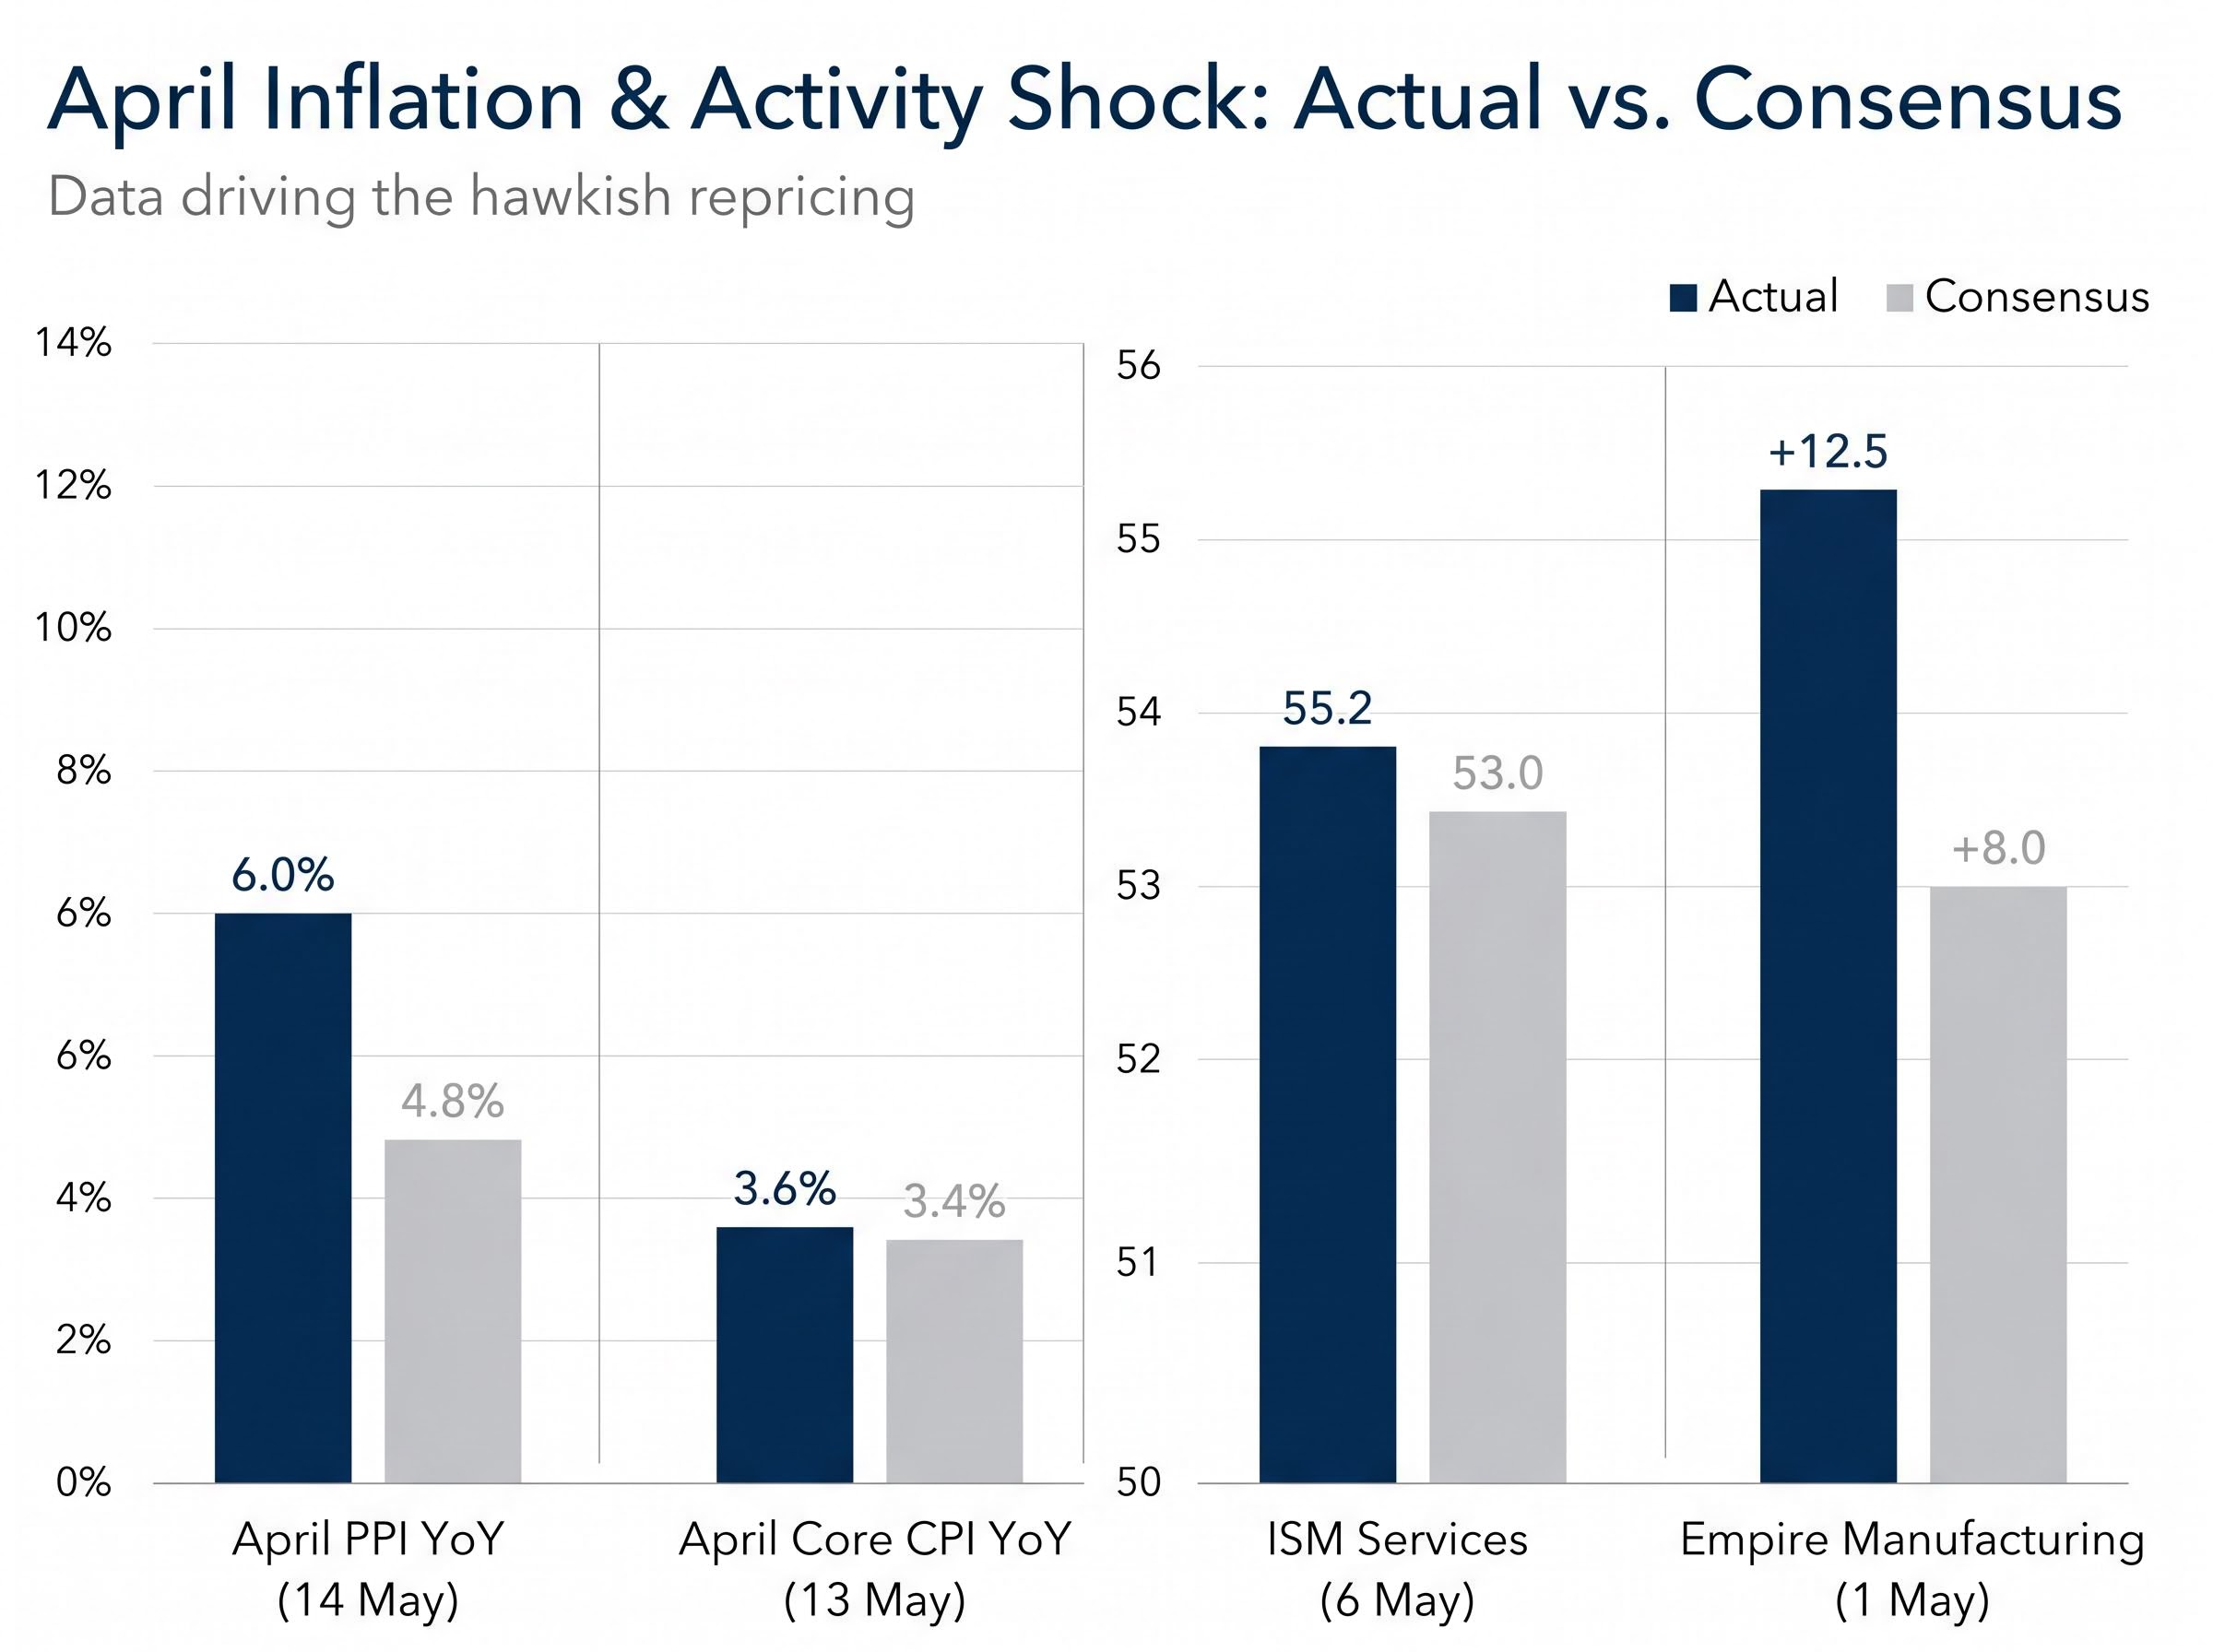
| Release | Date | Actual | Consensus | Market Impact |
|---|---|---|---|---|
| April PPI YoY | 14 May | +6.0% | +4.8% | Hawkish shock; yields +10bp |
| April CPI (Core YoY) | 13 May | +3.6% | +3.4% | Hotter than expected |
| ISM Services | 6 May | 55.2 | 53.0 | Expansionary; input prices above 60 |
| Empire Manufacturing | 1 May | +12.5 | +8.0 | Price index at 85 |
Pipeline pressures: freight, services, and inflation expectations
The ISM Services reading of 55.2 (versus 53.0 consensus on 6 May) had already flagged demand-side resilience, with its input prices sub-index holding above 60. More telling was the trucking freight subcomponent embedded in the PPI detail: +8.1% month-over-month, the largest single-month increase since 2009. Freight costs sit upstream of consumer prices; when they move at that magnitude, they signal pipeline pressure that has not yet reached CPI.
The trucking freight subcomponent in the April PPI detail connects directly to pipeline inflation pressure that corporate margin absorption has so far contained: Procter and Gamble, Nike, and Hasbro are compressing gross margins by approximately 150 basis points rather than passing input costs through to retail shelves, a dynamic that has delayed but not eliminated the transmission from upstream producer prices to core CPI.
TIPS breakevens confirmed the market recalibrated. The 5-year breakeven jumped to 2.68% (+18bp week-over-week) and the 10-year to 2.45% (+15bp), a sharp reversal from pre-PPI levels of 2.10-2.20%.
“TIPS rally suggests market pricing 3%+ core PCE through 2026.” (Financial Times, 13 May 2026)
This was not one anomalous release. It was a synchronised cluster, PPI, CPI, services activity, freight, and inflation expectations, all pointing in the same direction.
When big ASX news breaks, our subscribers know first
Ed Yardeni’s zero-cuts thesis and why it is gaining ground
Ed Yardeni’s base case is zero rate cuts in 2026. The framework, reiterated on 12 May on CNBC, rests on a structural productivity argument: approximately 2.5% productivity growth keeps the economy resilient and inflation moderately elevated, removing the Fed’s rationale for easing. Yardeni’s near-term 10-year Treasury yield target sits at 4.60%. As of 14 May, the 10-year was trading at 4.52%, already within 8 basis points of that target.
The distinction between geopolitical risk premium and structural drivers in the yield surge matters for investors modelling how far yields could retrace: Wolfe Research’s decomposition attributes only 10-15 basis points of the 40-basis-point move to reversible geopolitical factors, with the remainder tied to growth repricing and inflation persistence that a diplomatic resolution would not unwind.
The distinction matters. “None-and-done” is a hold call, not a tightening call. Yardeni explicitly acknowledges a rising probability of a hike as a tail risk, but his base case is zero movement in either direction.
Three structural drivers underpin the thesis:
- Five consecutive years of above-target inflation have reset expectations, making a return to 2% increasingly difficult without demand destruction the Fed has shown little appetite for.
- AI infrastructure investment is functioning as a sustained inflationary input; capital expenditure on data centres and power infrastructure is non-discretionary in the current competitive environment.
- Productivity growth near 2.5% contains wage-driven inflation without requiring tighter policy, but it also means the economy does not slow enough to justify cuts.
The framework is no longer an outlier. High Frequency Economics revised its 2026 terminal rate forecast to 4.75% (from 4.25%) post-PPI, adopting none-and-done as its base case.
“Yardeni’s none-and-done feels right if PPI trend holds, but we don’t see hikes yet.” (Savita Subramanian, Bank of America, 11 May 2026)
What the 2-year yield above fed funds is actually signalling
The 2-year Treasury yield sits at 4.74%, above the upper bound of the 4.50-4.75% fed funds target range. The 10-year at 4.52% puts the 2s10s spread at -22 basis points, the widest inversion since March 2026. Multiple strategists have cited this configuration as a “pre-hike” market signal.
Fed Governor Christopher Waller made the connection explicit on 10 May: “If inflation reaccelerates, hikes back on table; 2-year yield above funds is telling.” The 2-year yield, which tracks the market’s expectation for the average fed funds rate over the next two years, prices in where policy is heading. When it trades above the current rate, the bond market is signalling that the next move is more likely to be a tightening than an easing.
| FOMC Meeting | Hold % | Cut 25bp % | Hike 25bp % |
|---|---|---|---|
| June 16-17 | 72% | 23% | 5% |
| July 29-30 | 58% | 35% | 7% |
| September 15-16 | 42% | 48% | 10% |
CME FedWatch probabilities (as of 14 May, 1 PM ET) show no meeting with greater than 50% odds of a hike. The base case remains hold or cut. But the shift from pre-PPI levels is stark: on 7 May, the June hold probability was 55% and hike probability sat below 2%. The distribution has moved meaningfully hawkward.
Where the major forecasters agree (and where they split)
The median Wall Street forecast still calls for two cuts, but the distribution of risk has shifted sharply since early May. According to Bloomberg’s consensus survey (14 May), 75% of respondents expect at least one cut, with a median terminal rate of 4.25%. However, 10% now assign greater than 30% odds to hikes if June CPI runs hot.
| Firm | 2026 Rate Forecast | Terminal Rate | Hike Risk |
|---|---|---|---|
| Goldman Sachs | One 25bp cut, Q3 | 4.25-4.50% | Low |
| JPMorgan | Two cuts (50bp), H2 | 4.00-4.25% | 20% steady all year |
| Morgan Stanley | One 25bp cut, Q4 | 4.25-4.50% | 15% |
| High Frequency Econ. | None-and-done | 4.75% | Rising |
Chair Jerome Powell’s 13 May Chicago speech added another layer: “Recent data underscore need for caution; easing bias under review for June.” Bloomberg consensus indicates 90% of analysts expect the Fed to drop its easing bias at the June dot plot update.
FOMC forward guidance reliability has become a genuine variable in rates analysis: when committee votes fracture across hawkish and dovish lines simultaneously, the median dot plot carries less predictive weight than it does during periods of internal consensus, and investors cannot treat June’s statement language as a binding signal about the September meeting.
The transitory vs. structural debate: why it matters for June
The remaining disagreement is not about the number of cuts. It is about the nature of the inflationary pressure. Goldman Sachs and JPMorgan characterise the PPI and CPI beats as transitory. Yardeni, Governor Waller, and Evercore ISI frame them as structural.
Evercore ISI’s Krishna Guha put a number on it: 30% hike odds if the June CPI print confirms the PPI trend. If the structural camp is right, the June dot plot drops the easing bias and signals a higher terminal rate. If the transitory read holds and data softens, the two-cut consensus re-establishes. The June CPI release, scheduled before the 16-17 June FOMC meeting, is the next true decision point.
How bond investors are repositioning right now
The BofA Global Fund Manager Survey (10 May) provides the broadest evidence of the shift: 62% of bond investors shortened duration in the past month, moving average portfolio duration to 4.2 years from 5.1 years. 55% are overweight TIPS.
The survey data aligns with how the largest fixed income managers are positioning with real capital.
Duration targets and the case for the 3-5 year range
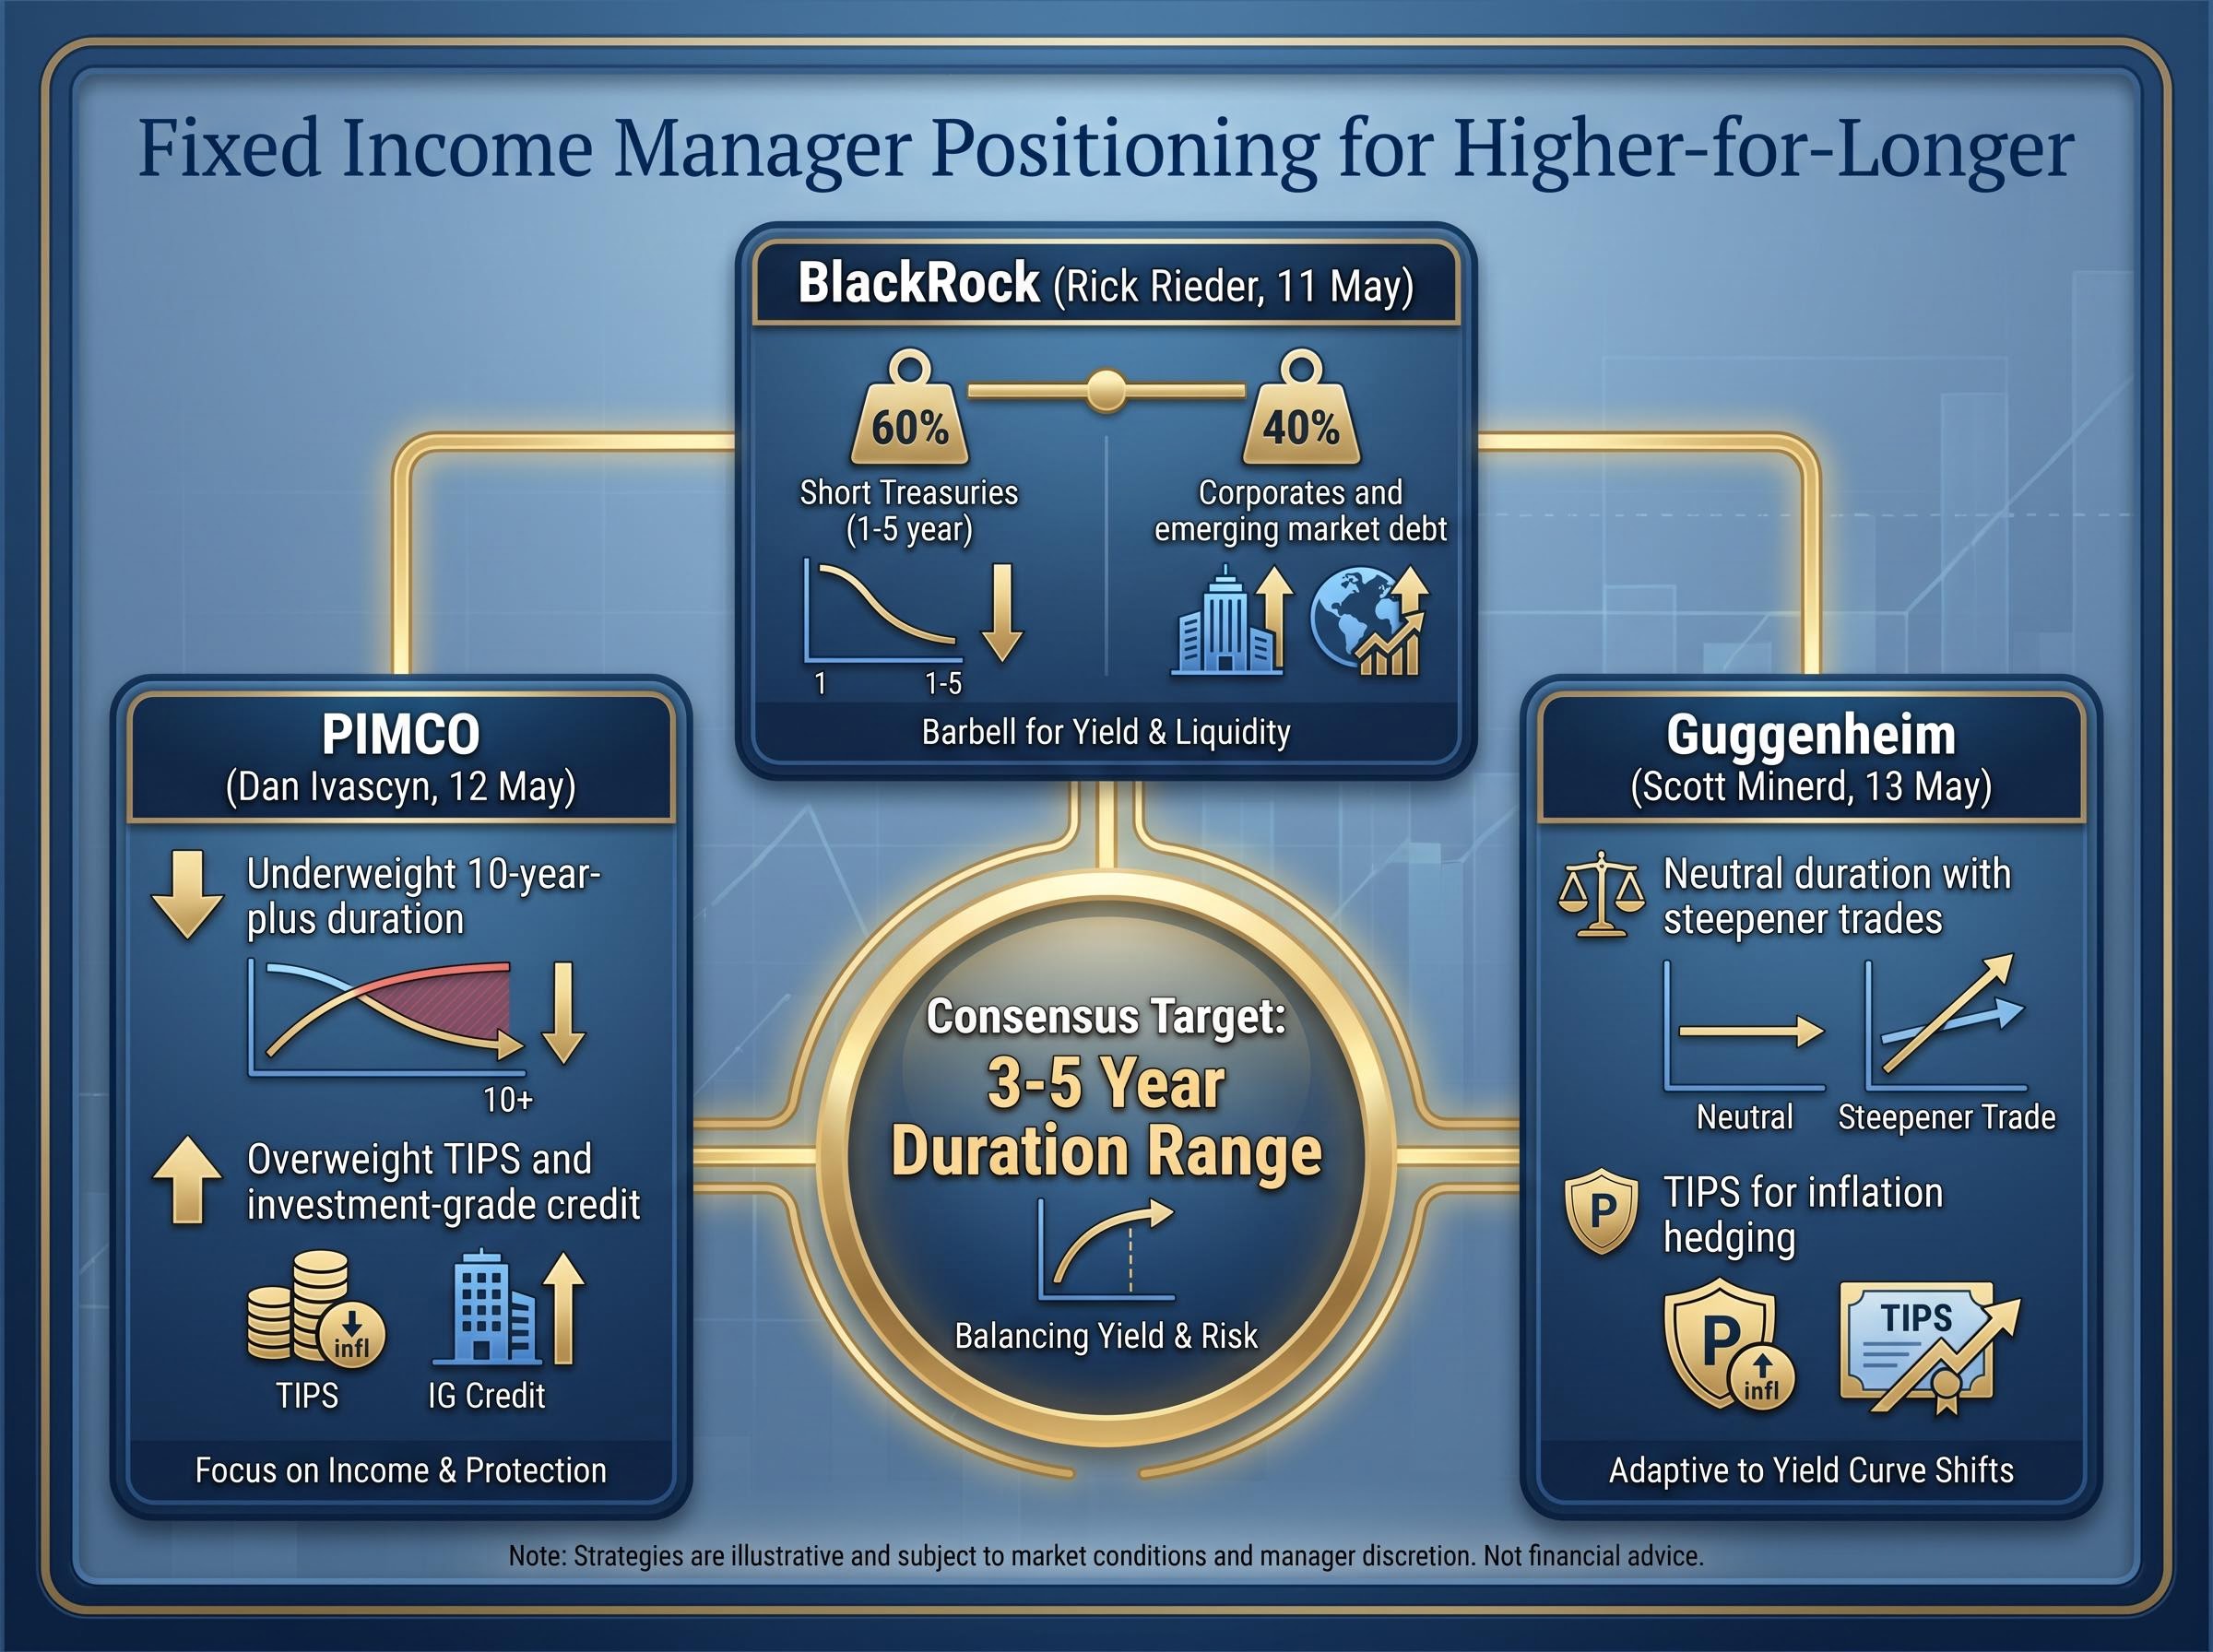
Three dominant strategies have emerged across major managers, all sharing a common logic: duration risk is disproportionately high relative to compensation at current yields, and spread product offers better risk-adjusted returns in a higher-for-longer regime.
- PIMCO (Dan Ivascyn, 12 May): Underweight 10-year-plus duration, overweight TIPS and investment-grade credit. Rationale: duration risk too elevated following the PPI shock.
- BlackRock (Rick Rieder, 11 May): Barbell strategy with 60% short Treasuries (1-5 year) and 40% corporates and emerging market debt. Rationale: extend in credit, not duration.
- Guggenheim (Scott Minerd, 13 May): Neutral duration overall with steepener trades (short 2-year, long 10-year if hikes are priced in). TIPS for inflation hedging.
“Prolonged 4.5%+ yields mean extend in credit, not duration.” (Rick Rieder, BlackRock, 11 May 2026)
A consistent 3-5 year duration target emerges across all three approaches and the BofA survey data. The very short end (1-3 year) carries elevated reinvestment risk: if the 2-year yield’s pre-hike signal proves correct and a hike materialises, reinvestment at the front end becomes uncertain. The 3-5 year range balances yield pickup against duration exposure.
Inflation above target for five years: the structural case investors cannot ignore
The phrase “higher for longer” has been in circulation for more than two years. What makes the current data environment different is the timeline: inflation has now run above the Fed’s 2% target for five consecutive years. By any reasonable definition, that duration exceeds “transitory.”
TIPS breakevens quantify the market’s reassessment:
| Maturity | Breakeven Rate | Change vs. Prior Week |
|---|---|---|
| 5-Year | 2.68% | +18bp |
| 10-Year | 2.45% | +15bp |
| 30-Year | 2.38% | +12bp |
All three sit well above the 2% target. The structural drivers, ranked by magnitude of impact, are reinforcing rather than fading:
- Five consecutive years of above-target inflation have re-anchored expectations. Market participants, businesses, and consumers have adapted to a 2.5-3.0% inflation environment, making a return to 2% harder without deliberate demand destruction.
- AI infrastructure spending sustains demand-side price pressure. Capital expenditure on data centres, power infrastructure, and compute capacity is non-discretionary; technology companies are spending irrespective of the rate environment.
- Labour market stability removes the easing trigger. Yardeni’s 2.5% productivity growth forecast means the economy grows fast enough to contain wage-driven inflation without tighter policy, but not slowly enough to justify cuts.
If these dynamics are durable rather than cyclical, bond investors need to recalibrate not just near-term duration but their longer-term assumptions about what a “normal” yield environment looks like.
The next major ASX story will hit our subscribers first
The June dot plot is the next true test for bond markets
The 16-17 June FOMC meeting is the pivot point. 90% of analysts surveyed by Bloomberg expect the Fed to drop its easing bias, and the dot plot will reveal whether the median FOMC participant has moved toward Yardeni’s none-and-done view or is holding to a two-cut scenario. The June CPI release, scheduled before the meeting, is the data-dependent trigger.
“Recent data underscore need for caution; easing bias under review for June.” (Chair Jerome Powell, 13 May 2026)
Two scenarios, and their bond market implications, are worth stress-testing:
- Scenario A: Dot plot drops the easing bias, median dots shift to zero cuts. The 10-year yield tests Yardeni’s 4.60% target. Duration pressure intensifies. Credit and TIPS outperform long Treasuries. Evercore ISI’s 30% hike probability remains live.
- Scenario B: Transitory narrative holds, June CPI softens. Short-end yields retrace. The two-cut consensus re-establishes. Duration exposure becomes less penalising, though the structural inflation question remains unresolved.
CME FedWatch currently prices June at 72% hold, 23% cut, and 5% hike. The gap between the hold probability and the dot plot expectations suggests the market is waiting for the Fed to confirm what yields are already signalling.
For bond investors, higher-for-longer is no longer a forecast
Yardeni’s none-and-done call has moved from outlier to near-consensus in a single week, validated by synchronised PPI, CPI, and services data that the transitory camp has not yet convincingly explained away. The structural inflation argument, five years above target, AI-driven capital expenditure, and a labour market too resilient for easing, means investors should treat higher-for-longer as the operating environment, not a tail risk to hedge against.
The positioning implications are specific: shorter duration in the 3-5 year range, overweight TIPS and investment-grade credit, and any yield dip toward 4.40% on the 10-year treated as a repositioning opportunity rather than a signal that the easing cycle is resuming. The transitory versus structural debate will be resolved by data in the next four to six weeks. The June CPI and the FOMC dot plot are the decision points. Investors who have already adjusted duration are better positioned regardless of which side prevails.
For investors who want to extend the duration and credit repositioning logic into broader portfolio construction, our dedicated guide to positioning ahead of a market correction examines how the Buffett Indicator, the Shiller P/E, and the current inversion of the earnings yield versus 10-year Treasuries collectively support a defensive allocation framework that complements the shorter-duration bond positioning major managers are already implementing.
This article is for informational purposes only and should not be considered financial advice. Investors should conduct their own research and consult with financial professionals before making investment decisions. Past performance does not guarantee future results. Financial projections are subject to market conditions and various risk factors.
—