Markets are close to certain about a Fed December rate hike. CME FedWatch put the odds at almost 99% on 10 November 2026. Traders are also pricing roughly 50 basis points of further tightening in 2026, about 50bp more than the Fed’s own projections. A basis point is one hundredth of a percentage point.
The December move has plenty of support. The question is whether the second layer, the 2026 path, rests on evidence or on extrapolation.
October’s consumer price index (CPI) came in hot. Headline prices rose 0.4% for the month against 0.3% expected, and core prices (excluding food and energy) rose 0.3% against 0.2%. The Bureau of Labor Statistics (BLS) could not publish annual rates, because October 2025 data was never collected during last year’s government shutdown. You have lost your usual yardstick.
That gap matters if your portfolio is sensitive to interest rates. Here is a four-test framework for judging whether rate pricing has run too far ahead of the data, applied to the numbers released yesterday.
What does the hot CPI print say when the annual comparison is missing?
Start with what is not there. Normally the first number investors check is the year-on-year inflation rate. This month it does not exist.
The missing yardstick BLS did not collect October 2025 CPI survey data during the 2025 lapse in appropriations, so it could not calculate October 2026 12-month changes. The data cannot be gathered retroactively.
Without an annual figure, the next best lens is the shorter-horizon pace. Annualised means taking a three-month or six-month change and scaling it up to show what a full year at that speed would look like. The original source’s analysis of BLS data produces these readings:
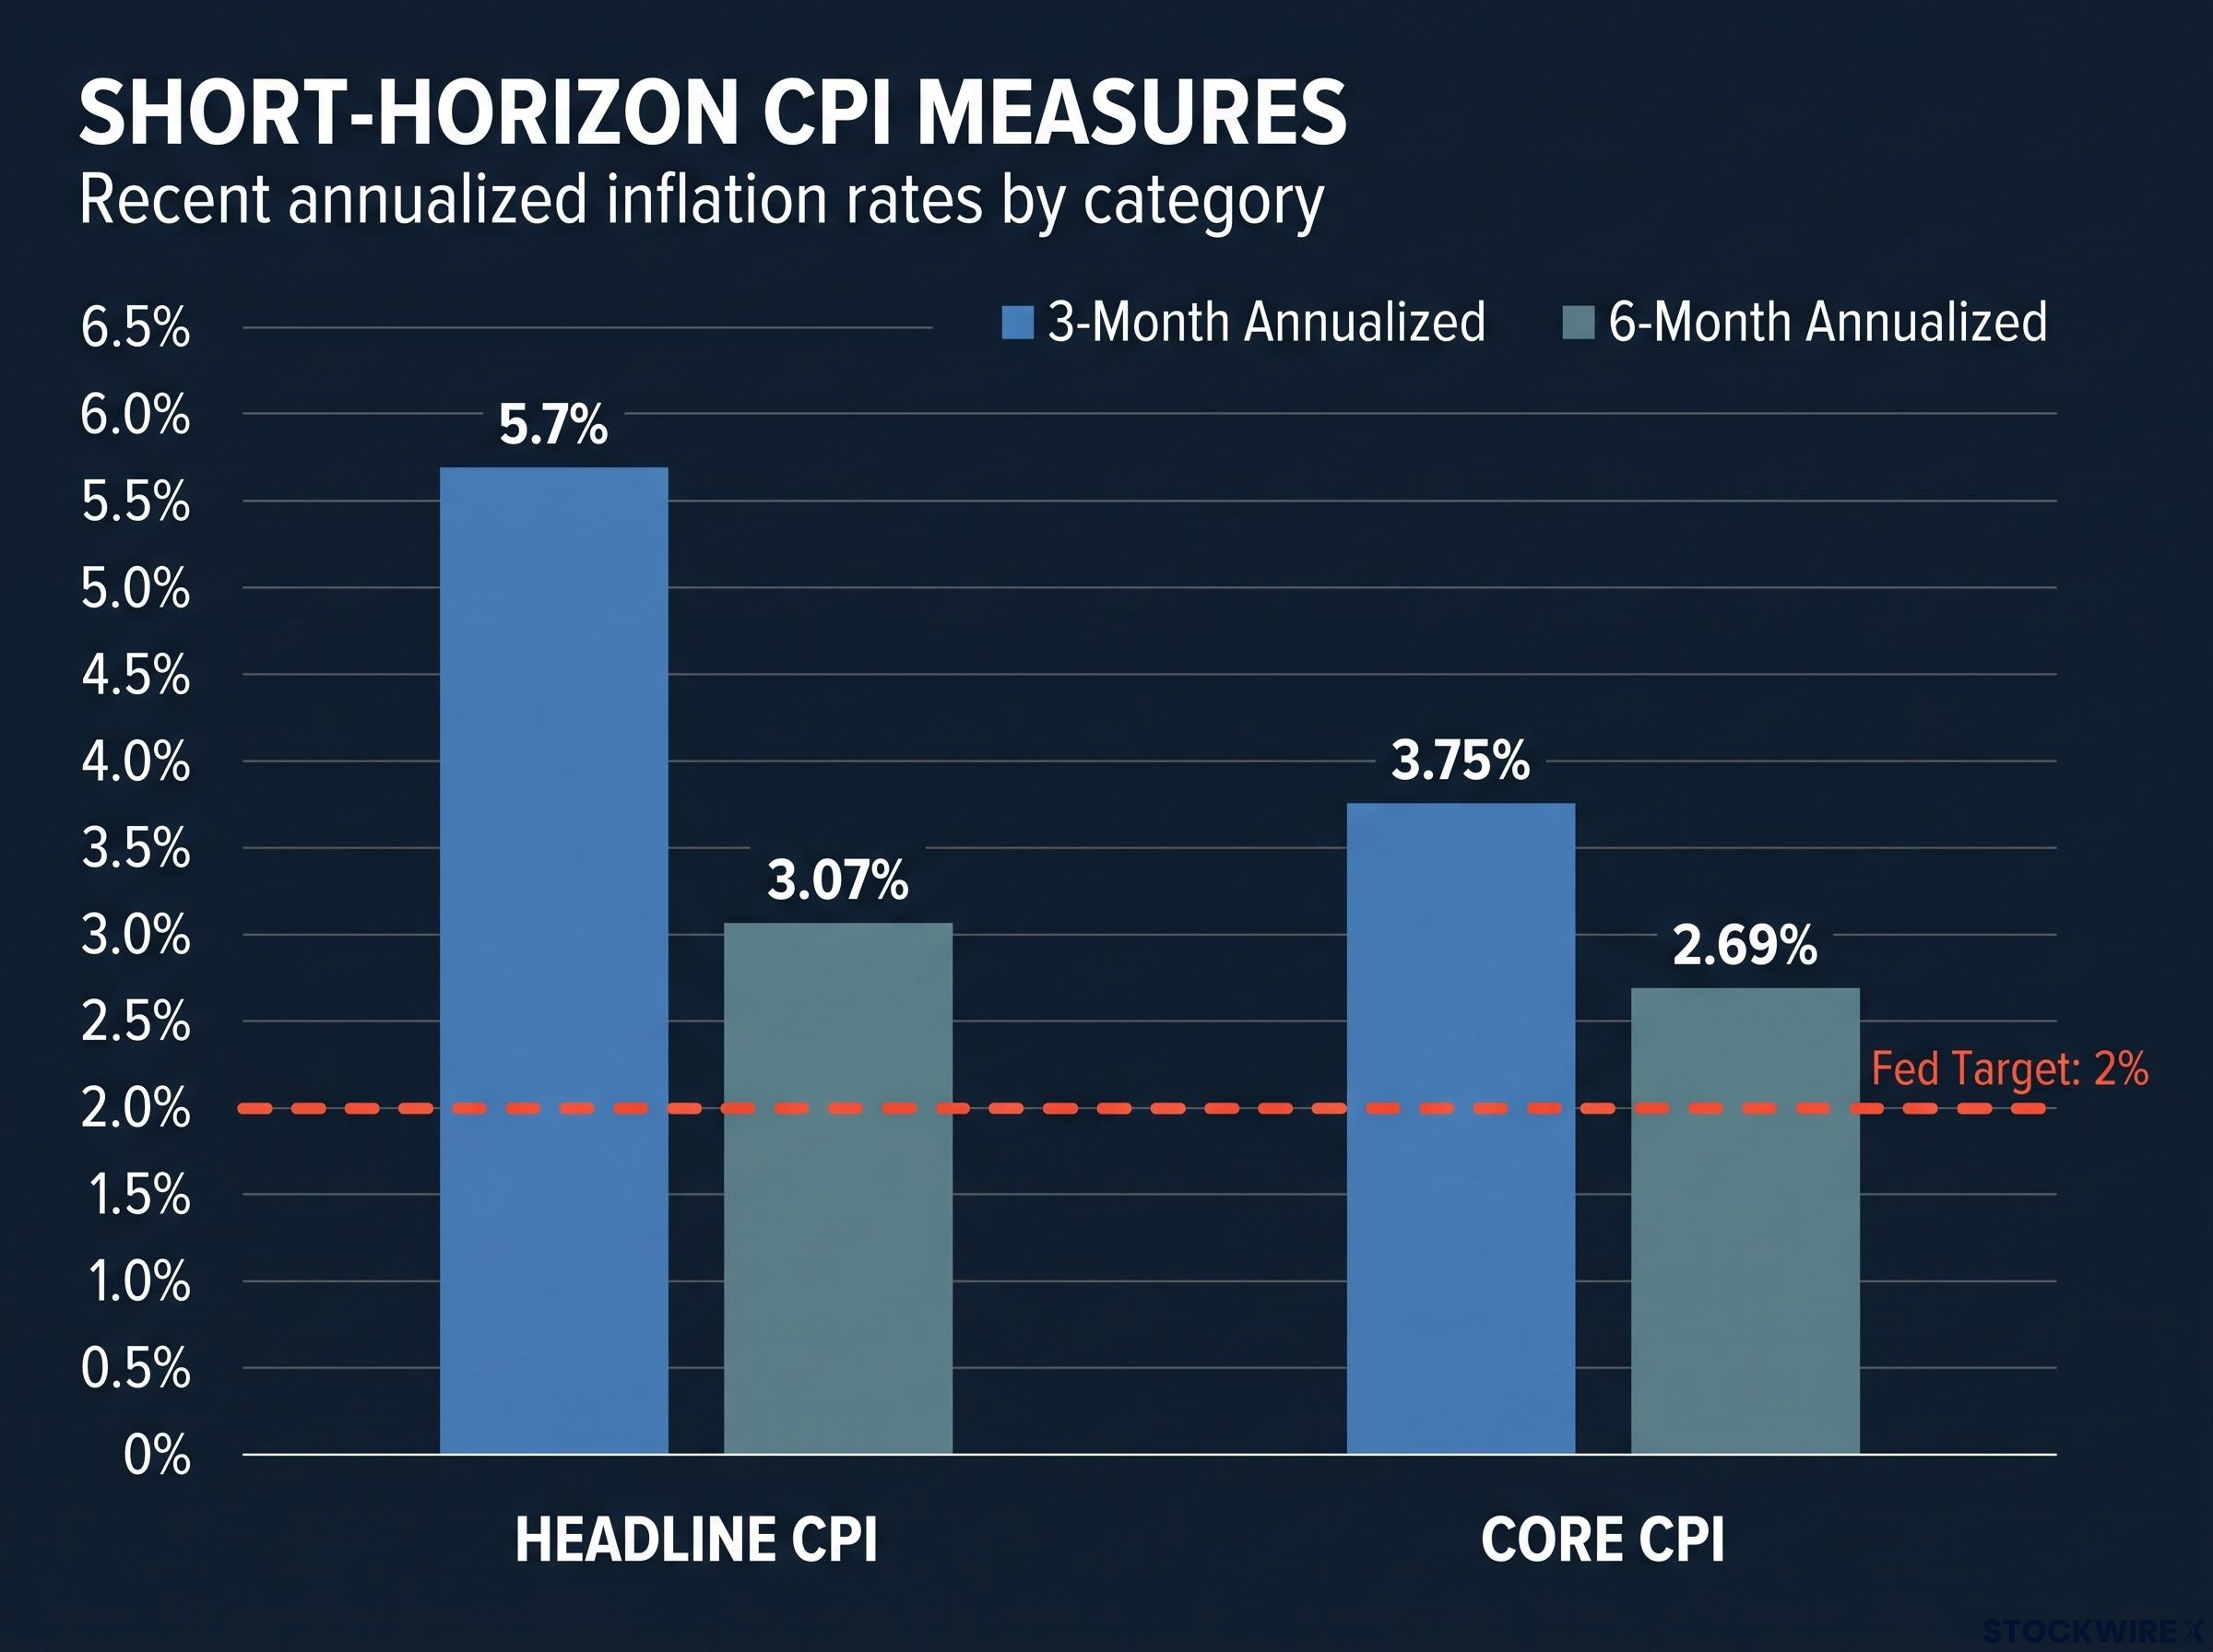
Every short-horizon measure of Headline and Core CPI sits above the Fed Target of 2%.
| Measure | 3-month annualised | 6-month annualised |
|---|---|---|
| Headline CPI | 5.7% | 3.07% |
| Core CPI | 3.75% | 2.69% |
Every figure sits above the Fed’s 2% target. The headline three-month pace also jumped sharply between the July-August and September-October windows.
The detail cuts both ways. Headline inflation eased from September’s 0.6%, but core printed 0.3% for a third straight month. Services excluding energy, food and shelter cooled in October after a September spike, yet that measure has been building since June. Goods prices dipped slightly.
What this tells you is that the data gap is not hiding a benign picture. Every short-horizon measure is above target. Without annual data, though, nobody can say with confidence how much of it is one-off noise and how much will stick.
Core inflation trends looked far calmer only two months earlier, when core CPI hit a five-year low and market-based breakevens signalled little fear of a sustained resurgence, a useful baseline for judging how much has changed.
When big ASX news breaks, our subscribers know first
How do war-driven cost shocks travel from goods into services?
On screen, the split looks simple: goods flat, services sticky. The original source argues that this is the expected order of events. Disruptions to energy, fertiliser and plastics linked to the Strait of Hormuz closure and the US-Iran war hit goods first and reach services later.
The energy supply shock first surfaced in the May inflation data, when gasoline surged more than 40% annually while core held near 2.9%, a split that framed the headline-versus-core debate the Fed still faces.
The transmission usually runs in five steps:
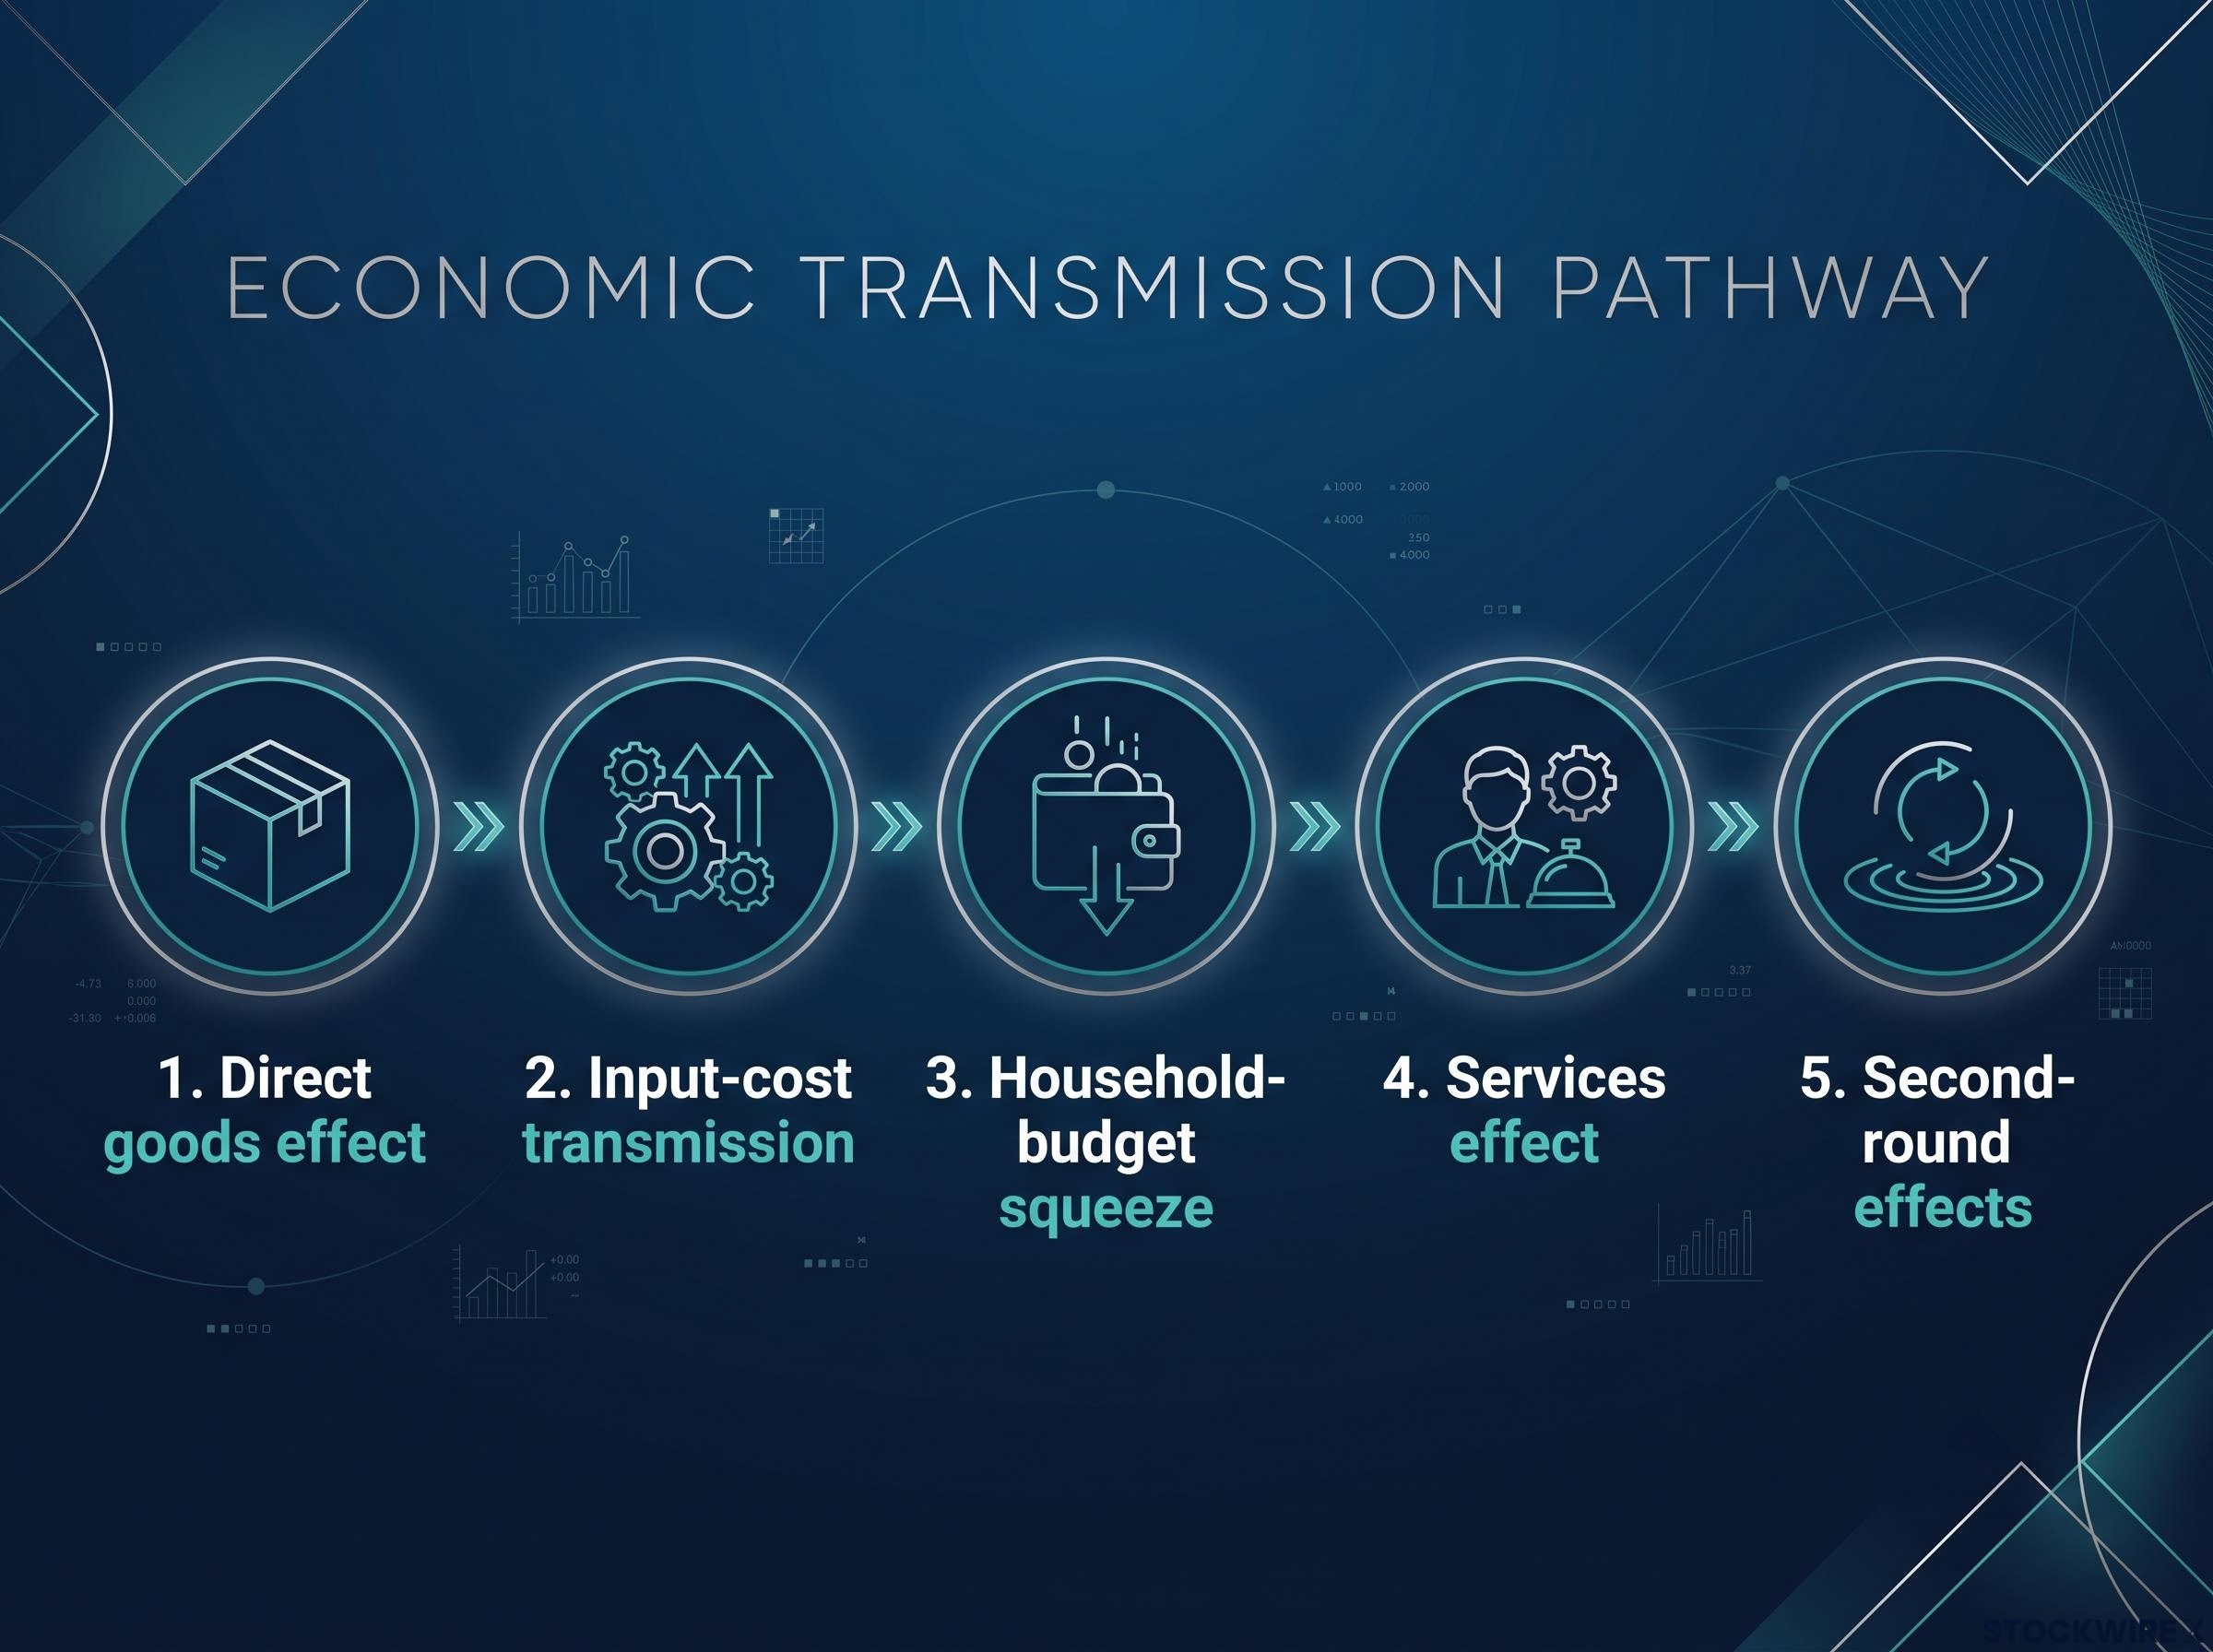
The transmission of war-driven cost shocks from goods into services usually runs in 5 steps.
- Direct goods effect: pricier oil, diesel, shipping and inputs lift prices for fuel, transport, chemicals and manufactured goods.
- Input-cost transmission: higher logistics, electricity and materials costs move through supply chains.
- Household-budget squeeze: dearer petrol, utilities and goods reduce real purchasing power.
- Services effect: labour, transport, rent and maintenance costs are passed into services prices.
- Second-round effects: if households and firms expect inflation to continue, wage and price setting can make the shock persist.
The lag explains why a soft goods number does not end the story. Fed research on oil pass-through, published in December 2023, found statistically significant direct and second-round effects on food and core prices, but with long lags.
The Fed views tariffs and the oil shock as transitory. Its experience after COVID has made it wary of how hard sticky inflation is to reverse. Joseph Brusuelas of RSM described the current picture as “stubborn and sticky inflation,” especially in services. Richmond Fed President Tom Barkin urged policymakers to move “with care” and to separate persistent inflation from temporary cost shocks.
What history suggests about persistence
Fed staff research from 2026 found strong pass-through from energy to core prices in the 1970s and early 1980s, when it fed a broader inflation regime. Since then, the evidence for permanent core effects has been weaker and less consistent.
The 2021-22 episode sits in between. Supply-chain constraints created a durable-goods shock, then energy rose alongside strong demand and the Ukraine war, and pass-through to food and core was meaningful but delayed.
The deciding factor is not the size of the headline number. It is whether wages and expectations reinforce the shock. Those are what you should watch next.
Why would a hike be priced when Q3 growth rests on narrow drivers?
The headline supports a strong-economy story. The Bureau of Economic Analysis (BEA) advance estimate, released on 29 October 2026, showed real GDP growing at a 3.4% annual rate. Real final sales to private domestic purchasers rose 4.9%.
Look underneath and the foundation narrows.
| Q3 2026 component | Figure |
|---|---|
| Real GDP | +3.4% annual rate |
| Real final sales to private domestic purchasers | +4.9% |
| Imports | +19.7% |
| Nonresidential fixed investment | +12.7% (1.8pp contribution, per Treasury) |
| Change in private inventories | -0.5 billion chained 2017 dollars |
The 1.8 percentage point investment contribution comes from Treasury’s 2 November statement. The original source’s analysis adds a striking comparison.
Small sector, big contribution Nonresidential investment makes up roughly 14% of the economy and household consumption roughly 68%, yet investment contributed more to Q3 growth than consumer spending.
According to the original source, consumption added about 2.5 points to growth while imports, made costlier by tariffs and the war, subtracted 2.6 points. That leaves investment and inventories doing the heavy lifting. The 2.5 point figure appears only in that source; the exact consumption contribution was not otherwise available.
Torsten Slok of Apollo has warned that a reversal in AI investment could weaken capital spending while oil, tariffs and immigration restrictions keep pushing inflation up. That combination is stagflation: slow growth with high inflation. The original source also notes the GDP data may be stale, which makes markets wary of pricing aggressive hikes on a hot-economy story alone.
The read you should take is that a rate path justified by strong growth is only as sound as the growth beneath it. Narrow GDP is a bigger reason to question the 2026 hikes than the December one.
How did markets react, and is the 2026 path overpriced?
What the cross-asset moves signalled
| Market | Move on 10 November | Level |
|---|---|---|
| S&P 500 | -0.38% | 7,521.48 |
| Nasdaq Composite | -0.74% | 25,067.23 |
| 2-year Treasury yield | +18.44bp | about 4.731% |
| 10-year Treasury yield | +12.55bp | about 4.988% |
| Gold | -2.62% | about US$4,030.56 |
| Dollar index | +0.56% | about 102.25 |
| Euro | -0.54% | about US$1.1162 |
| Australian dollar | -0.9% | Not available |
Silver held near US$51 within its four-day range, according to the original source, though no reliable closing move was available.
Was this a hawkish repricing or a muted reaction? Both labels fit. Equities slipped modestly and held key levels, while the 2-year yield jumped far more than the 10-year. That pattern points to a faster near-term Fed rather than stronger long-run growth.
With the Fed having dropped forward guidance, inflation prints rather than central bank signals now steer rate expectations, which is part of why a single hot CPI report can reprice the whole 2026 path so quickly.
Four tests for overpricing
- Market path vs. Fed projections: pricing sits about 50bp above the Fed’s own path, so it needs fresh surprises to justify it. Verdict: stretched.
- Front-end vs. long-end: the 2-year rose far more than the 10-year. Verdict: markets expect aggressive near-term tightening, not a lasting boom.
- Core breadth and persistence: three straight 0.3% core prints and building services inflation. Verdict: supports December, not yet proof of spreading.
- Growth resilience: Q3 leaned on investment, inventories and an import offset. Verdict: weak support for a long hiking sequence.
The graded verdict follows. A December hike is well supported. All 101 economists in a Reuters poll expect a 25bp move to 4.00%-4.25%. Fed Governor Christopher Waller said 50bp should be considered if core rose 0.3% or more, which it did, while Deutsche Bank said a larger move could not be ruled out but was not its base case.
Beyond December, markets price a follow-on hike by March and a further one nearly fully by July-September 2026. That sequence remains unproven.
The risks run both ways. Pricing could prove too low if services, wages and expectations broaden. It could prove too high if markets are extrapolating a geopolitical energy shock into permanent inflation while growth weakens. For your portfolio, that means the December step is reasonable to hold, while the extra 2026 hikes need confirming evidence before they deserve trust.
This article is for informational purposes only and should not be considered financial advice. Investors should conduct their own research and consult with financial professionals before making investment decisions. Past performance does not guarantee future results. Financial projections are subject to market conditions and various risk factors.
What to watch before the next Fed decision
The evidence sorts into three tiers. A 25bp December hike rests on firm ground. A 50bp move is a credible tail risk. Further 2026 hikes depend on proof that inflation is spreading, and that proof has not arrived.
Three items will decide which way the 2026 pricing breaks:
- Services inflation excluding shelter: the clearest early sign of second-round effects.
- The next BLS and BEA releases: including GDP revisions that could confirm or erode the Q3 story.
- Upcoming FOMC communications and projections: a new dot plot would show whether the Fed is closing the 50bp gap with markets.
When the next CPI print lands, skip the headline reaction. Run it through the four tests instead: path against projections, front end against long end, core breadth, and growth quality. That checklist will tell you more about where rates are heading than any single monthly number.
Long-term borrowing costs are increasingly set by supply, fiscal deficits and retreating institutional buyers rather than the Fed alone, since the central bank now holds roughly 14% of public debt, down from about 26% in 2021.