
Consumer confidence has fallen to its lowest level since 2014. The Conference Board index sits at 81.9, and the University of Michigan sentiment gauge reads 48.1. Yet markets still fully price a Federal Reserve rate hike in December, with more expected next year, and stocks are holding up on the strength of a few AI giants.
That raises an uncomfortable question about fading rate hike expectations and stocks. What if the thing that finally takes those hikes off the table is not good news at all?
Most investors treat a less hawkish Fed as a green light for equities. That only holds if hike pricing fades because inflation is cooling. If it fades because the economy is weakening, the same move can signal falling earnings. The reason matters more than the direction.
Here is a way to tell which kind of fading you are looking at, and what each one means for your portfolio. The first real test arrives next week, when the Consumer Price Index (CPI) and Producer Price Index (PPI) for September are released.
Why are weak consumers and a hawkish Fed moving in opposite directions?
On the surface, it looks like a contradiction. Households are miserable, and the Fed is still leaning towards tighter policy.
The contradiction dissolves once you separate three things that often get lumped together: how people feel, how they spend, and how fast prices are rising. The Fed does not set rates on mood. It responds to inflation and demand.
| Indicator | Latest reading | What it signals |
|---|---|---|
| Michigan sentiment (September final) | 48.1 (from 51.7 in August) | Household mood near record lows |
| Conference Board confidence (September) | 81.9 | Lowest since 2014; expectations weak at 63.6 |
| Headline PCE (August, year on year) | 3.4% | Still well above the 2% target |
| Core PCE (August, year on year) | 3.0% | Underlying inflation still too high for comfort |
| Three-month annualised PCE | At 2% | Recent trend already back at target |
Sentiment is not spending
Michigan’s September sub-indices tell the story: Current Conditions at 50.9 and Expectations at 46.3. The Conference Board’s Present Situation reading of 109.3 sits far above its Expectations figure of 63.6, which suggests people feel worse about the future than about today.
According to the Conference Board, the gloom is being driven by rising fuel prices, higher borrowing costs and hiring anxiety. None of those is a spending collapse. USA Today reported that spending has held up better than the surveys imply, which is why many economists discount sentiment as a forecasting tool.
The surveys also swing hard. Michigan hit a record low of 44.8 in May, bounced to 49.5 in June, then slid back to 48.1 in September.
Inflation is falling, but not fast enough
The official Bureau of Economic Analysis (BEA) figures for August show personal consumption expenditures (PCE) inflation, the Fed’s preferred price gauge, at 3.4% headline and 3.0% core, which strips out food and energy. August CPI ran at 3.4% headline and 2.4% core.
Shorter windows look kinder. Three-month annualised PCE, which takes the last three months of price changes and scales them to a yearly rate, is already at 2%. But the Fed’s September projections still show headline PCE at 3.7% for 2026, easing to 2.3% in 2027 and 2.0% over the longer run.
That gap explains the pricing. Markets see an 82% chance of no move in October, a fully priced December hike, and roughly 50 basis points of difference between market and Fed expectations for next year. If you are waiting for gloomy surveys to force the Fed into retreat, you are betting on a lever the Fed does not pull.
Even when the Fed does pivot, long and variable lags mean its policy changes can take well over a year to reach the real economy, so you should not expect a quick payoff from any shift in hike pricing.
When big ASX news breaks, our subscribers know first
Can AI investment carry the market if consumers cannot?
If households are wobbling, something else has to hold up growth and stock prices. The obvious candidate is the AI buildout. The arithmetic, though, is lopsided.
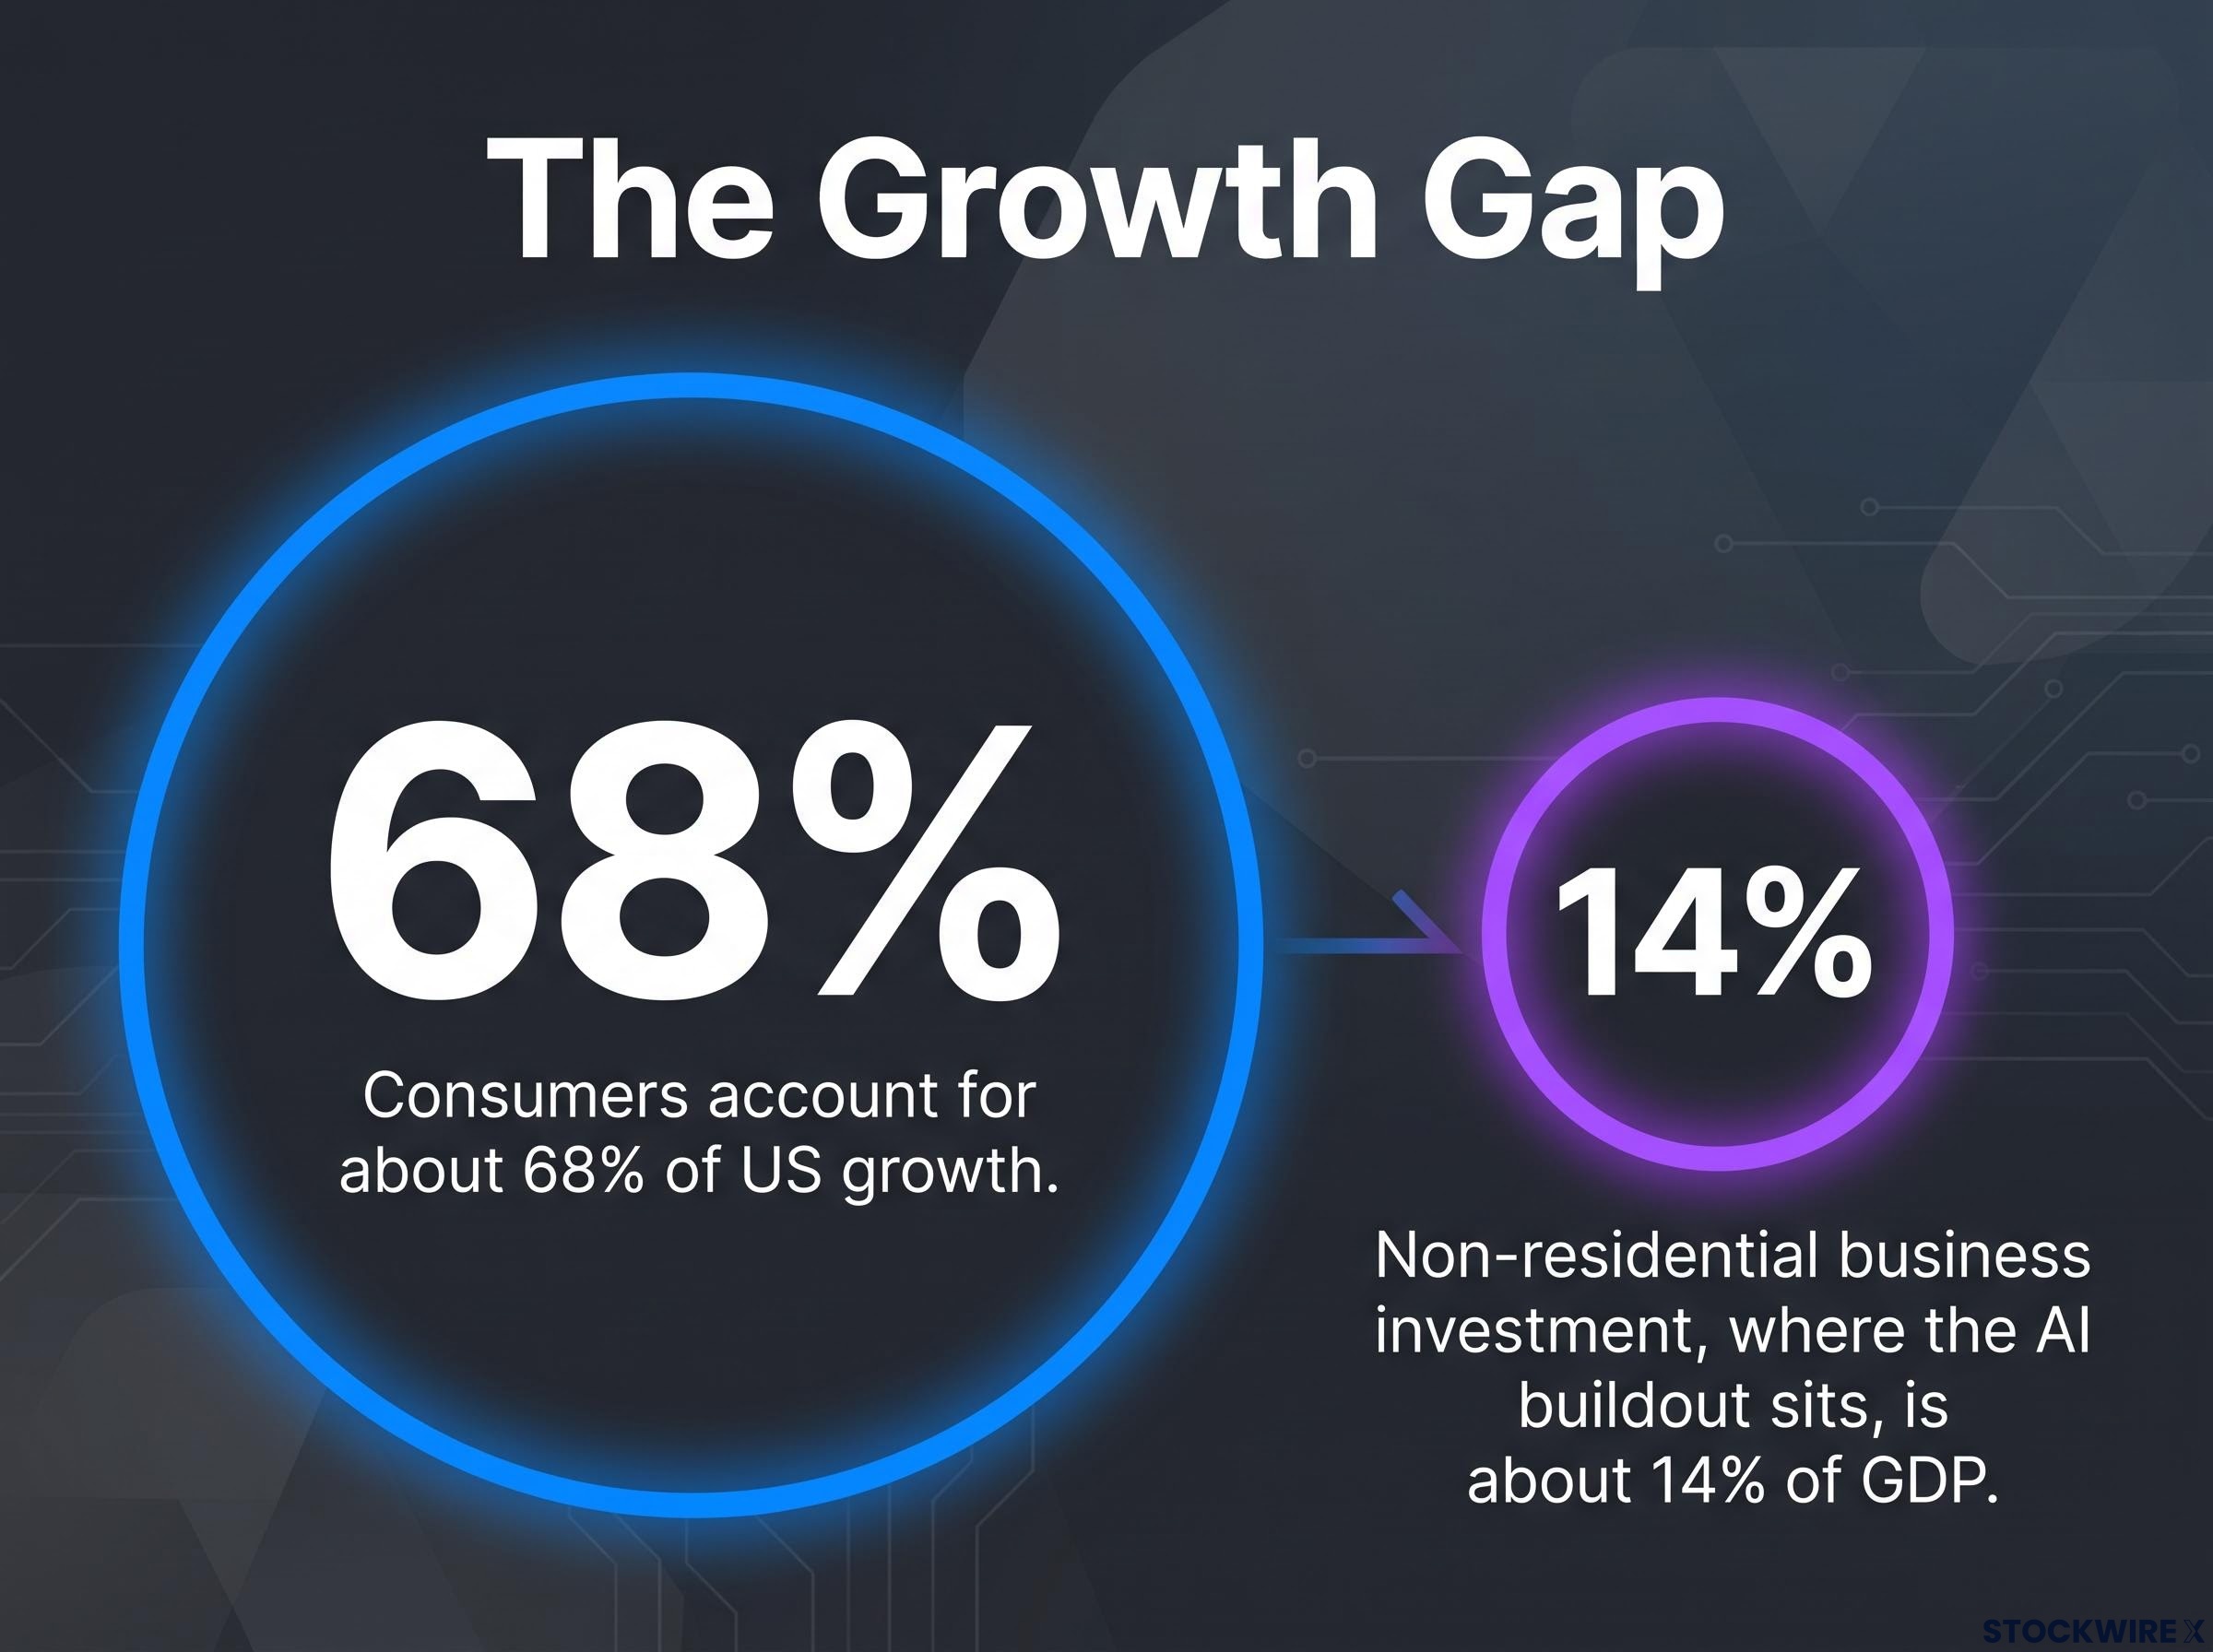
The growth gap Consumers account for about 68% of US growth. Non-residential business investment, where the AI buildout sits, is about 14% of GDP.
For AI spending to offset a consumer pullback, a sector roughly one-fifth the size of household demand would need to grow very quickly. That is the central open question right now, and some market commentators argue investors may have over-extrapolated the AI story.
The stock market hides this tension well, because the headline index is dominated by a small group of companies.
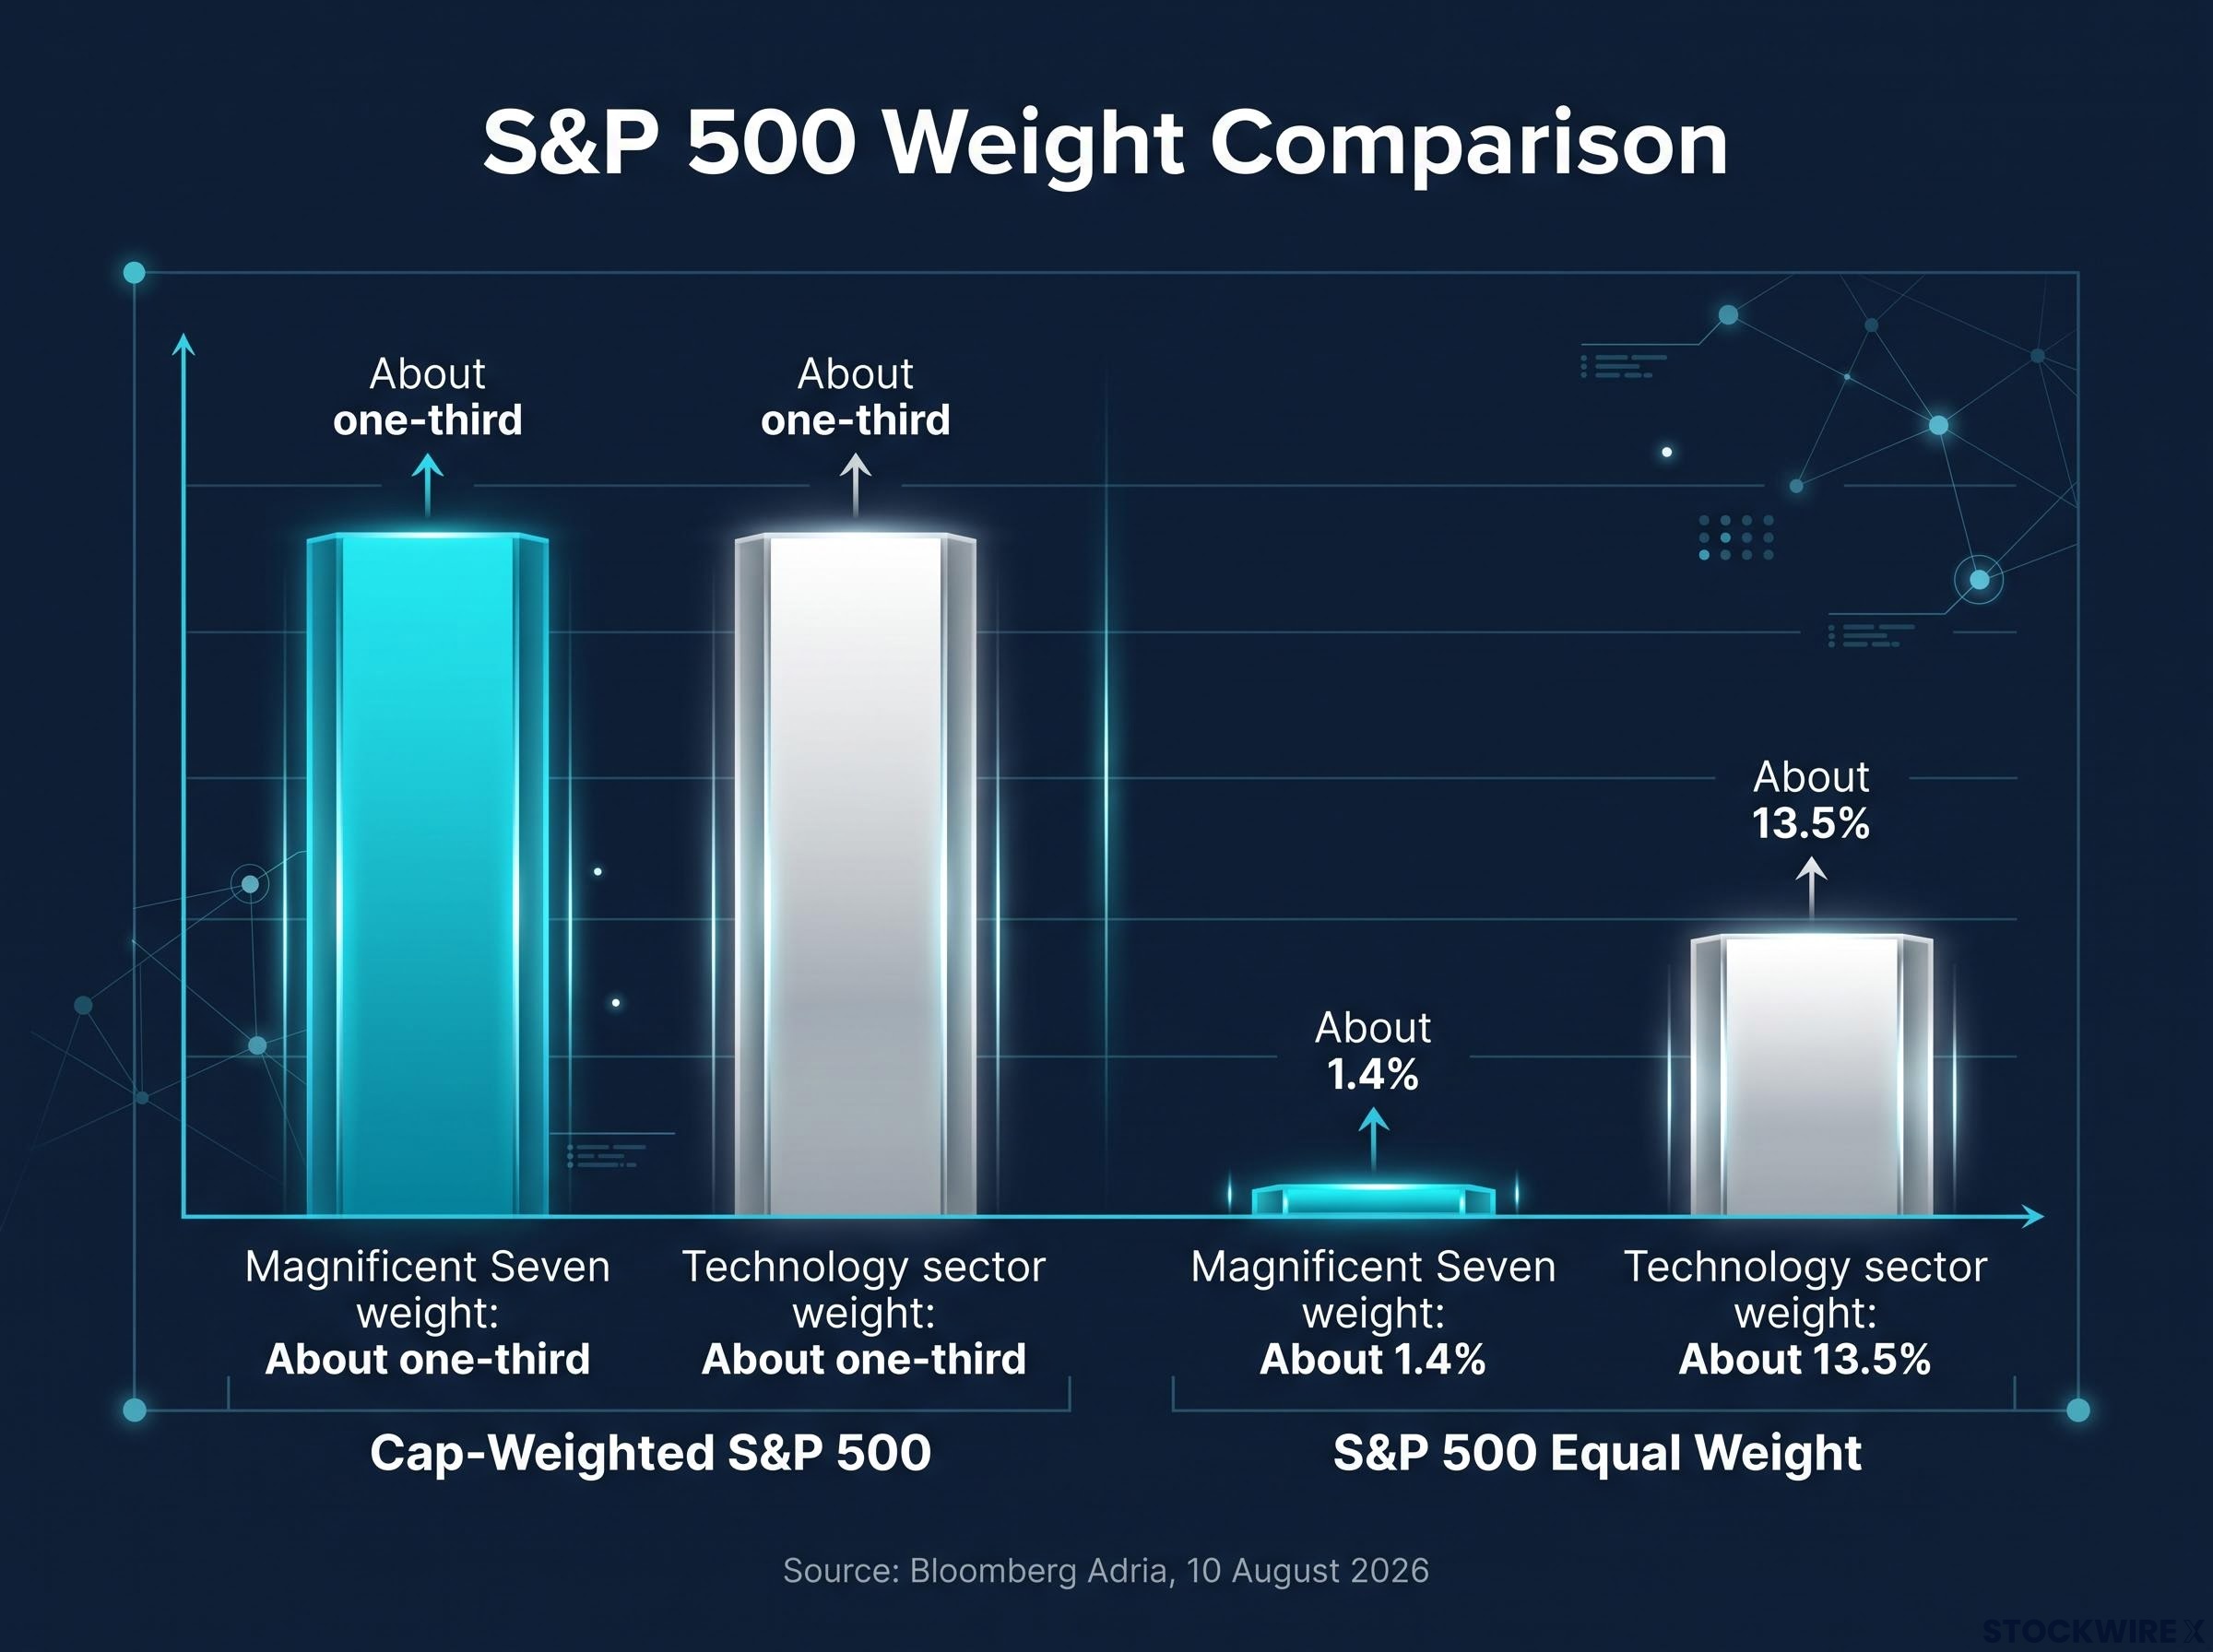
| Measure | Cap-weighted S&P 500 | S&P 500 Equal Weight |
|---|---|---|
| Magnificent Seven weight | About one-third | About 1.4% |
| Technology sector weight | About one-third | About 13.5% |
Those figures, reported by Bloomberg Adria on 10 August 2026, show how differently the two indexes are built. A cap-weighted index gives the biggest companies the most influence. An equal-weight index gives every company the same slice.
Since mid-August, the equal-weight S&P 500 (RSP) and the S&P 500 excluding technology (SPXT) have tracked the small-cap Russell index lower as short-term Treasury yields rose. In other words, tech has been doing the heavy lifting for the headline number.
Record market concentration means a headline index near highs can mask weakness elsewhere, and a handful of AI-heavy companies are doing most of the lifting for the number you see quoted.
The economic data is not sounding an alarm yet. The Atlanta Fed’s GDPNow model, a running estimate of quarterly growth, put Q3 at 3.6% as of 8 October, down from 3.7%. That estimate is early, and the tracker’s own users caution against leaning on the level this far out.
So when you see the S&P 500 near highs, remember what it is mostly describing: a handful of AI-heavy companies. If your portfolio leans towards cyclicals, small caps or equal-weight funds, your experience may look very different from the headline.
How do fading hike expectations affect stocks, and why does the reason matter?
The instinct most investors have is sound as far as it goes. Fewer rate hikes should be good for shares.
Here is why. A share price reflects the profits you expect a company to earn in future, converted into today’s dollars. The rate used for that conversion is called a discount rate, and it rises when expected interest rates rise. A higher discount rate shrinks the present value of future earnings, so share prices fall.
Long-duration stocks feel this most. These are companies whose profits are expected far into the future, such as fast-growing tech and AI names.
The relief-rally case
When August PCE came in at 3.4% headline and 3.0% core, CNBC and Yahoo Finance framed it as weakening the case for another hike. That is the good version of fading expectations.
If inflation keeps cooling, pressure on discount rates eases, and the high valuations of growth and AI stocks become easier to justify. Markets currently price a December hike, then another in March and one more in the second half, possibly June.
The growth-scare case
Now take the same move with a different cause. If hike pricing fades because weak confidence and slowing growth are eroding the 2027 outlook, the lower rate path comes bundled with lower earnings.
That is a growth scare, and it can hurt stocks even as yields fall. Cyclicals and small caps would likely take the first hit, and the equal-weight and Russell indexes are already lagging. If AI investment slows at the same time, the concentrated tech leaders lose the one support that has been holding the index up.
| Scenario | Trigger | Likely market reaction | Most exposed areas |
|---|---|---|---|
| Inflation-driven fade | Core inflation keeps cooling towards target | Relief rally as discount-rate pressure eases | Beneficiaries: long-duration growth and AI stocks |
| Growth-driven fade | Weak confidence and slowing growth cut the 2027 outlook | Growth scare driven by earnings risk | Cyclicals and small caps; concentrated tech if AI capex slows |
Bank forecasts reflect the same split. PNC has reportedly set a baseline of quarter-point hikes in September, December and March, though that view has not been independently confirmed. U.S. Bank reportedly expects an extended pause, with core PCE easing to about 2.1% by end-2027 and a “bumpy” final stretch, also unconfirmed.
One sees sticky inflation, the other gradual relief. Before you treat any shift in hike pricing as bullish or bearish, ask why it is happening, because the cause decides whether it supports or undermines what you own.
Forecasts are subject to market conditions and various risk factors. Past performance does not guarantee future results.
What could change the picture: CPI, PPI and the risks to this view?
Next week’s inflation data is the first real check on which story is winning.
The Cleveland Fed’s nowcast, a model-based estimate of upcoming data, gives you a benchmark. As of 8 October, it projects September headline CPI at 0.53% month on month and 3.60% year on year, with core at 0.20% and 2.39%. Compare that with August: headline up 0.4% for the month and 3.4% for the year, core up 0.3% and 2.4%.
The same model puts September PCE at 3.56% headline and 3.02% core year on year. Core is the reading to watch. A soft core print supports the inflation-cooling story, while a hot one would quickly revive hike pricing.
The BLS CPI data publishes the monthly and annual changes for all urban consumers, so when September’s figures arrive you can compare the core reading directly against the nowcast and August’s 2.4% pace.
No PPI reading or consensus was available at the time of writing. Treat it as a check on pipeline pressure, meaning price increases that businesses pay before they reach consumers.
- September core CPI: does it land near the nowcast’s 0.20% monthly pace, or above it?
- PPI: do producer prices hint at fresh cost pressure further down the line?
- Michigan sentiment: the next reading is expected at 47.6 against 48.1 prior, which would be the second-lowest on record after 44.8.
- December hike pricing: does it stay fully priced, or start to slip, and for which reason?
The argument has limits, and you should hold them alongside it:
- Inflation could reaccelerate. August’s 0.4% monthly CPI rise and a projected 0.53% for September point to stickiness.
- Surveys are noisy. Gasoline prices, politics and headlines move sentiment without moving spending.
- AI investment could slow. With seven stocks at about a third of the index, any cooling would hit the headline hard.
- Early growth estimates are unreliable. GDPNow’s 3.6% may shift materially as more data arrives.
These statements are speculative and subject to change based on market developments. The next releases test your assumptions; they do not confirm them.
Reading the signals without overcommitting to one story
Weak consumers, above-target inflation and a narrow, AI-led market can sit side by side for a while, but not indefinitely. Something has to give, and the reason hike expectations fade will shape how your portfolio responds.
The diagnostic is simple. Fading because inflation is cooling tends to help stocks, especially growth names. Fading because growth is weakening, with AI support starting to wobble, tends to hurt, and the damage may spread well beyond the tech leaders.
Two practical steps follow. Check how concentrated your own holdings are compared with the headline index you track. Then watch core inflation and confidence together rather than reacting to either alone. Next week’s CPI and PPI releases are the place to start.
This article is for informational purposes only and should not be considered financial advice. Investors should conduct their own research and consult with financial professionals before making investment decisions.