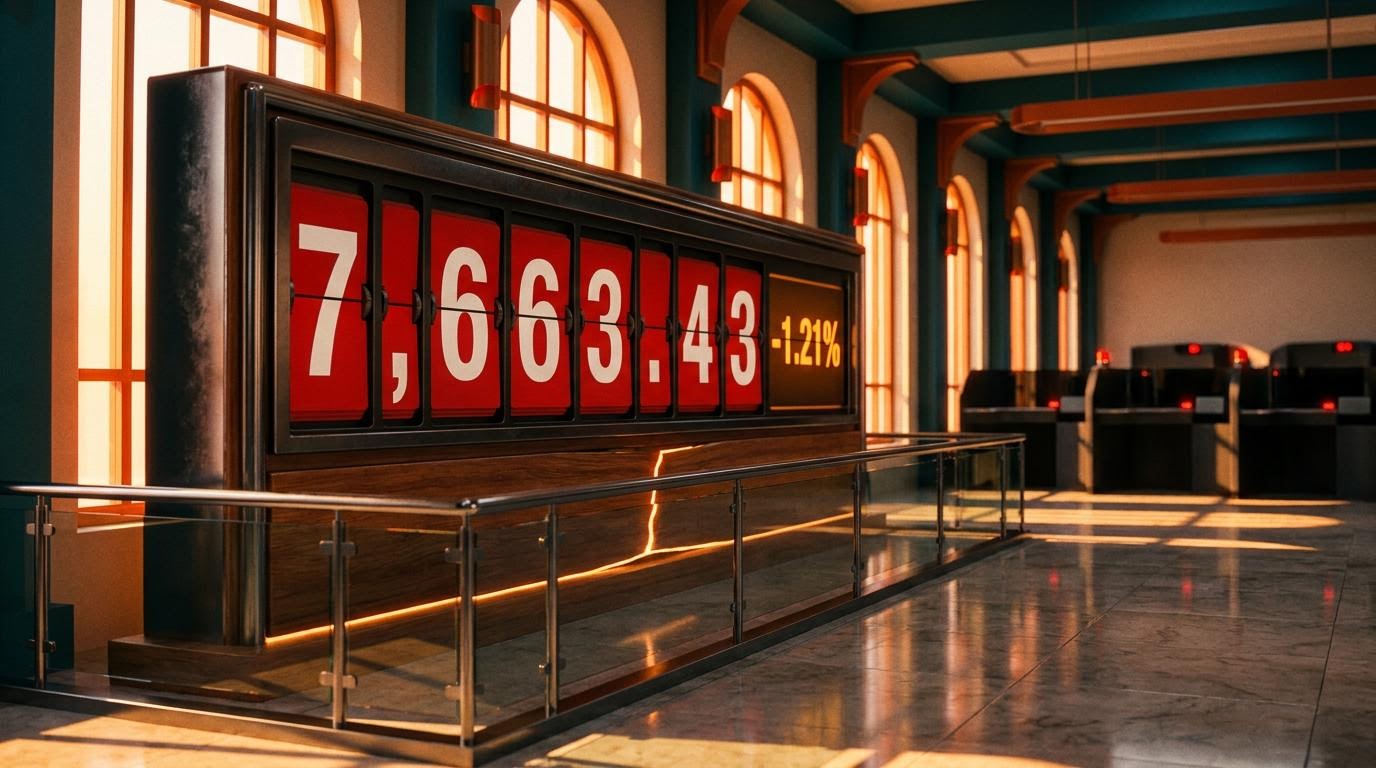
The S&P 500 fell 1.21% on 22 October 2026 while the Russell 2000 edged up 0.11%. A rotation into small caps can look like reassurance that equity rally support is broadening. The data underneath says otherwise.
On the same day, Meta dropped about 6.98% after its earnings and semiconductors slid hard. The 10-year Treasury yield sits near 4.95% after trading above 5%.
Headline index moves can hide that kind of strain. The options market and the bond market are both flashing caution, and reading the index alone can leave you exposed to a drawdown you did not see coming.
Here is a way to read the options tape and the bond market together, and to tell a genuine signal from noise.
Why did strong revenue not hold the market up?
The earnings trigger
Meta grew Q3 revenue 26% year on year to $64.6 billion, and its shares still fell nearly 7%.
The cost of that growth explains the drop. Operating profit fell 37%, partly because of a $9.89 billion legal charge, and GAAP earnings per share of $3.83 missed expectations. Capex guidance of $135-145 billion puts capital spending above operating cash flow. The stock gave up an early after-hours gain once attention shifted to Meta’s plan to issue stock.
Tesla slipped about 3.08% after net income fell 43% to $787 million and operating margin narrowed to 2.6% from 5.8%.
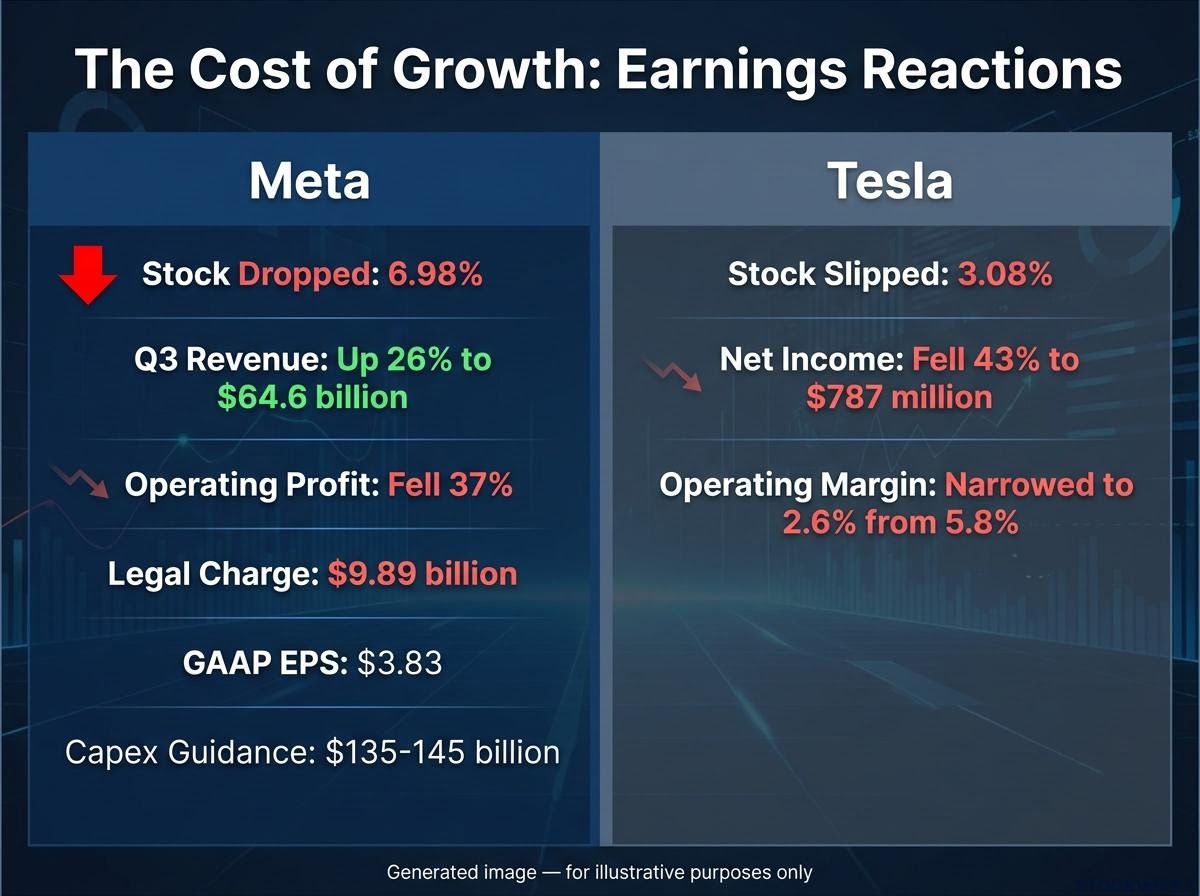
The question has moved from “is demand there?” to “what does the spending return?” When a stock falls on solid growth, the market is repricing what that growth costs. Good headlines alone will no longer carry the rally.
The technical breaks
| Measure | Level | Context |
|---|---|---|
| S&P 500 | 7,663.43 | Down 1.21% on 22 October |
| VIX | 19.03 | Up 14.09%; briefly above 22 earlier in the week |
| Russell 2000 | 2,784.03 | Up only 0.11% |
| US 10-year yield | 4.95%-4.96% | Down roughly 19 bp in the session |
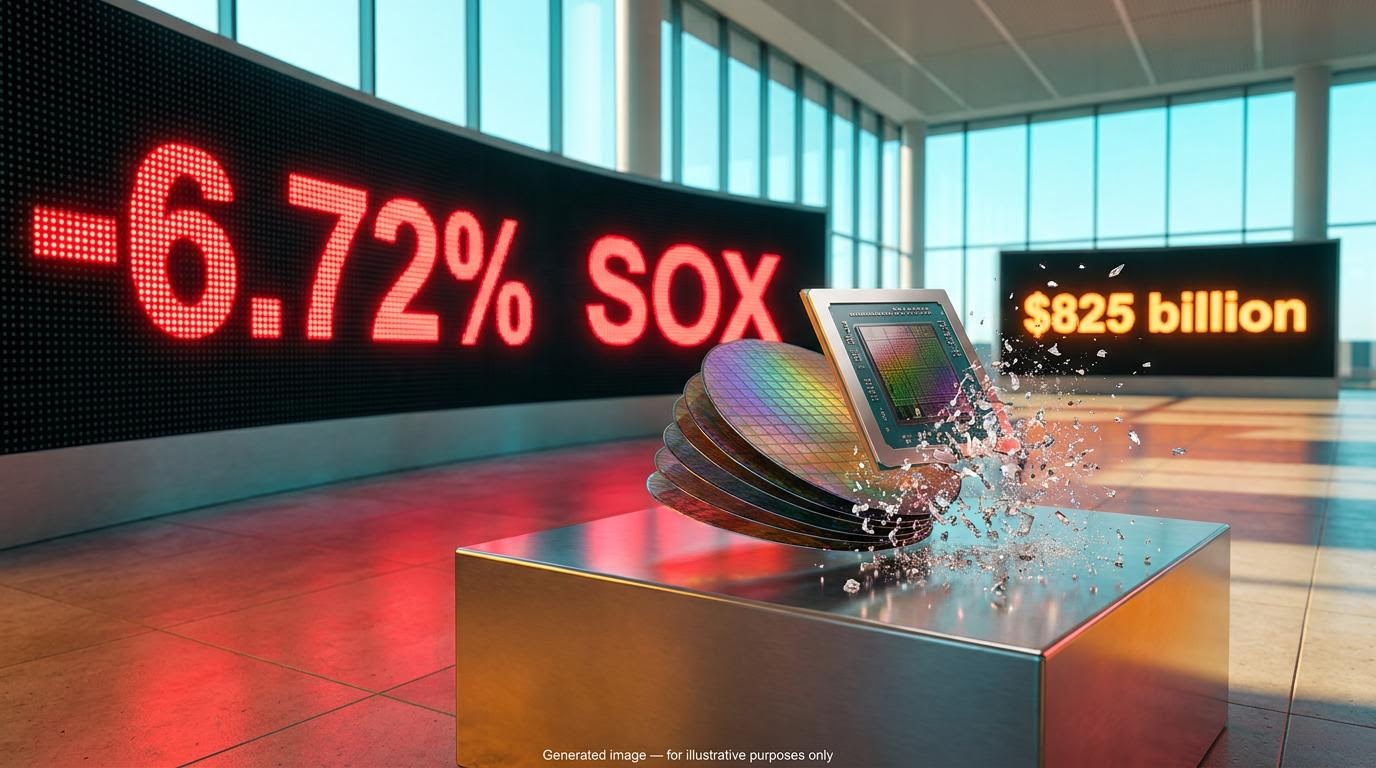
The S&P closed below the roughly 7,690 risk pivot level tracked by SpotGamma. The chip ETF SMH broke below roughly 540 support, a level it lost only briefly during an August deleveraging episode. The SOX semiconductor index was reported down 6.72% on 23 October. These breaks give the sell-off structural weight.
When big ASX news breaks, our subscribers know first
What is the options market actually saying?
Individual trades show the pattern most clearly. Puts on the MAGS megacap ETF reached about 40,000 contracts in a single week, a two-year high. In QQQ, someone bought about 110,000 30 October $700 puts for roughly $111M in premium. A put is a contract that gains value when a price falls.
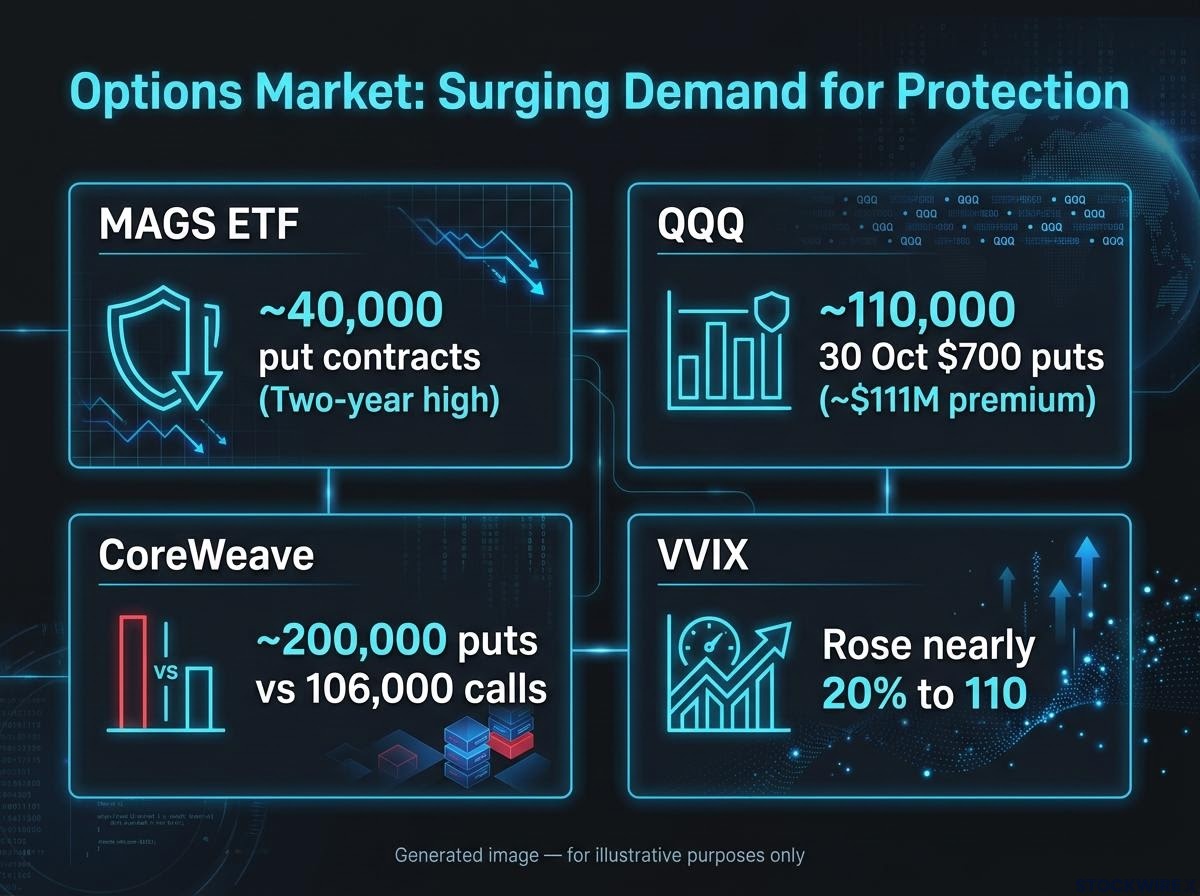
Volatility traders moved the same way. Nine of the 10 most popular VIX contracts bought were calls, worth about $27M or roughly 36% of that day’s VIX-option premium. VVIX, which measures expected volatility in the VIX itself, rose nearly 20% to 110.
The gap between the VIX and single-stock volatility helps explain why a 14% VIX jump can coexist with muted index moves, since dealer hedging and low correlation can suppress the headline gauge while stocks swing hard underneath.
| Instrument | Position | Reading |
|---|---|---|
| VIX calls | 9,200 18 Nov $20 (~$1.7M); 12,500 18 Nov $23 (~$1.1M) | Bet on volatility staying high into November |
| CoreWeave | Nearly 200,000 puts vs 106,000 calls; 26,000 18 Dec $37.50 puts (~$1.9M) | Implied volatility ~93; a $16M March call position also appeared |
| Oracle | Puts 44.88% of volume | Implied volatility ~58; unclear whether puts were bought or sold |
SpotGamma’s read: The CoreWeave puts, bought near the ask, may be a “bubble put”, either a bearish bet or a hedge on correlated Nasdaq and AI exposure.
Scott Bauer of Prosper Trading Academy called the CoreWeave puts a serious hedge rather than cheap lottery tickets. Still, no definitive record for S&P index-put volume has been confirmed, so the evidence rests on the MAGS high and the large QQQ and VIX trades.
Heavy put and VIX-call buying tells you large holders are paying for insurance. That signals worry about how big a drop could be, not certainty that one is coming.
Why does rising implied correlation matter more than breadth?
The equal-weighted S&P 500 fell less than the cap-weighted index. That looks like healthy breadth, until you check how closely stocks are moving together.
Reading correlation and skew
- Implied correlation: how closely options traders expect index components to move together.
- Skew: how much more downside puts cost than equivalent upside options.
- Put spread or fly: buying one put and selling others at lower strikes, which cuts the cost of protection but caps the payout.
Implied correlation rose 16.11% to 13.98, a 60-session high. Both the one-month and three-month readings are climbing, though earnings make the one-month figure noisy.
Saxo’s options analysts: Correlation matters more than breadth. When components move together, index volatility rises even without a collapse in the equal-weighted index.
If correlation keeps rising, a diversified basket protects you less than you think. Check how much of your portfolio shares the same AI and macro driver.
Why spreads and flies
According to SpotGamma’s Brent Kochuba, one-month SPY puts look cheap, but 25-delta skew is expensive. That favours put spreads or flies over outright puts. His target area for a fall is near 7,450 from about 7,600, a decline of roughly 5%.
Volatility in DIA and IWM is relatively cheap. IWM’s implied volatility rank sits around 17 after a roughly 10-12% decline, and rising correlation could lift it. Rich skew may also reflect the mechanical cost of insuring highly valued assets after a long rally. A cheap outright put can still be the wrong tool.
Can 5% bond yields compete with equities, and why did both fall together?
Stocks and yields fell together. Usually, falling yields cushion equities.
Bonds as the new competitor
At 5% or more, Treasuries become a credible alternative, especially to long-duration growth stocks whose valuations rest on distant cash flows. The 30-year yield reached 5.732% at points this month. The exact 23 October close has not been confirmed.
Strategists have framed the bond market threat to equities as the gating variable for portfolios, and the decoupling of rates volatility from a calm VIX is the pattern that tends to prove unstable.
| Interpretation | Driver | Supporting evidence | What would confirm it |
|---|---|---|---|
| Oil and inflation shock | Energy costs lift inflation and hurt growth | Charles Schwab links rising oil and geopolitical risk to both pressures | A tighter Fed path, as in 2022 |
| Safe haven resuming | Flight to safety and weaker growth | Treasuries rallied as AI shares fell | Yields keep falling as growth fears build |
A cited bank note treats stocks falling alongside rates as a bearish signal. Damien Boey of Wilson Asset Management said the bond-equity correlation is “definitely fracturing”. For a 60/40 portfolio, higher starting yields improve forward bond returns but pressure equity multiples. Treat the split as a decision about risk and duration, not a verdict on either asset.
Why rotation stalled
Small caps and financials depend heavily on funding and refinancing costs. A 0.11% Russell gain is too small to show a durable rotation. Investors sold expensive tech without confidently buying cyclicals. The Fed meets on 27-28 October, and a Reuters poll found 94 of 100 economists expect a hold at 3.75%-4.00%.
Is this an AI bubble signal or a hedging window?
The bubble case has prominent support.
Ken Griffin, Citadel, 20 October: Investors are “almost certainly” in an AI bubble, a comparison he drew with the telecom boom around 2000.
Griffin warned of debt-funded data-centre spending without matching productivity gains, and of excess chip capacity that could push prices down fast. Put skew is rising and dip-buying is fading, and the CoreWeave and Oracle positioning points at the centre of the AI trade.
The counter-case is also credible. Blackstone President Jon Gray said investors should not assume the AI boom becomes a bubble. Meta’s 26% revenue growth shows demand is real. Volatility episodes in 2024 and 2025 brought VIX-call buying without a lasting bear market, though no October 2026 source compares current skew with each of those episodes.
The counter-case rests on valuations that look far lower than 2000, yet record index concentration in the Magnificent Seven means any broad index holder still carries a sizeable AI bet.
The mechanics cut both ways. Puts can be speculation, insurance, dispersion hedges or hedges on held stock, and VIX calls can offset short-volatility exposure. Dealer gamma hedging can reverse, and leveraged ETF rebalancing amplifies intraday moves.
What would change the picture:
- A retreat in oil prices
- A confirmed Fed pause with easing yields
- Earnings stabilising at the next hyperscaler reports
- Hedgers unwinding protection, which could fuel a rebound
Options positioning tells you how worried participants are, not whether they are right. Weigh it alongside earnings, yields and oil.
Reading the signals together before the Fed and the next hyperscaler results
The three layers point the same way: earnings reactions punishing capital intensity, protection-buying, and bonds competing for capital. Treat them as a dashboard rather than a verdict.
- S&P 500 relative to the 7,690 pivot and the 7,450 area
- SMH relative to 540 support
- Implied correlation near 13.98
- VIX behaviour between 20 and 23
- The 10-year yield against 5%, and the direction of oil
Decide in advance which readings would change your stance.
Making a measured call when support for the rally is thinning
Support is thinning across earnings, positioning and bonds, but no single signal settles the question. The next tests arrive quickly: the Fed decision on 28 October and the next round of hyperscaler results. If yields ease and spending plans land better, today’s hedges could unwind into a rebound. If oil and capex worries persist, the levels above become the lines to watch.
Past performance does not guarantee future results. Forecasts and scenarios are speculative and subject to change.
This article is for informational purposes only and should not be considered financial advice. Investors should conduct their own research and consult with financial professionals before making investment decisions.