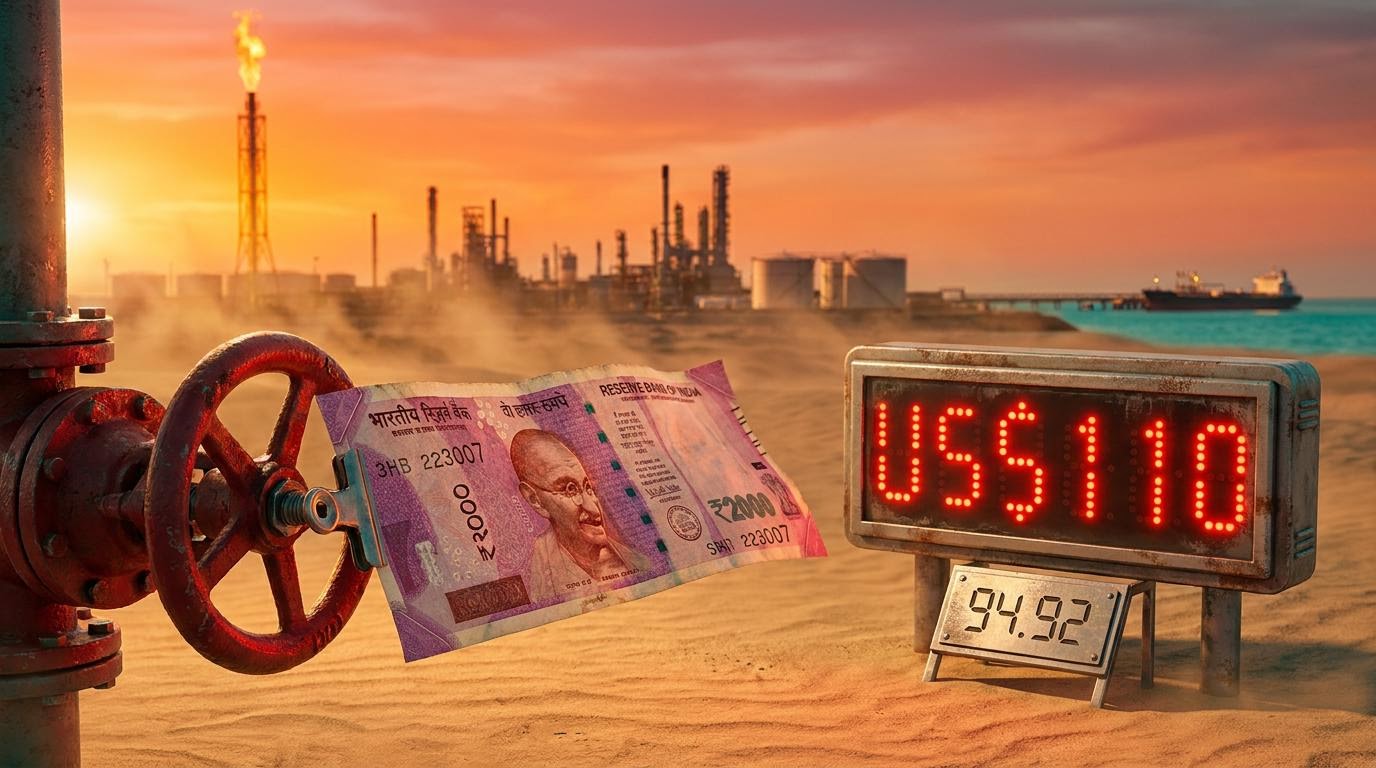
India’s private sector is expanding at one of the fastest rates in the world, yet on Friday the rupee gave back almost everything it had gained during the week. The HSBC flash composite PMI came in at 56.7 for October, and by 23 October 2026 USD/INR was trading near 94.92, with the rupee slipping as oil prices pushed higher. If a booming economy cannot hold up its own currency, something else is setting the price.
That something is oil. Brent is trading above US$110 a barrel after a drone strike near Saudi Aramco’s Shaybah field and a US order pulling non-emergency diplomatic staff out of Saudi Arabia.
If you hold rupee assets, import into India or follow emerging-market currencies, you are facing the same puzzle. Strong growth data says one thing, and the exchange rate says another.
Here is a working framework for separating the growth signal from the dollar-demand signal. It also covers the specific levels and data releases worth watching next.
Why is a strong economy not protecting the rupee?
Put the two numbers side by side and the contradiction is hard to ignore. On Friday the rupee closed at ₹94.8175 per dollar, down 0.4% on the day, according to The Economic Times. That move ended an eight-session winning streak.
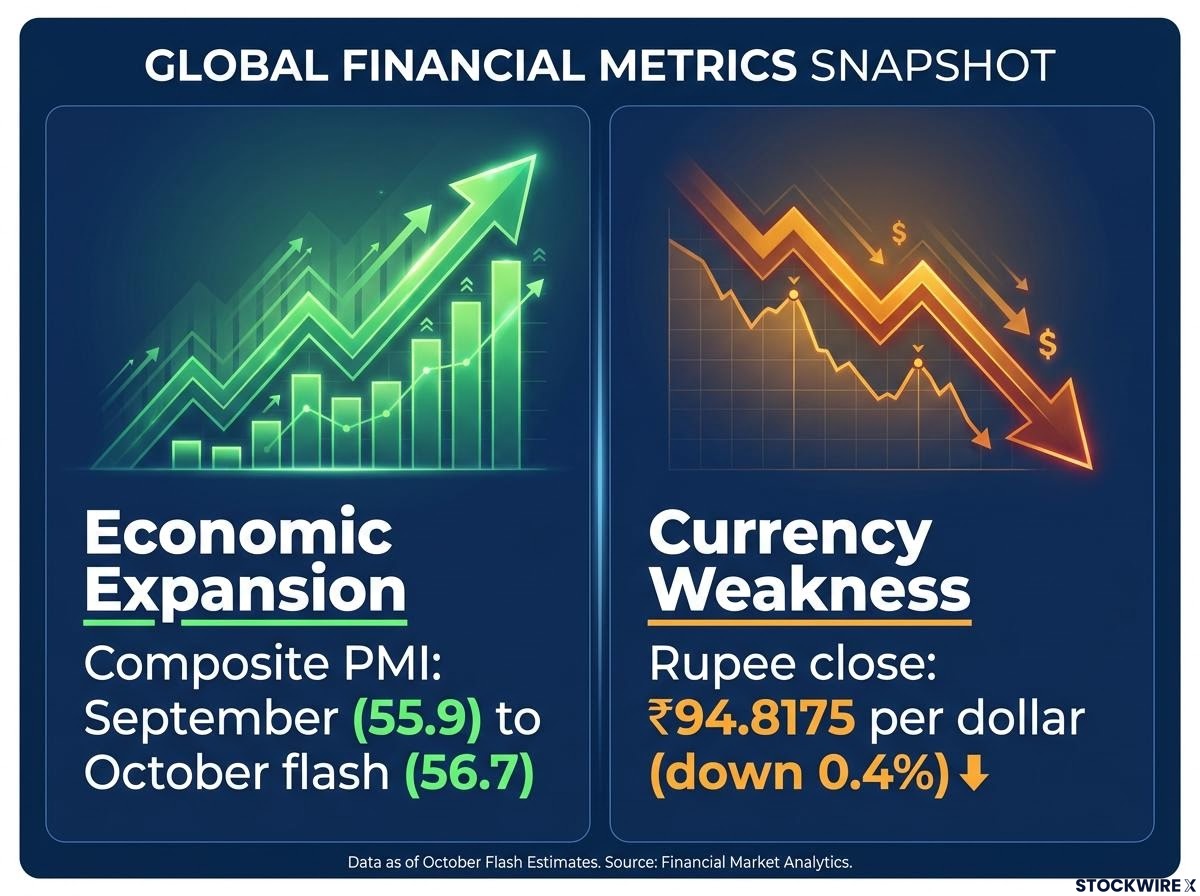
In the same week, HSBC’s flash survey showed private-sector activity accelerating. Pranjul Bhandari, HSBC Chief India Economist, pointed to services leading the gain, with manufacturing easing only slightly.
| PMI measure | September | October (flash) | Direction |
|---|---|---|---|
| Composite | 55.9 | 56.7 | Up |
| Services | 55.2 | 56.2 | Up |
| Manufacturing | 55.1 | 54.9 | Slightly down |
A PMI (purchasing managers’ index) is a monthly survey of businesses where any reading above 50 signals expansion. Export orders grew at among the fastest rates in months, and input-cost inflation eased. On paper, this is a healthy economy.
Markets rarely react to the level of a PMI reading alone; PMI surprises relative to consensus matter far more, which is another reason a strong October print can coexist with a weaker rupee.
The puzzle dissolves once you separate activity from money flows. A PMI measures how busy businesses are. The exchange rate is set at the margin by who needs dollars today and who is supplying them.
The central idea Strong growth is not the same as an immediate supply of dollars. A busy economy can still be short of the currency it needs to pay for oil.
When oil jumps, India’s dollar bill jumps with it, and that demand arrives daily. A monthly survey cannot outweigh it. Treat growth data as a reading on the economy’s health, not as a forecast for the rupee.
When big ASX news breaks, our subscribers know first
How do oil prices, Middle East tensions and capital flows move USD/INR?
The signal this week was simple: a drone strike, oil higher, rupee lower. The chain behind it runs through several links, and each one pushes the pair upward.
- A geopolitical event raises the risk of disrupted supply.
- Traders add a risk premium to oil prices.
- Indian refiners need more dollars to pay for the same crude.
- The national import bill widens.
- Extra dollar demand pressures the rupee.
The oil and import-bill channel
India imports most of its crude, so every dollar added to Brent becomes extra dollar demand from refiners. That strains the trade balance and the current account, which is the broad record of money flowing into and out of a country from trade and income.
The trigger came on 21 October, when a drone strike hit the area around the Shaybah field. Saudi authorities said operations were unaffected. Washington then ordered non-emergency diplomatic staff out of Saudi Arabia, and oil briefly spiked on reports of a wider Gulf pullout before easing once the order was confirmed as Saudi-only.
ICIS reported Brent December futures at US$110.05 and WTI at US$98.06 on 22 October, with other reports putting Brent near US$111.60. No production was lost. The jump was a risk premium, which is the extra price buyers pay as insurance against possible disruption.
Goldman Sachs estimates that just over US$20 of Brent’s price is a geopolitical fear premium, and that portion could unwind quickly if damage stays contained, which is the rebound trigger for the rupee.
That matters for you. When oil rises on risk rather than real shortages, the rupee reacts to headlines, so reversals can arrive as quickly as the spikes.
Flows, the dollar and US yields
Oil is not working alone. Foreign investors selling Indian assets add dollar demand, while a firm US dollar and elevated US yields make holding dollars more attractive during periods of risk aversion.
The Economic Times reported on 21 October that economists still expected weakness even though the current-account deficit had narrowed to about 0.5% of GDP. DBS economist Radhika Rao cited elevated oil, weak capital flows, a firm dollar and competition for global capital, adding that central bank support leaves limited room for sustained rupee gains.
This pattern has played out before:
- March 2022: Oil surged after Russia invaded Ukraine and the rupee hit a then-record low of ₹76.92.
- October 2022: Rising oil and risk aversion pushed the rupee towards record lows again, before reported intervention stabilised it near ₹82.40.
You can apply this model to any oil-importing emerging-market currency. Watch the oil premium first, then the flows.
What can the RBI do, and where does its defence run out?
The Reserve Bank of India (RBI) does not fix the rupee’s value. It smooths volatility by selling dollars in spot and forward markets, often through state-owned banks, and by adjusting liquidity and rules.
In 2026 it has used almost every tool. On 7 October it raised the repo rate unanimously by 25 basis points to 5.50%, shifting its stance to “calibrated tightening”. Higher rates can support a currency through the carry trade, where investors borrow in low-rate currencies to hold higher-yielding ones. The RBI’s inflation target is 4%.
It also reportedly opened a special dollar-supply window for three state-owned oil companies and tightened rules on certain rupee-linked FX derivatives. Each step reduces dollar buying in the open market.
The cost shows up in the reserve count.
Reserves under pressure Foreign-exchange reserves were reported at US$785.706 billion on 4 September, a record. By 9 October they had fallen to US$726.027 billion, down US$8.578 billion in a single week and nearly US$60 billion from the peak.
That still reportedly covers about 11 months of imports. The cushion is large, but it is shrinking.
| Argument | Evidence | Who holds it | Weakness |
|---|---|---|---|
| Orderly, temporary decline | Strong PMIs, improving exports, contained deficit, large reserves | Bulls on orderliness | Growth does not supply dollars directly |
| Fundamentals dominate | High oil, outflows, global dollar strength | Hanna Luchnikava-Schorsch, S&P Global Market Intelligence | Depends on oil staying elevated |
Luchnikava-Schorsch has said RBI measures cannot fully offset the fundamentals. Intervention buys time; it does not remove dollar demand. Read a stable rupee as a managed outcome, and a falling reserve count as the price of that management. It also explains why a gradual drift is more likely than a sudden collapse.
Investors exploring how far intervention can go will find our deep-dive into the RBI’s rupee defence useful, since it explains how forward obligations shrink the usable reserve buffer.
What do the technical levels and next data points say about USD/INR?
Fundamentals explain direction. Chart levels help you judge timing and where the market may react.
Reading the chart levels
One quirk first: USD/INR rises when the rupee weakens. A “bearish” bias on the pair therefore means a stronger rupee.
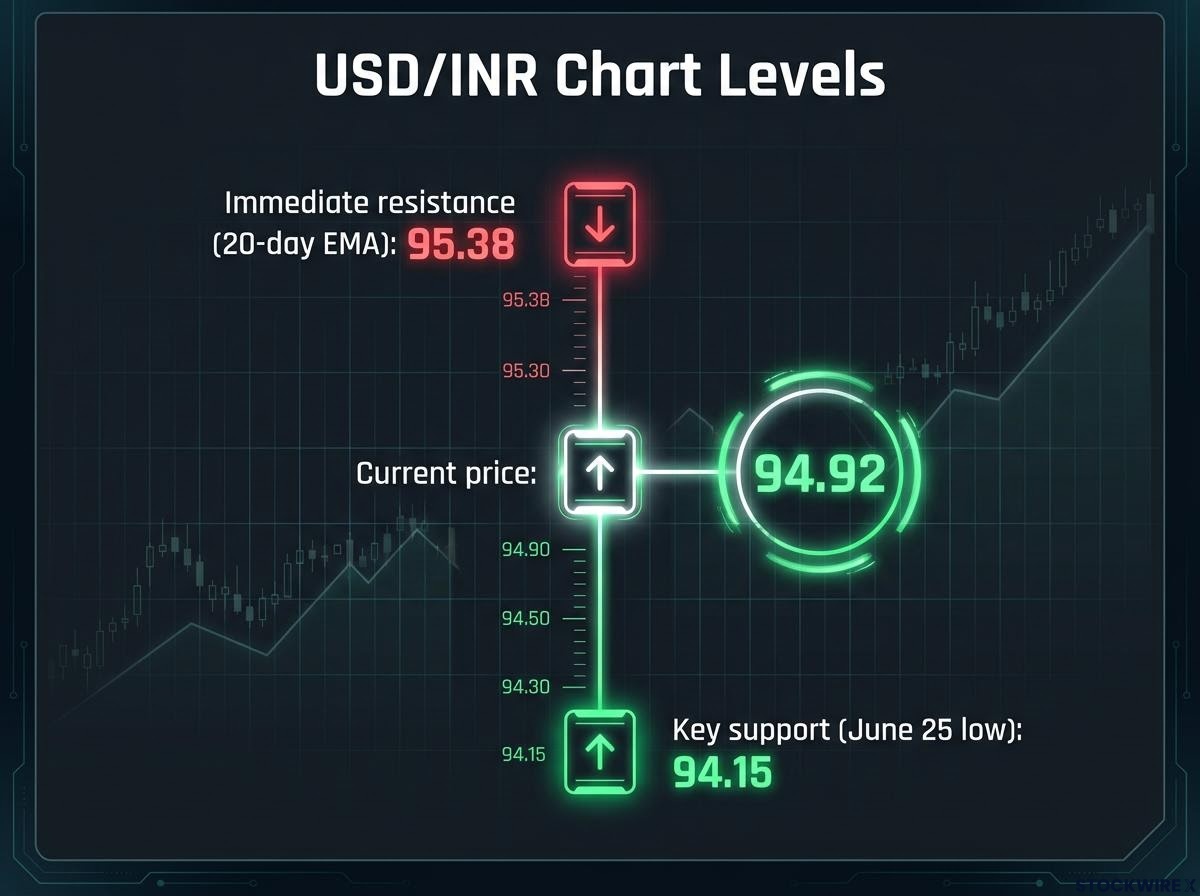
FXStreet’s analysis has the pair at 94.92, below its 20-day exponential moving average (EMA), a trend line that weights recent prices more heavily, at 95.38. The relative strength index (RSI), a momentum gauge from 0 to 100, sits at 37.94, just above oversold territory, which suggests selling of the pair may be easing.
| Level | Value | Role | What a break implies |
|---|---|---|---|
| 20-day EMA | 95.38 | Immediate resistance | Regaining it reduces the short-term bias towards a stronger rupee |
| Current price | 94.92 | Reference point | Short-term bias stays bearish while below the EMA |
| June 25 low | 94.15 | Key support | A sustained break would extend the move further |
These levels show where the market is likely to react, not what the rupee is worth. Pair any chart read with the oil and reserve picture.
Scenarios and what to watch next
S&P Global Market Intelligence reportedly forecasts about ₹97 per dollar by end-2026 and ₹98 by mid-2027, and does not rule out ₹100 if oil rises, outflows resume and the deficit widens. Forecasts are subject to market conditions and may change.
Risks that could weaken the rupee:
- A further oil spike
- Disruption in the Strait of Hormuz or escalation involving Iran
- Renewed foreign outflows
- Higher US yields
Triggers that could support a rebound:
- Lower oil and a fading risk premium
- Inflows tied to large equity offerings such as the Jio IPO
- A weaker US dollar
Next up are the preliminary US S&P Global PMIs, due at 13:45 GMT today, followed by weekly reserve prints and Brent’s direction.
What the growth story does not change, and what to track from here
Strong growth helps a currency, but it is not enough on its own. Right now, oil above US$110, Gulf risk, outflows and a firm dollar are setting the rupee’s price, and the RBI can slow the slide without permanently reversing it.
When growth and the currency seem to disagree, look at who needs dollars and who is supplying them. Three variables will tell you most of what you need:
- Brent and Gulf headlines
- Weekly RBI reserve data
- The 94.15 support and 95.38 resistance levels
This article is for informational purposes only and should not be considered financial advice. Investors should conduct their own research and consult with financial professionals before making investment decisions. Past performance does not guarantee future results. Financial projections are subject to market conditions and various risk factors.