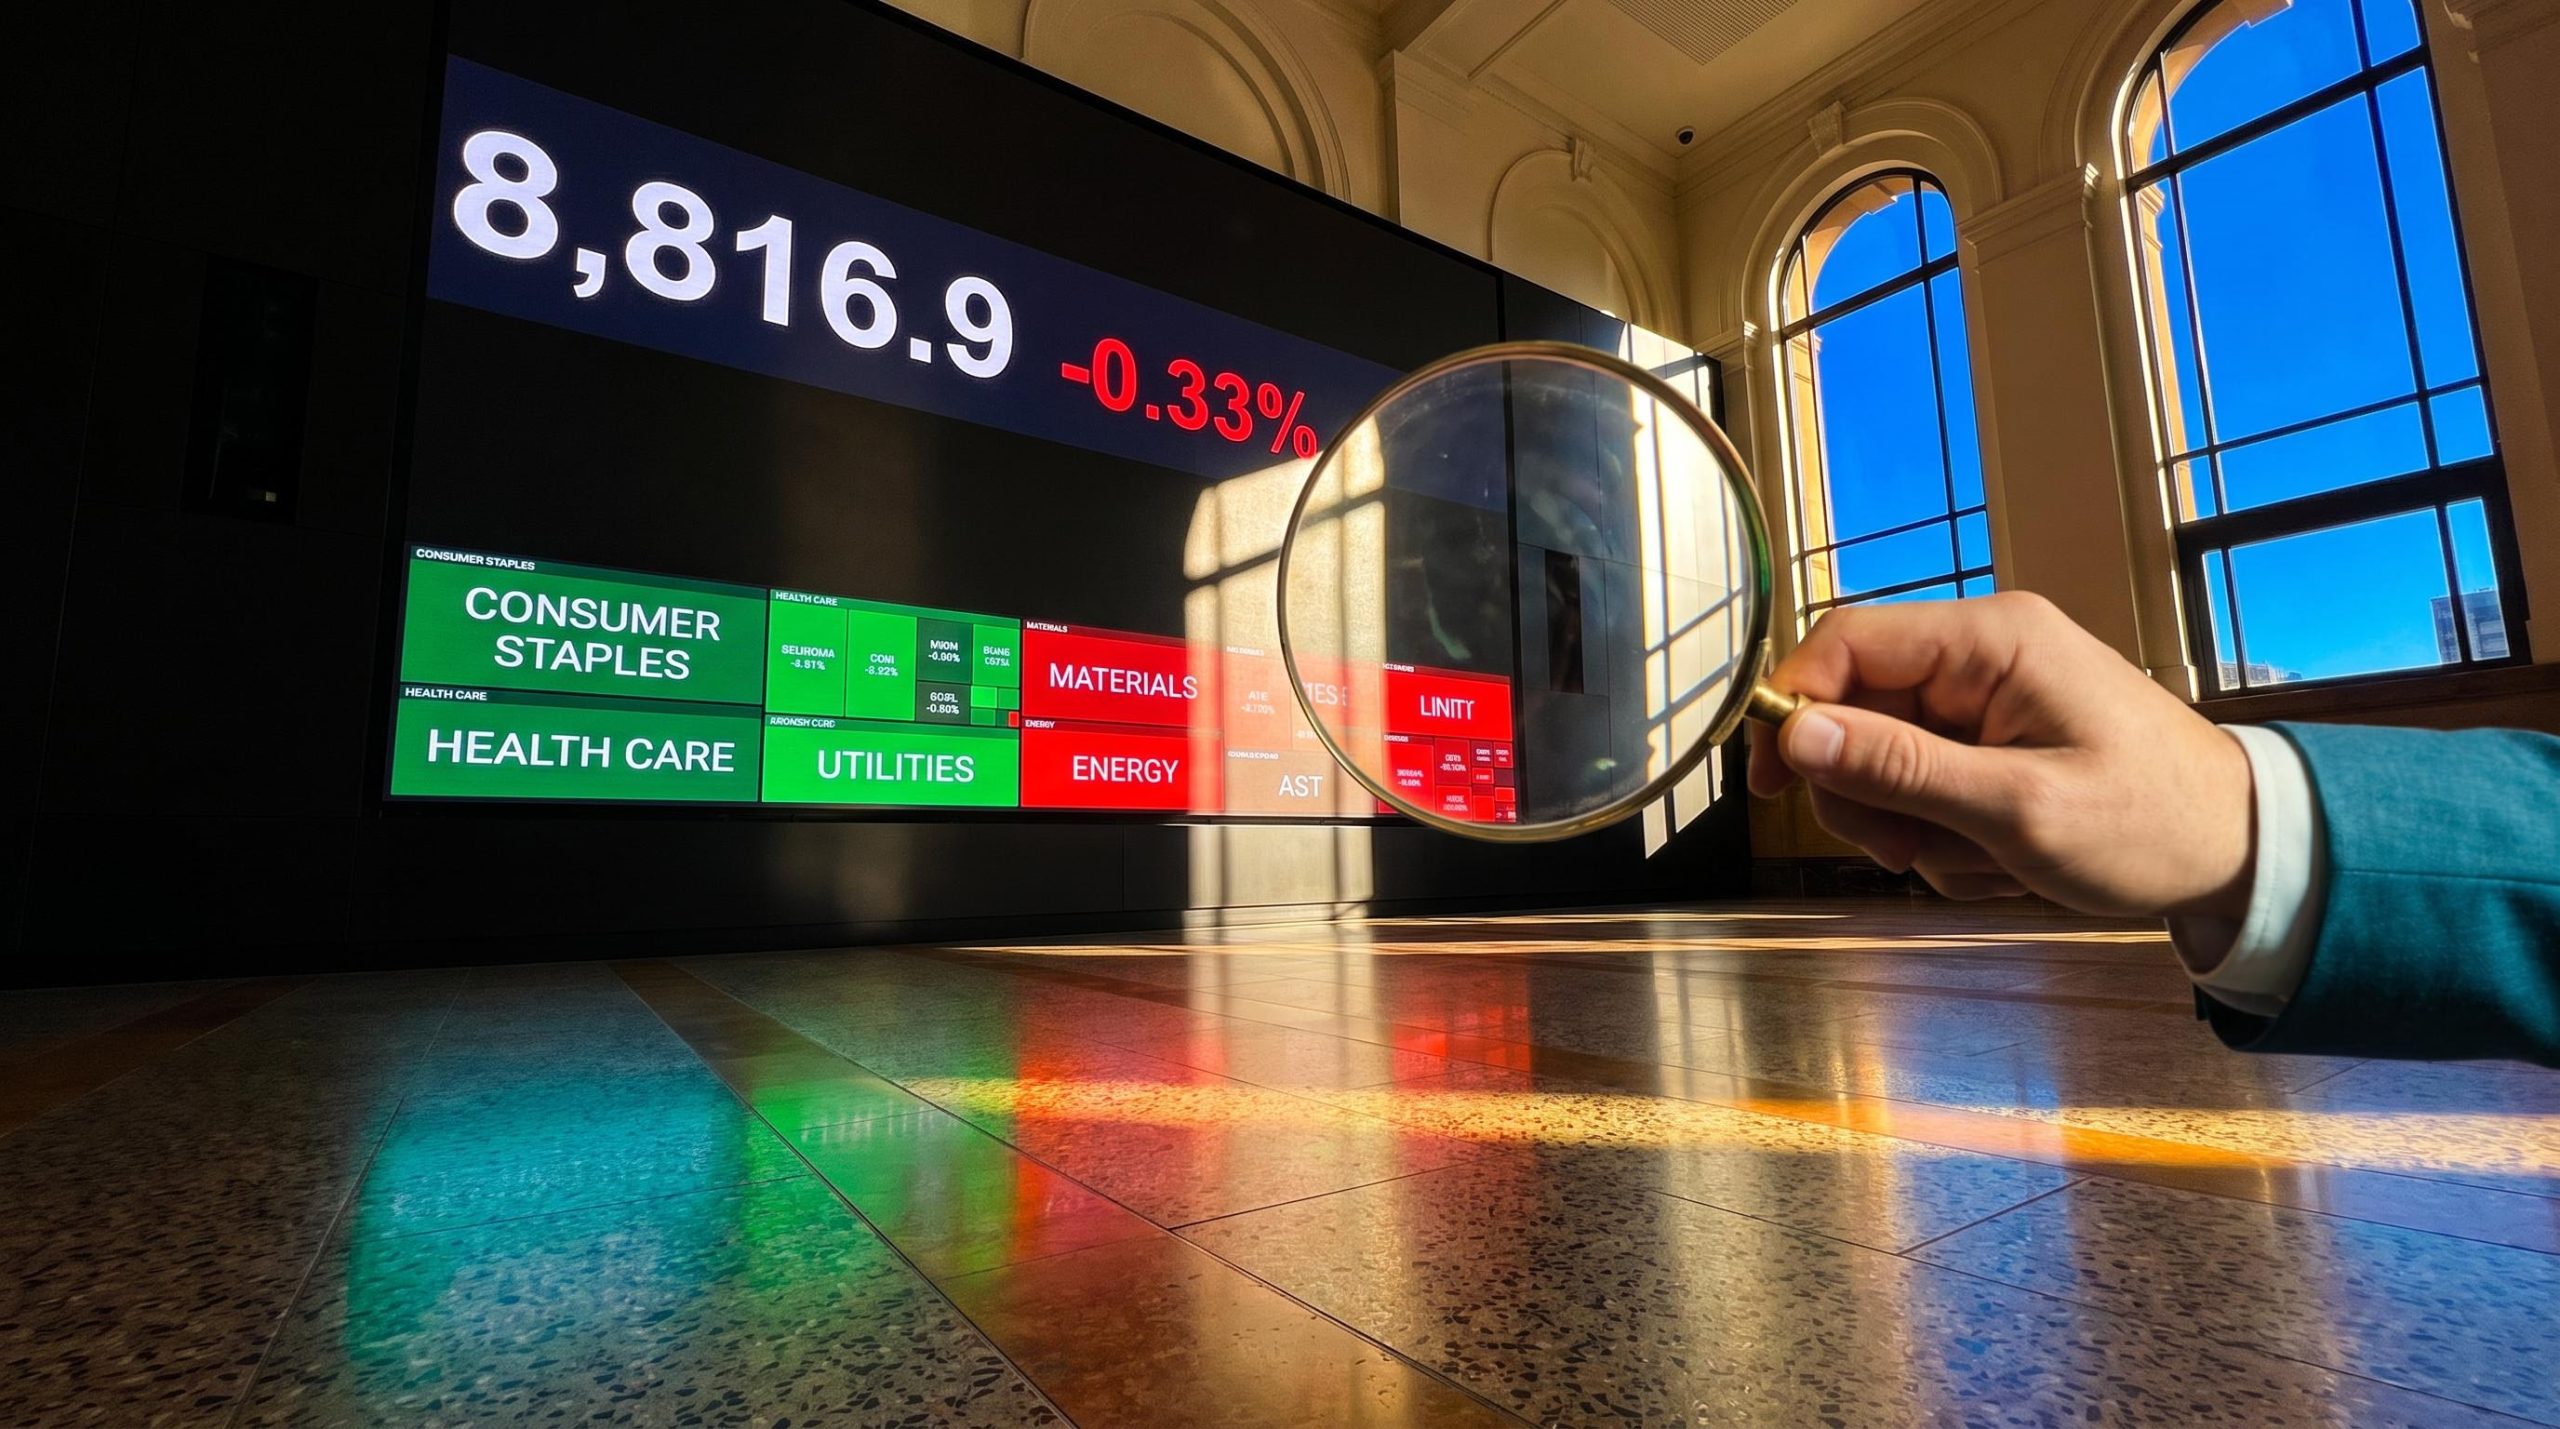
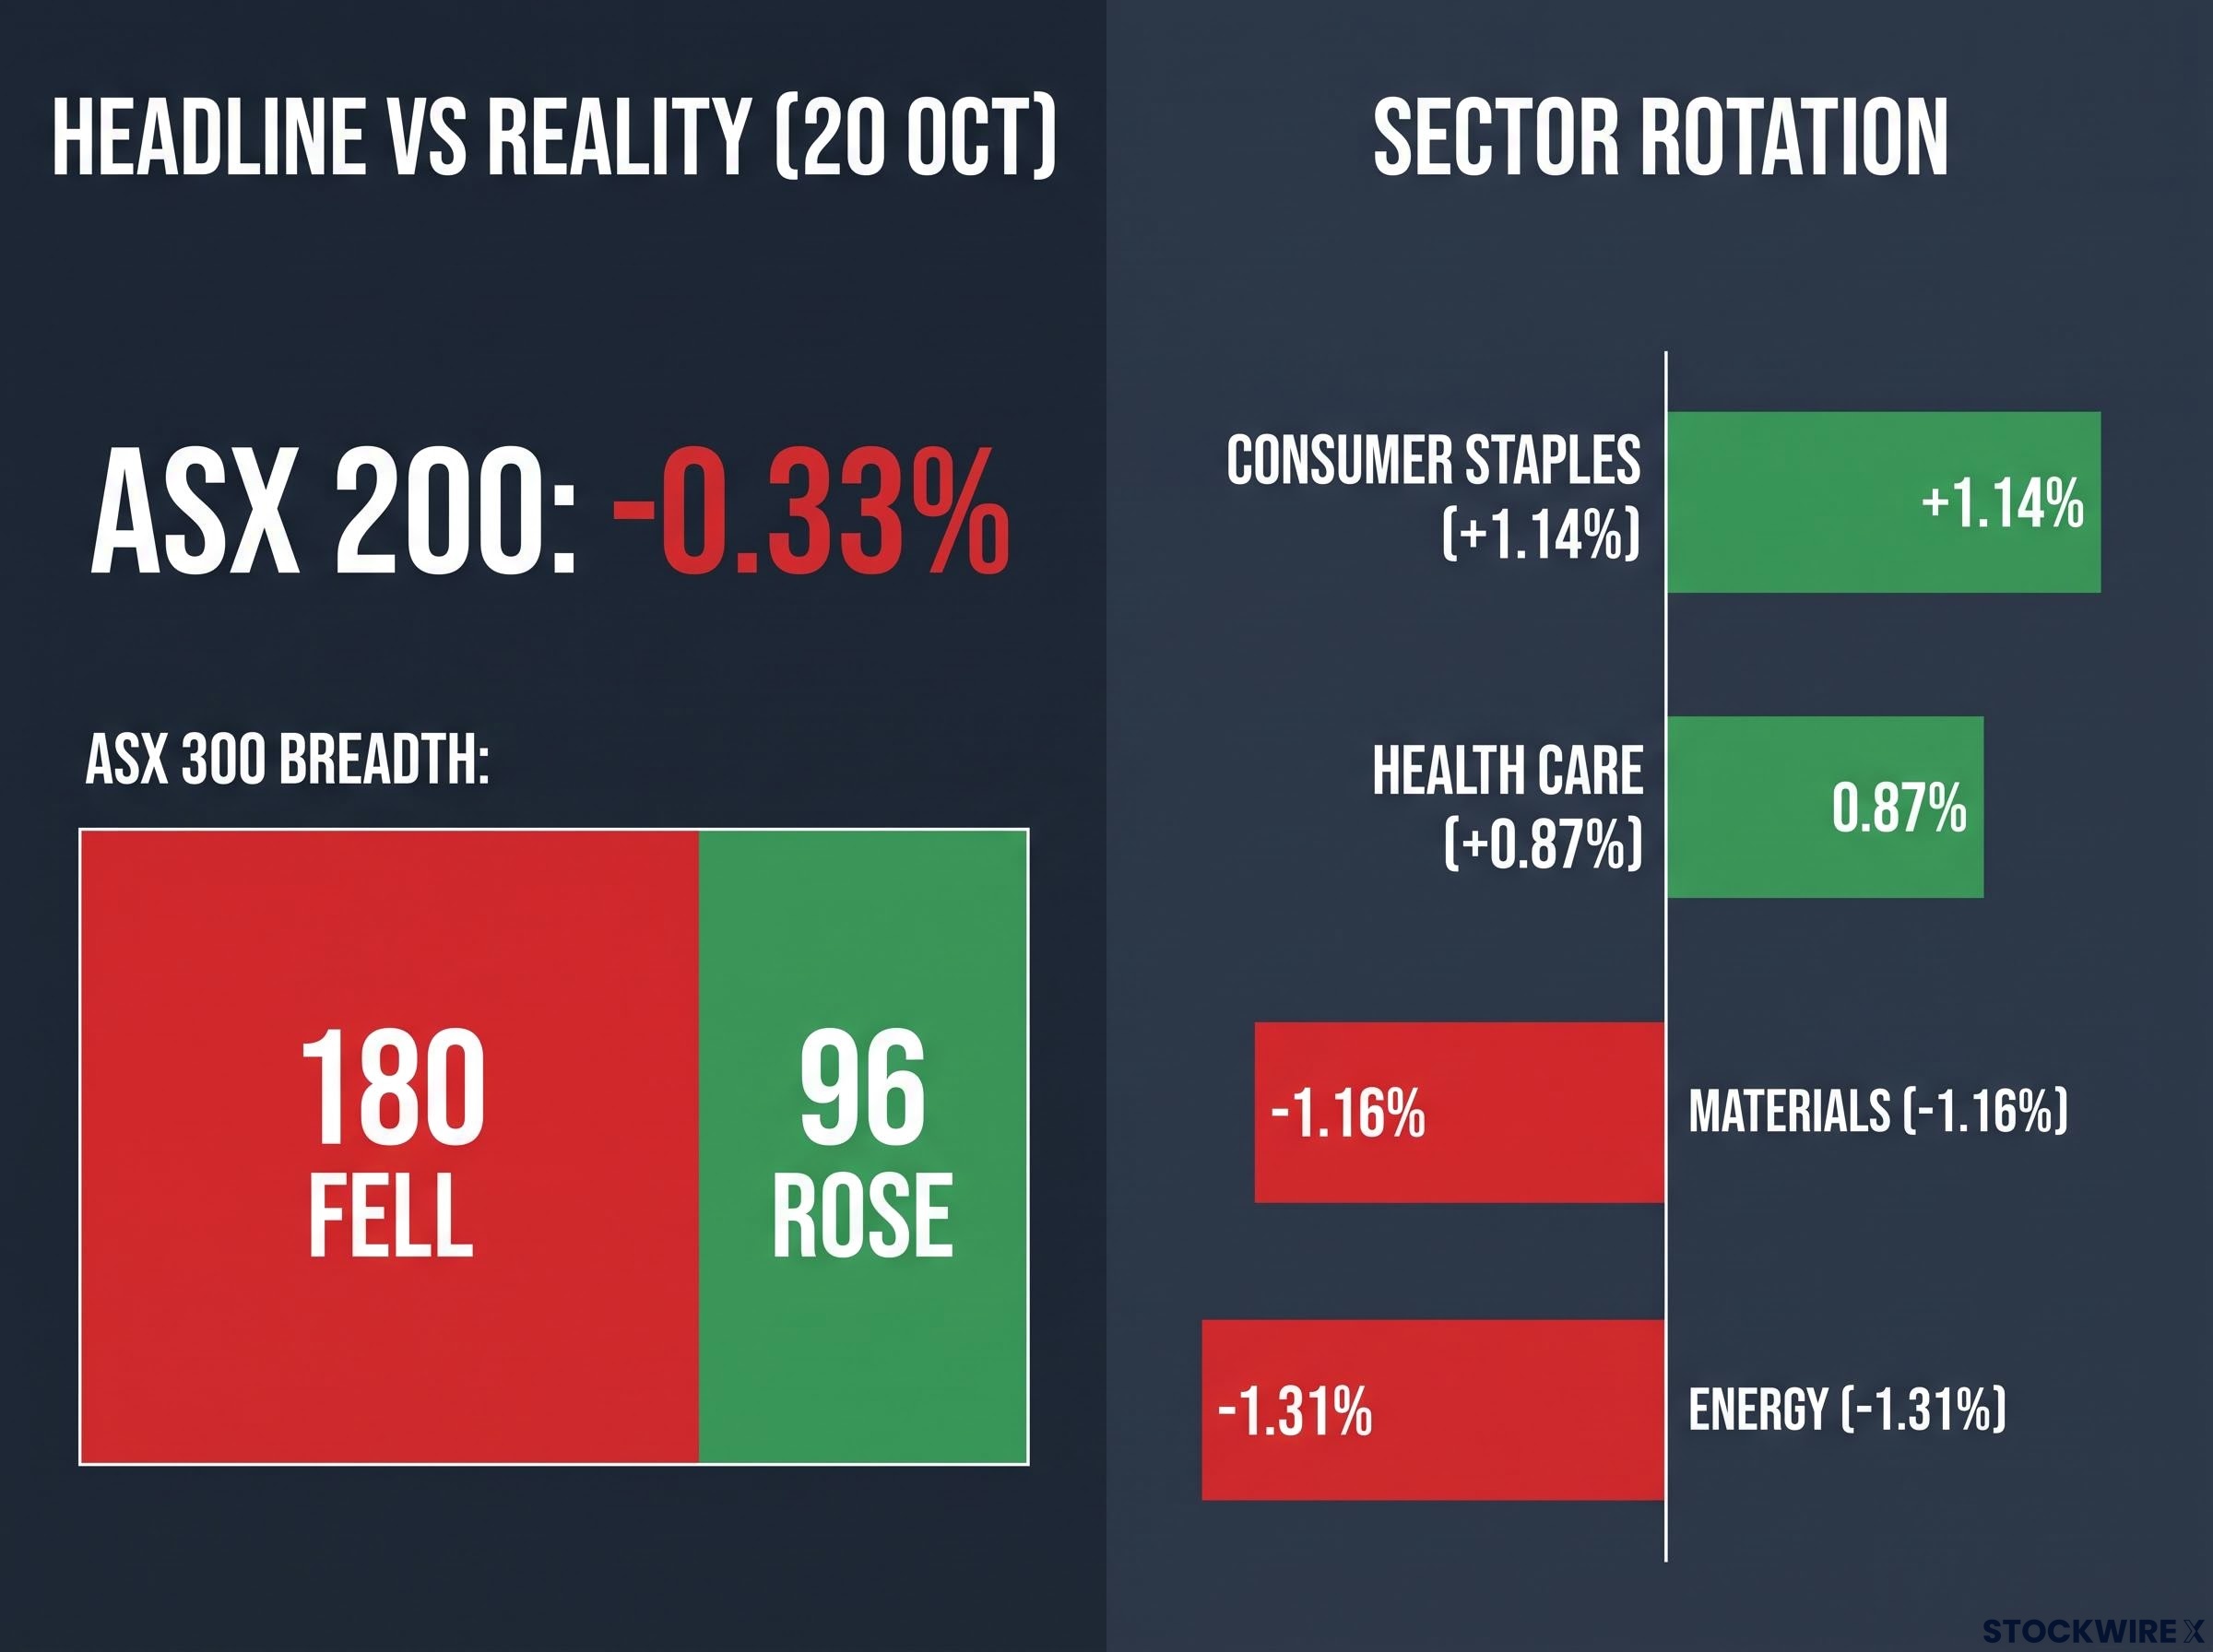
The ASX 200 lost just 0.33% on Tuesday to close at 8,816.9, a move most investors would barely notice. Underneath it, 180 stocks in the ASX 300 fell and only 96 rose. That gap between a calm headline and a lopsided market is the clearest sign yet of a defensive rotation on the ASX, as money leaves resources and moves into companies with steadier earnings.
Consumer staples, health care and utilities finished higher. Materials and energy fell. The index now sits about 5.2% below its August record of 9,296.70.
The backdrop matters. The Reserve Bank of Australia (RBA) lifted the cash rate to 4.60% in September, so cash now pays a return that competes with shares.
Here is how to tell healthy rotation from a genuine warning sign, which explanations hold up, and what to watch before the week is out.
What did the 20 October session actually show?
On the surface, Tuesday looked like a modest down day. The ASX 200 shed 28.8 points, and it recovered enough of an early slump to finish 0.80% above its session low. The All Ordinaries closed at 8,944.2.
The sector split tells a different story.
| Sector | Move (20 October) |
|---|---|
| Defensive and domestic | |
| Consumer Staples | +1.14% |
| Health Care | +0.87% |
| Consumer Discretionary | +0.76% |
| Real Estate | +0.70% |
| Utilities | +0.49% |
| Cyclical | |
| Financials | -0.48% |
| Materials | -1.16% |
| Energy | -1.31% |
Smaller companies fared worse, with the Small Ordinaries down 0.87%. Breadth, meaning how many stocks moved up versus down, was decisively negative.
Capitalisation-weighting explains much of this gap, because mega-caps anchor the headline index while a large share of constituents sit well below their 52-week highs, a pattern also visible earlier this year.
Breadth check: In the ASX 300, 180 stocks declined and only 96 advanced on 20 October.
This was not a one-day event. Market Index reported on 19 October that Woolworths, Ansell and APA Group were at or near 52-week highs, as leadership drifted away from resources. Tuesday simply made the pattern harder to miss.
The defensive label is not armour, though. On 1 October, the ASX 200 fell 1.99% and the defensive sectors dropped alongside everything else.
The evidence points to rotation, not collapse. What it tells you is that a flat-looking index can hide a market where most stocks fell, so a portfolio that looks diversified may be less sheltered than its headline suggests.
When big ASX news breaks, our subscribers know first
Why are investors rotating: growth fears, rates, China or super flows?
Several explanations compete for the role of chief driver. Each has some evidence behind it:
- Growth fear: Investors may be pricing weaker global or domestic growth, favouring companies whose sales hold up in a slowdown.
- Rate expectations: The RBA raised rates 25 basis points to 4.60% in September, and Deputy Governor Christopher Kent said the expected path sits at the upper end of the neutral range. Markets priced a possible move to about 4.85% in November.
- China and commodities: The People’s Bank of China left its one-year and five-year loan prime rates at 3.00% and 3.50% for a 17th straight month, removing a near-term lift for miners.
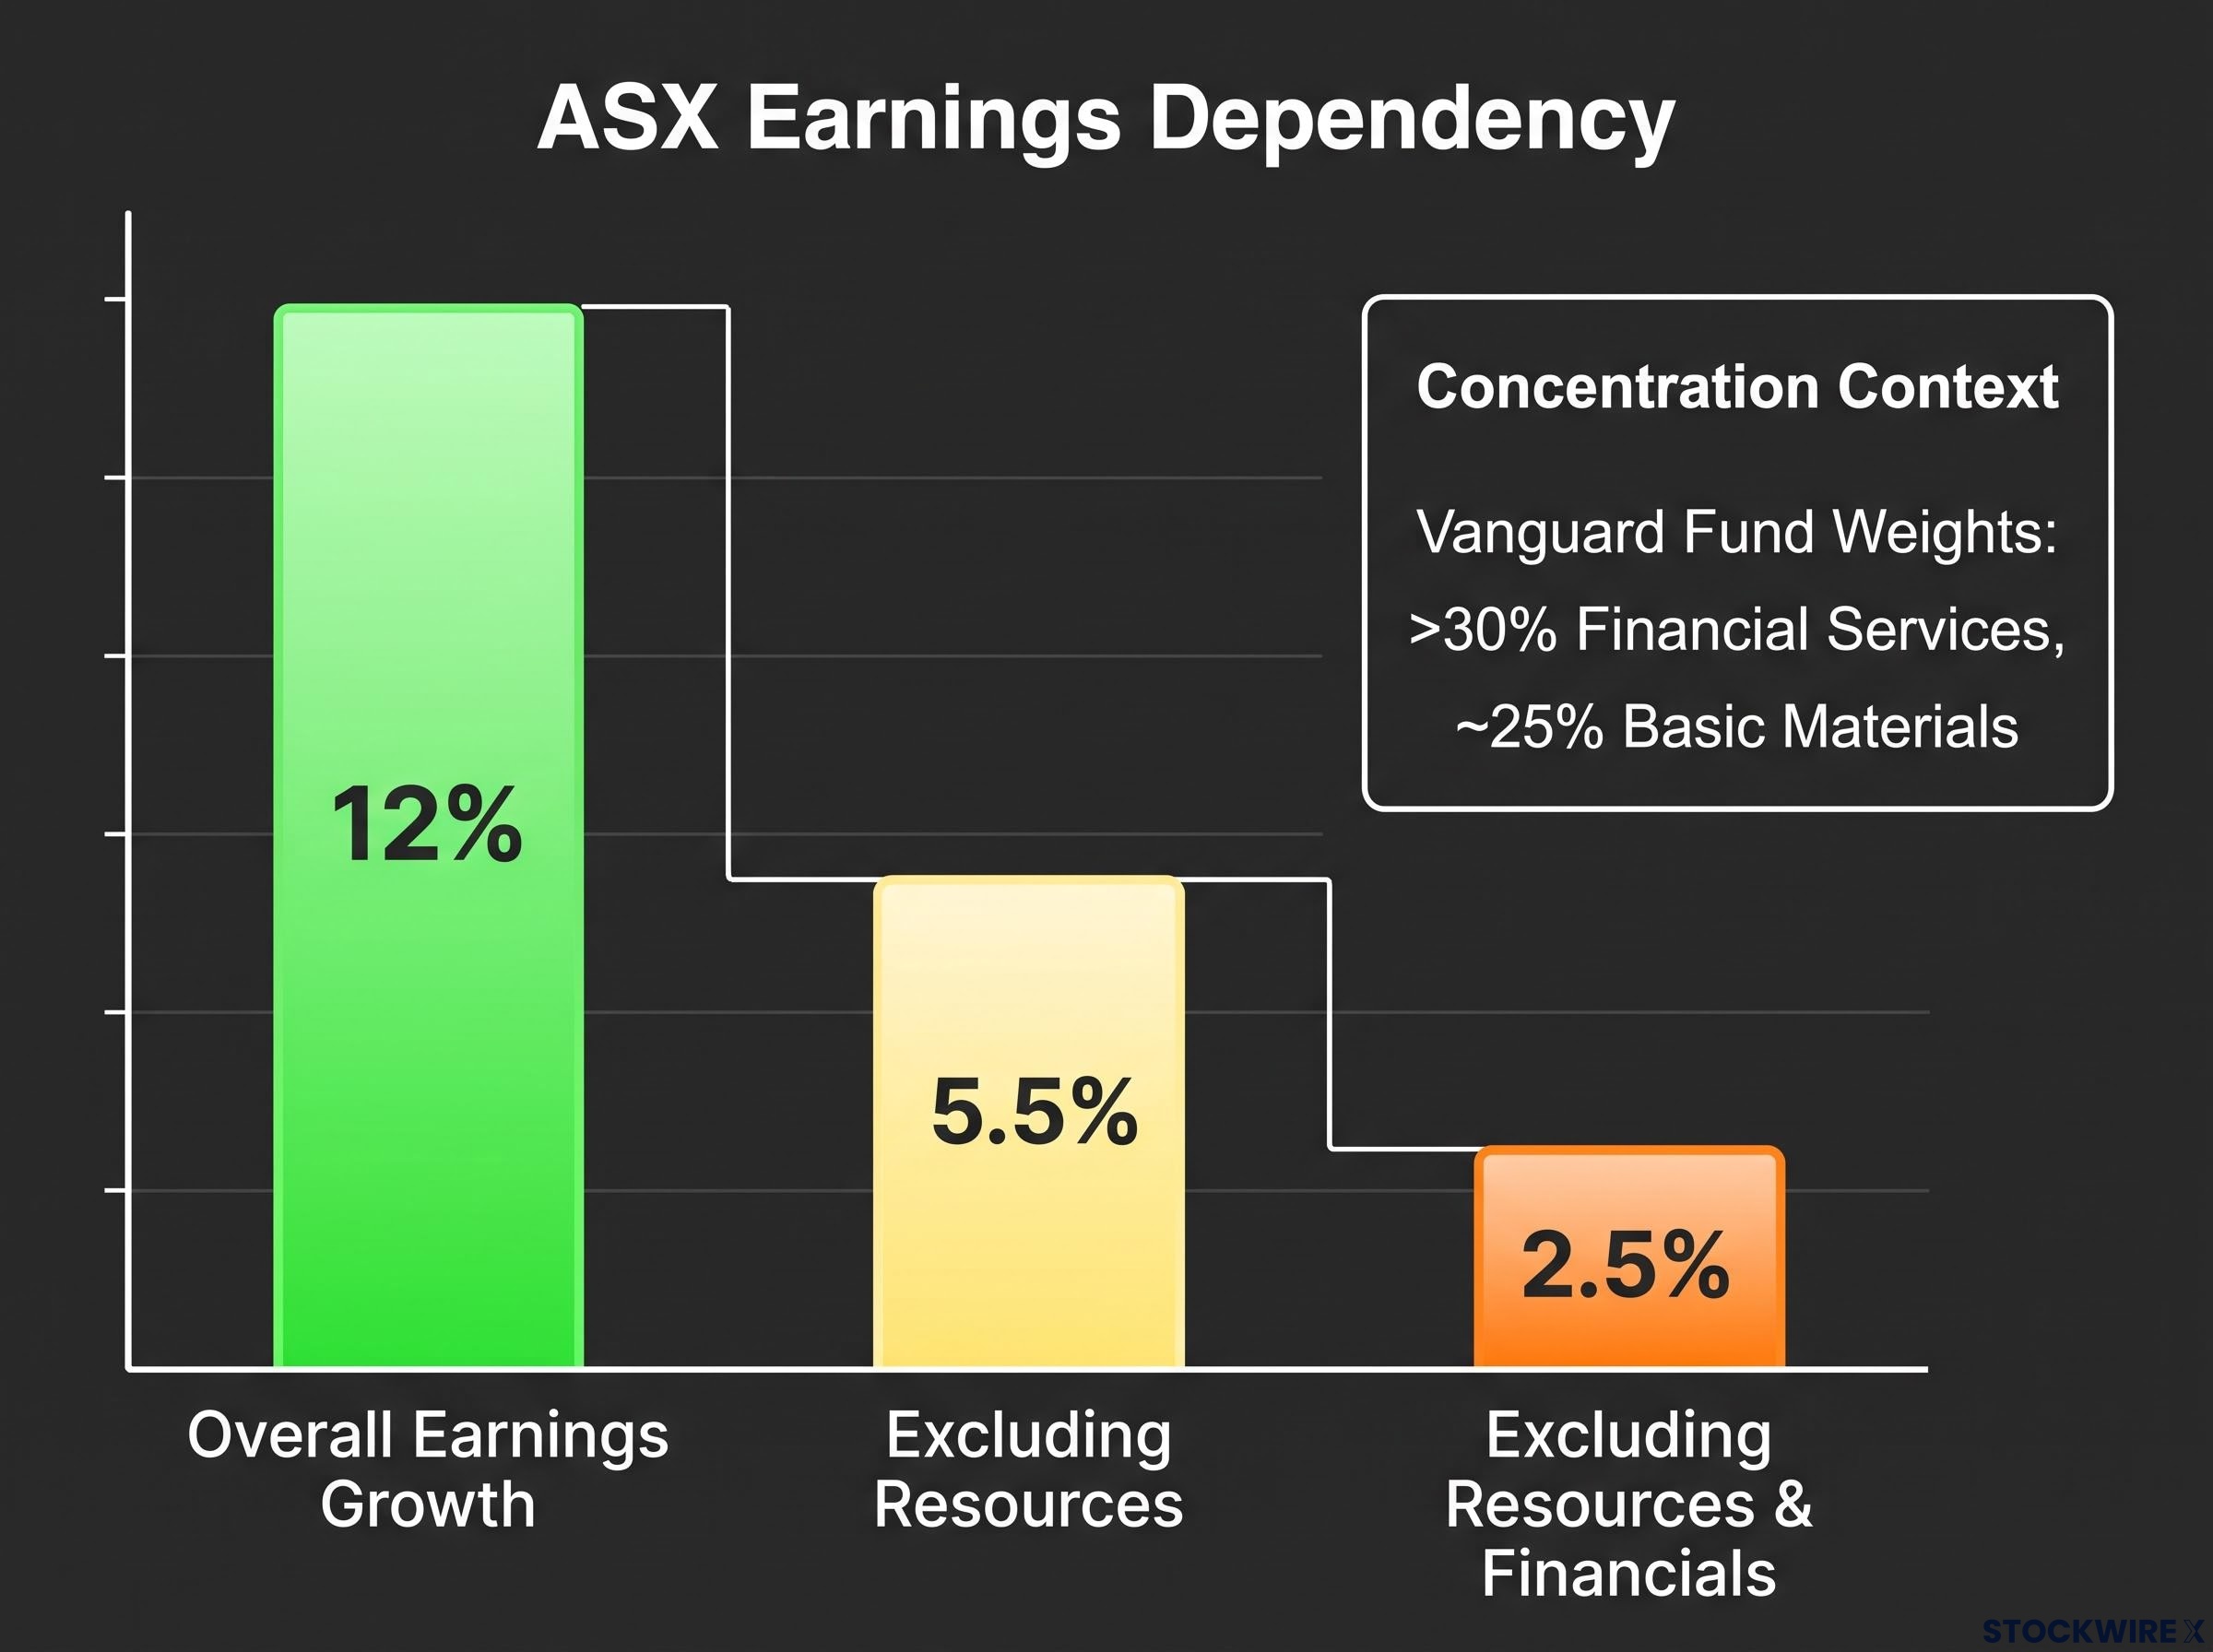
- Valuation and narrow earnings: FactSet forecast earnings growth of about 12% overall, but only 5.5% excluding resources and 2.5% excluding resources and financials.
- Super flows: Compulsory retirement savings keep feeding cash into large domestic companies.
Commentators read the same tape differently. Danske Research sees sector rotation rather than broad deleveraging (selling to cut overall risk), while Market Index points to a preference for earnings visibility.
Rising bond yields lift discount rates and the opportunity cost of holding equities, which helps explain why capital moves toward steadier earners, although stretched-valuation defensives carry their own rate sensitivity.
The China signal and the rate signal both lean towards caution. But neither explains why the selling stayed so contained.
The structural layer: super flows and concentration
That answer sits in the plumbing of the Australian market. Deloitte estimates super funds own just over 36% of ASX market capitalisation, and Bloomberg reported Australian equities at 23% of super assets at 31 December 2025.
| Measure (year to 30 June 2026, APRA) | Figure | Change |
|---|---|---|
| Total contributions | $236.3 billion | +12.8% |
| Net contribution flows | $77.7 billion | +9.6% |
| Super assets | About $4.8 trillion | +6.6% (June quarter) |
With the Superannuation Guarantee at 12.00%, that bid is steady. It also lands in a narrow market: VanEck reports the top ten stocks make up about half the ASX 200, and financials and materials together exceed half.
The read you should take is layered. Cyclical caution is sitting on a concentrated, super-supported market, and while that bid props up large liquid names, it does not stop selling elsewhere or make the market immune to a downturn.
How do you read market breadth and sector rotation, and where do the signals mislead?
On a screen, breadth shows up as a simple count of risers and fallers. Behind that count sit several measures, each answering a slightly different question.
Four ways to read breadth
- Advancers versus decliners: The number of stocks that rose against those that fell. It tells you how widely a move was shared.
- Stocks above their 50-day and 200-day averages: A moving average is a stock’s average price over a set number of days. The share of stocks above it tells you how many are in a short-term or long-term uptrend.
- New 52-week highs versus lows: More highs than lows suggests broad strength. A shrinking list of highs suggests leadership is thinning.
- Equal-weighted versus cap-weighted performance: Cap-weighted indices give bigger companies more influence. If the equal-weighted version lags, a handful of giants are carrying the index.
Sector patterns add context. Defensives leading usually signals a preference for stability or income, while weak resources may reflect commodity or China concerns. Banks moving with defensives can reflect dividends or contained expectations for bad loans.
Charts offer another layer. Carl Capolingua’s ChartWatch analysis maps the levels traders are watching.
Technical zones: ChartWatch identifies nearest supply (where sellers tend to emerge) at 8,935-8,940 and critical demand (where buyers tend to step in) at 8,613-8,641 on the ASX 200.
Where the signals mislead
- Breadth is descriptive, not causal. It shows what happened, not why.
- The ASX is concentrated. Morningstar reported a Vanguard Australian Shares fund with over 30% in financial services and about 25% in basic materials.
- Defensives can be expensive, which limits how much shelter they offer.
- Signals can persist for months without resolving into a fall.
- No reliable Australian rule shows defensive leadership alone predicts a decline.
The 1 October session is the reminder: health care fell 2.49%, staples 2.55% and A-REITs 2.51%. Treat a weak breadth reading as a prompt to check what is driving it, not as a sell signal, and check how much of your own portfolio sits in banks and miners.
Is a cautious stance worth the cost, and what could change it this week?
The cautious case has real weight. At 4.60%, cash pays a credible return, and Capolingua notes it is not an unattractive holding; he reports holding about 67% cash and remaining cautious on Australian shares. That is one investor’s positioning, not a recommendation.
Professional managers vary in degree. Maple-Brown Abbott is defensive on valuation and business quality, holding elevated cash and sitting underweight banks. Macquarie’s 2026 outlook favoured diversification and disciplined positioning over wholesale withdrawal from shares.
How much of a portfolio should sit in cyclical and defensive stocks depends on the horizon and the cycle phase, which is why matching defensive weight to withdrawal needs matters more than predicting each rotation.
Caution still carries a price:
- Opportunity cost if earnings broaden or the rotation reverses.
- Re-entry timing, which is hard to get right twice.
- Reinvestment risk, because the cash-rate advantage is cyclical and shrinks if the RBA cuts.
- Concentration within defensives, where a few large names dominate.
- Equity risk, because defensives are still shares.
If you are weighing the trade-off, five considerations help frame it:
- Keep emergency cash separate from your investment portfolio.
- Match your defensive weight to your time horizon and withdrawal needs.
- Rebalance to a set mix rather than predicting each rotation.
- Use staged re-entry instead of a single timing call.
- Compare after-tax cash yields with the expected return of defensive shares.
The week’s catalysts
| Region | Event | Prior or forecast | Why it matters |
|---|---|---|---|
| Australia | Flash PMI, later this week | Composite 51.3; manufacturing 49.6, services 51.9 | A tests whether domestic growth is holding |
| US | NAHB housing index | 31 (from 32) | Gauges US housing momentum |
| US | Initial jobless claims | Forecast about 199,000-200,000 | Signals labour market strength |
| US | Flash composite PMI | Forecast about 58.4 | Shapes global risk appetite |
No major announcements are scheduled for Wednesday or Thursday. Holding cash or defensives is a trade-off with a cost, and the right balance depends on your horizon and withdrawal needs rather than one session’s breadth.
Past performance does not guarantee future results, and forecasts are subject to change with market conditions.
What the rotation changes for positioning, and what it does not
The evidence supports cyclical caution on a concentrated, super-supported market. It does not confirm a bear signal.
Three variables will decide which way this resolves. The RBA’s November decision sets the cash-versus-shares trade-off. Breadth will either broaden back out or keep thinning. And China-linked commodity demand will determine whether miners rejoin the market’s leadership.
Your first review should be your own exposures. Check how much sits in banks and miners, whether your cash level reflects your needs or a market prediction, and whether your defensive weight matches your time horizon.
This article is for informational purposes only and should not be considered financial advice. Investors should conduct their own research and consult with financial professionals before making investment decisions.