Goodman Group’s 18% Pullback: Decoding the Metrics That Matter
43 mins ago

CSL Ltd opened 2025 as one of the ASX’s most widely held healthcare names, a blue-chip compounder with a multi-decade track record of earnings growth and dividend reliability. By mid-May 2026, the share price had fallen approximately 43%, settling near A$98 after touching intraday lows around A$93-94. The dividend yield, meanwhile, climbed to 4.04%, nearly three times the five-year average of 1.50%. Whether that yield expansion represents a generational buying opportunity or a warning about permanently diminished earnings power is the question currently dividing Australia’s most prominent fund managers and broker desks. This analysis examines the verified drivers behind the repricing, explains what the elevated yield actually signals, presents the bull and bear cases with named analyst evidence, and walks through a practical valuation framework for assessing CSL at current levels.
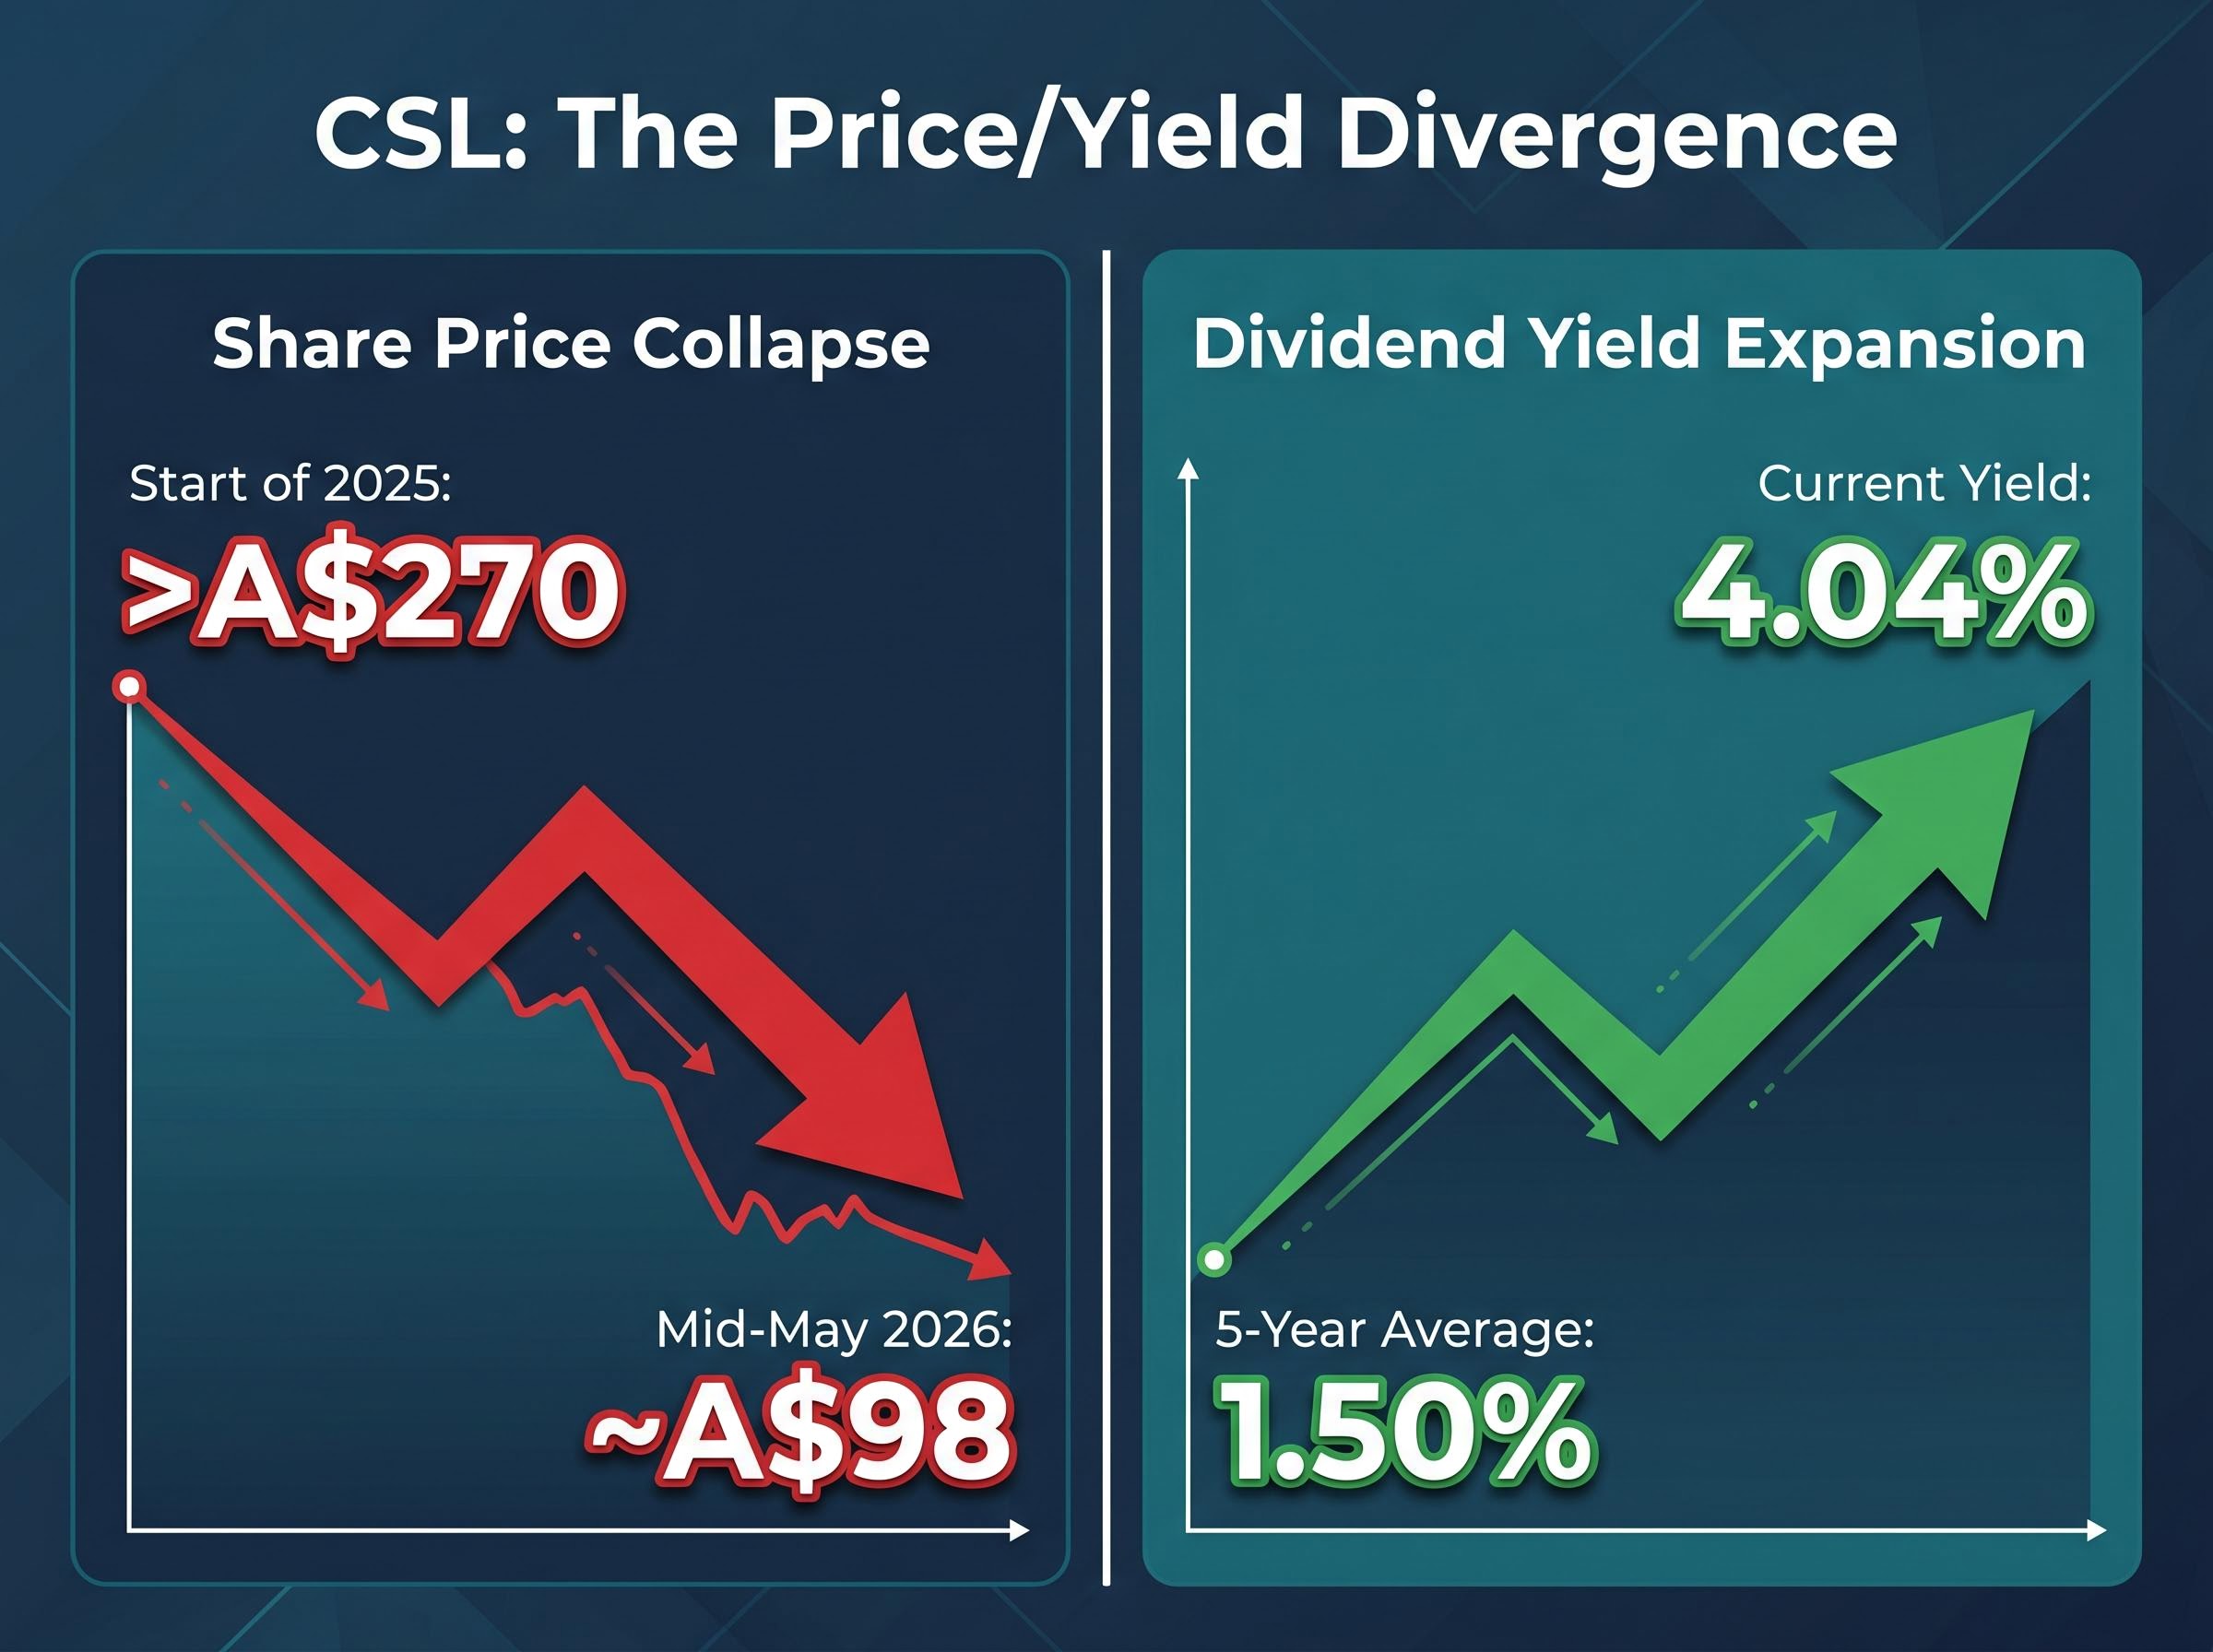
The scale of CSL’s decline is difficult to overstate. From a share price above A$270 at the start of 2025, the stock fell to approximately A$98 by 18 May 2026, a drawdown of roughly 43% that wiped the market capitalisation down to approximately A$47 billion. Intraday trading in May 2026 saw prices dip as low as A$93-94, levels not seen in years.
This is not a speculative small-cap. CSL operates three distinct business divisions:
The dividend yield has expanded to 4.04%, compared with a five-year average of just 1.50%. That divergence is the statistical fingerprint of a stock whose price has moved far faster than its fundamentals, in one direction or the other.
The question that matters is whether the price is telling investors something the earnings haven’t fully confirmed yet, or whether sentiment has overshot the reality of CSL’s business. The rest of this analysis is built around answering that question.
A dividend yield is a ratio: the annual dividend per share divided by the current share price. The same yield figure can arise from two entirely different causes:
Both scenarios produce a higher yield. Only one is unambiguously positive.
For investors screening for income opportunities, a yield that has expanded from 1.50% to 4.04% looks attractive at first glance. The distinction between yield driven by dividend growth and yield driven by price collapse is the difference between a stock that is paying more because it can, and a stock that appears to pay more only because its price has been cut.
CSL’s most recent full-year dividend was US$2.28 per share for FY2025, higher than the three-year average. The H1 FY2026 interim dividend was maintained, not cut. The dividend itself has trended upward.
The 4.04% yield is therefore predominantly a function of the share price falling from above A$270 to approximately A$98, not a management decision to lift the payout ratio. This makes the yield a marker of how far the price has fallen relative to a stable dividend. It demands a view on whether the price fall is justified before treating the yield as an income signal.
CSL’s decline was not a single shock. It was a sequence of reinforcing pressures, each of which made the next easier for the market to justify.
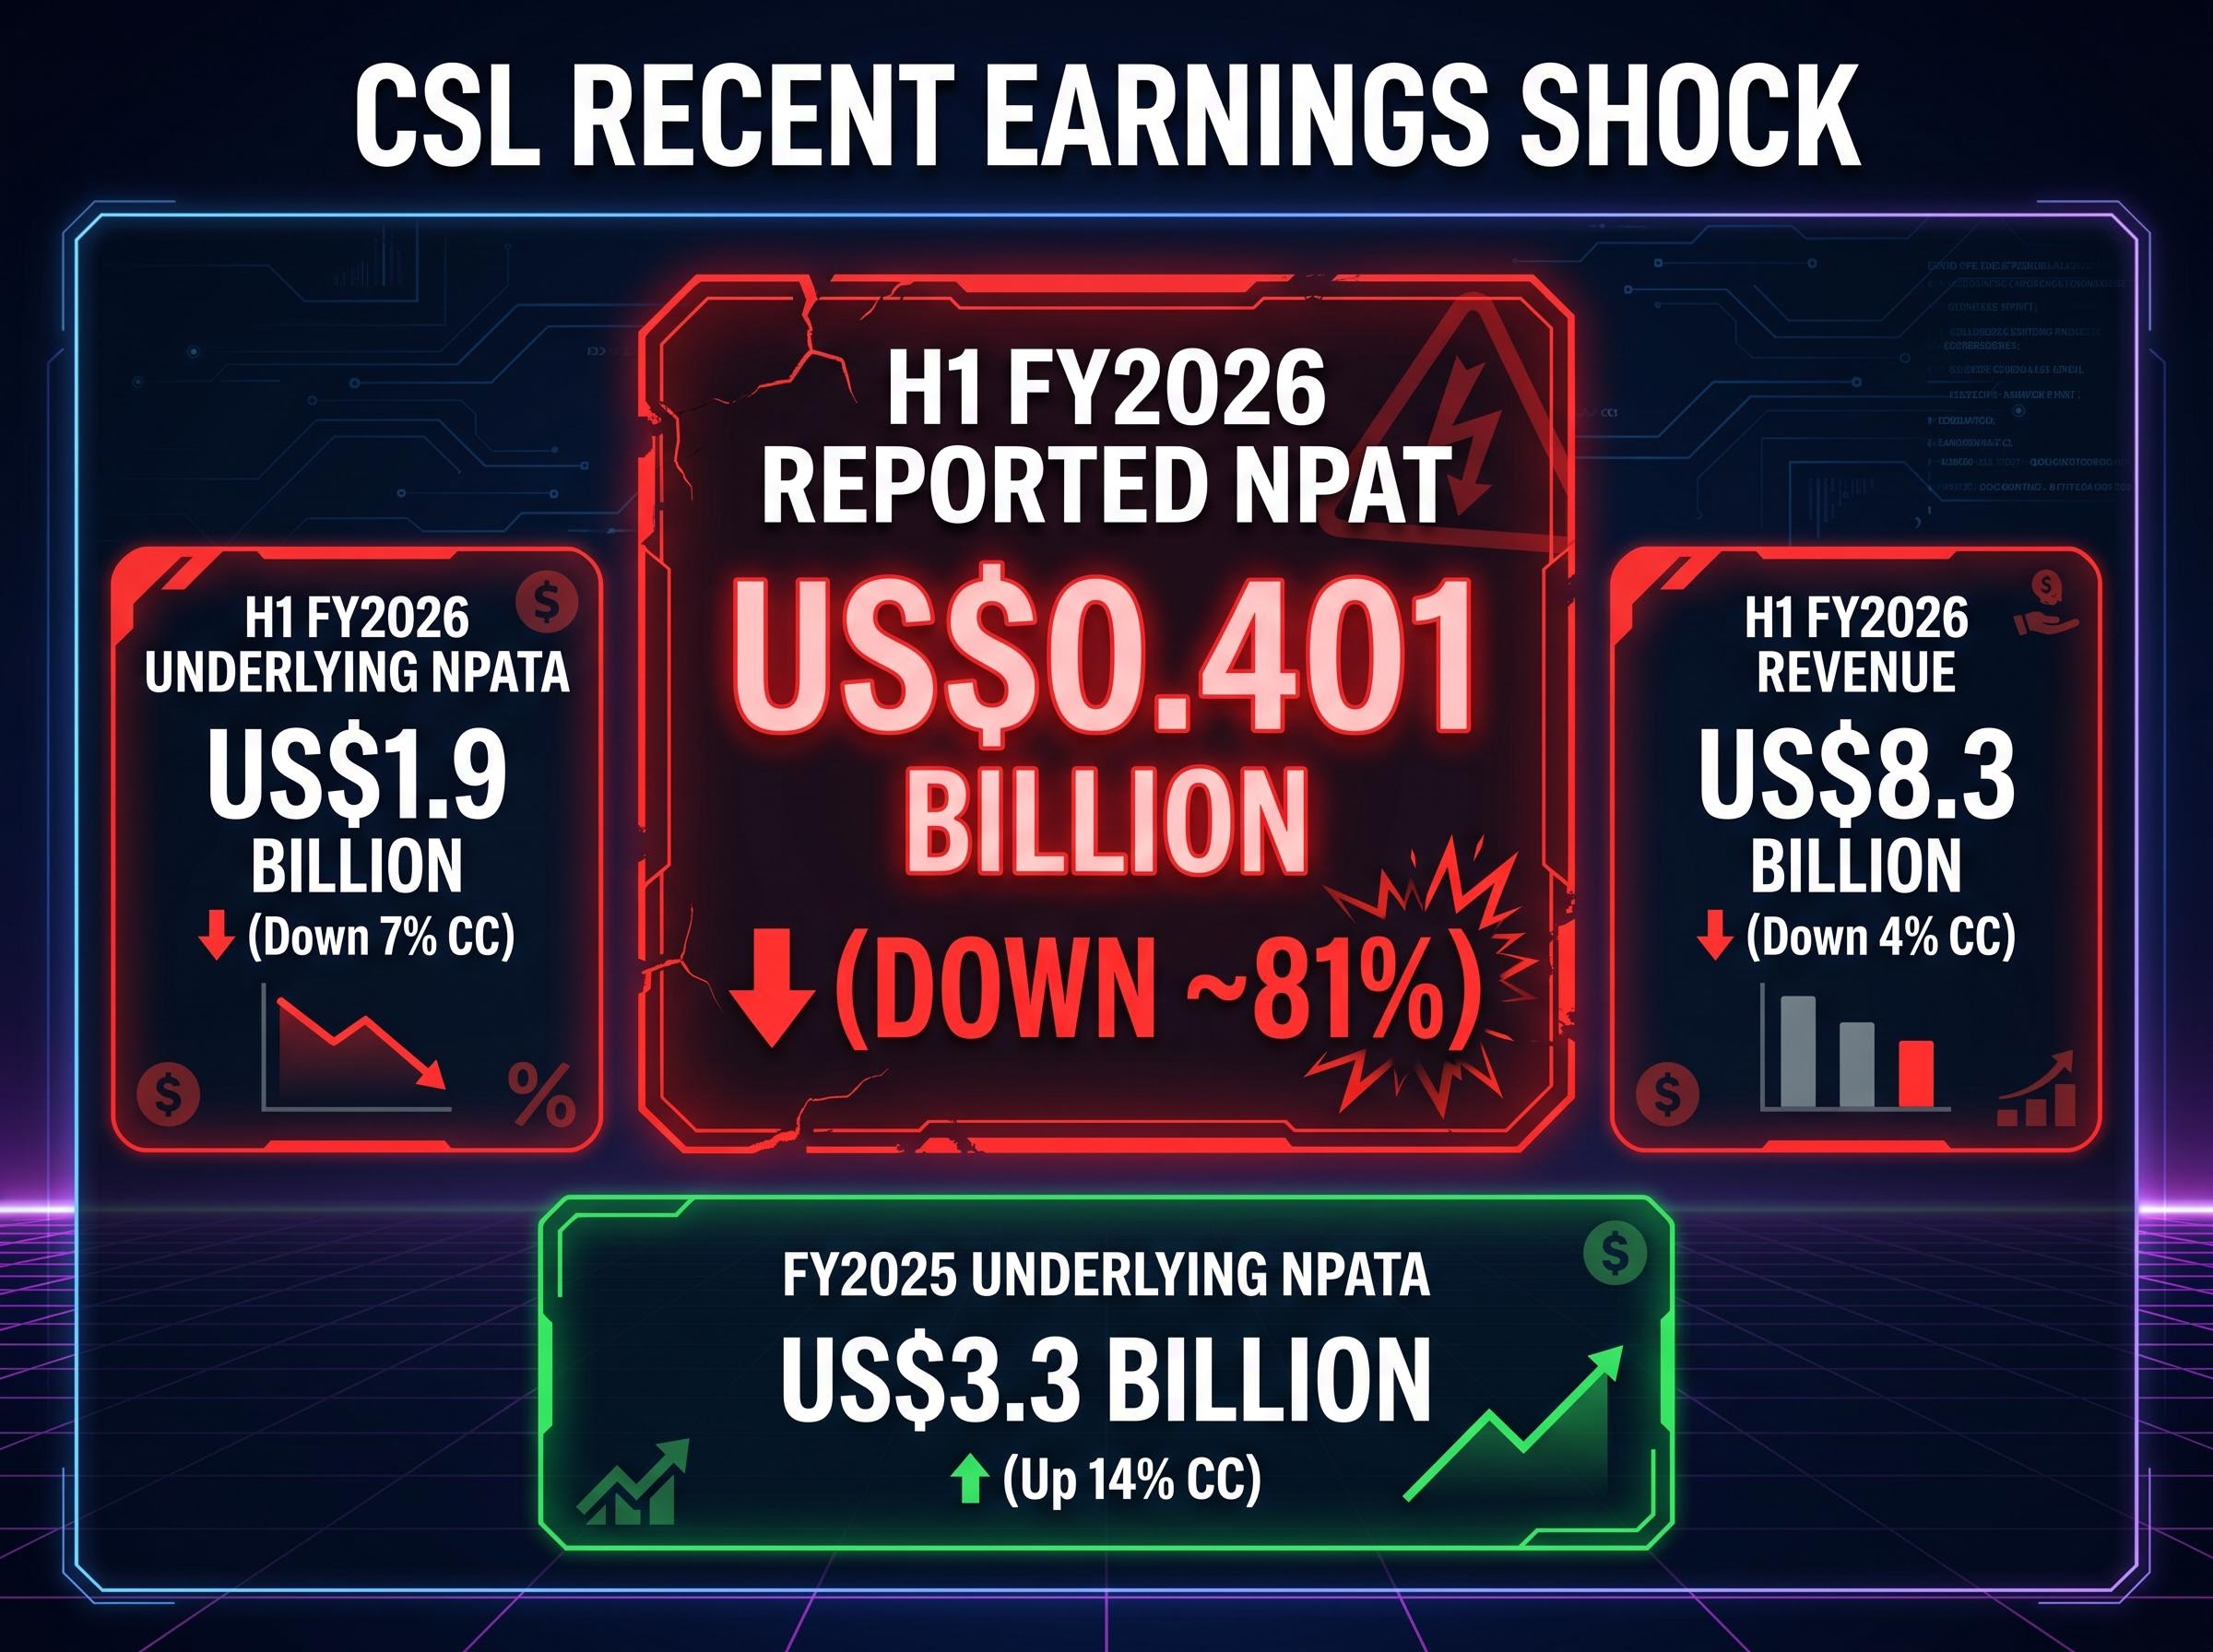
The most recent half-year results set the current baseline. H1 FY2026 (six months to 31 December 2025) showed revenue of US$8.3 billion (down 4% in constant currency), underlying NPATA of US$1.9 billion (down 7% in constant currency), and reported NPAT of just US$0.401 billion.
Reported NPAT fell approximately 81% in H1 FY2026, heavily impacted by impairment charges. That single figure captures the severity of the market’s concern more than any other data point in CSL’s recent history.
This followed a FY2025 full year in which underlying NPATA reached US$3.3 billion (up 14% in constant currency) and the dividend was US$2.28 per share. The deterioration between the full-year result and the subsequent half is where investor confidence fractured.
CSL’s May 2026 guidance downgrade, which triggered a single-session loss of approximately A$9.48 billion in market capitalisation and pushed the stock to a nine-year closing low of A$100.75, was the fourth guidance revision in approximately two years and the event that crystallised the bear narrative for many institutional holders.
FY2026 guidance called for high single to low double-digit NPATA growth, below market expectations for a mid-teens recovery. That gap between what the market wanted and what management offered widened the selloff.
| Driver | Classification |
|---|---|
| Plasma collection cost inflation | Cyclical |
| Seqirus earnings normalisation | Cyclical |
| Vifor integration and impairment charges | Potentially Structural |
| Cautious FY2026 guidance | Cyclical |
| Sector-wide de-rating and multiple compression | Cyclical |
| US reimbursement and regulatory risk | Potentially Structural |
The distinction between cyclical and potentially structural drivers is where the analytical difficulty lies. Plasma cost inflation and sector rotation may reverse. Vifor impairments and US reimbursement pressure may not. The ASX healthcare sector (XHJ) has delivered an annualised return of approximately -11.32% over five years, compared with the ASX 200’s 4.48% annualised return over the same period, confirming that the headwinds have been sector-wide, not CSL-specific alone.
Four of five major brokers covering CSL maintained Buy-equivalent ratings through 2025, with price targets that now imply 175-220% upside from the current level near A$98. The targets were set when the stock was materially higher, and none have been publicly confirmed as updated for the current price.
| Broker | Rating | 12-Month Target (A$) | Date of Call |
|---|---|---|---|
| Macquarie | Outperform | $310 | February 2025 |
| Morgan Stanley | Overweight | $305 | August 2025 |
| UBS | Buy | $295 | August 2025 |
| Ord Minnett | Accumulate | $285 | October 2025 |
| Citi | Neutral | $270 | September 2025 |
UBS characterised the decline as driven by de-rating rather than fundamental collapse. Morgan Stanley framed CSL as a high-quality defensive growth name capable of mid-teens earnings per share growth from FY2026. Fund managers from Magellan and Airlie Funds Management, quoted by Livewire Markets in September 2025, argued that the structural growth drivers remain intact and the selloff was a valuation compression event.
Institutional positioning in ASX healthcare tells a different story from the headline price declines: funds including AustralianSuper and Hostplus have been actively building exposure to global earners like CSL during the multi-year de-rating, characterising the selloff as a valuation reset rather than a structural collapse in earnings quality.
The long-term structural arguments underpinning the bull case centre on three factors:
US healthcare spending is projected to grow at approximately 7% annually through 2027, supporting the addressable market for CSL’s plasma and specialty therapy divisions. Virtually all positive commentary, however, is predicated on a three to five year investment horizon.
NIH research on global immunoglobulin demand growth identifies a 6-8% annual expansion in immunoglobulin use, driven by rising diagnosis rates for primary and secondary immunodeficiency disorders, a trajectory that underpins the bull case assumption that plasma therapy volumes will continue expanding regardless of near-term collection cost pressures.
The bear case is not a rebuttal of the bull case. It is a separate analytical lens that forces a different question: are the assumptions embedded in those broker targets still valid after what H1 FY2026 revealed?
For investors weighing whether the US reimbursement and regulatory risk facing CSL is cyclical or permanent, our full explainer on ASX healthcare structural risks examines the FDA staffing losses of more than 1,300 employees since 2025, the April 2026 ACIP governing rule changes that made FDA approval a necessary but no longer sufficient condition for US commercial success, and why these policy shifts carry no automatic cyclical reversal mechanism.
Intelligent Investor noted in September 2025 that CSL at a PE in the low 20s was “at the attractive end of fair value” rather than a deep bargain, with near-term volatility likely. The more pointed concern is anchoring: investors comparing today’s price to prior peaks or prior multiples may be using a profitability baseline that management itself has implicitly reset through impairments and lower guidance.
If CSL’s normalised return on equity has permanently declined, the current multiple may be fair rather than cheap. That is the question the reader must answer before treating the current price as a discount.
Two standard valuation tools apply here: a discounted cash flow (DCF) model, which estimates the present value of future cash flows, and a Dividend Discount Model (DDM), which values a stock based on expected future dividend payments discounted to today. Both require the same critical inputs, and the analytical challenge lies in which assumptions the investor selects.
Four inputs require stress-testing before any valuation conclusion:
CSL generated operating cash flow of approximately US$3.4 billion and free cash flow of approximately US$2.0-2.1 billion in FY2025. Those figures confirm the business generates real cash even in a period of earnings weakness, which is relevant for dividend sustainability and the DDM framework.
The five-year historical average yield of 1.50% provides a mean-reversion reference point. If yield normalises toward that average from 4.04%, through price appreciation rather than a dividend cut, the implied share price recovery would be substantial.
CSL pays dividends in US dollars. For Australian holders, an AUD-strengthening scenario compresses the yield and total return in local currency terms, even if the underlying business performs as expected. This is a layer of risk that does not appear in CSL’s financial statements but directly affects portfolio outcomes for Australian investors.
The bull and bear cases share a common structure. Both accept that CSL’s price has fallen dramatically, that the yield has expanded to historically unusual levels, and that H1 FY2026 results showed real earnings deterioration. Where they diverge is on a single question: is the margin and earnings compression cyclical, or structural?
If cyclical, the current price offers an entry point into a business with US$2.0-2.1 billion in annual free cash flow, a maintained dividend, and structural demand tailwinds that four of five major brokers still consider intact. If structural, the current multiple is not a discount but a re-rating to a permanently lower growth and return profile.
The gap between CSL’s current price of approximately A$98 and Citi’s A$270 target (the lowest of the five broker consensus) is 175%. That divergence quantifies how wide the distance has grown between where the market is pricing CSL and where professional valuation anchors sit.
The 4.04% yield is a function of price collapse against a maintained dividend. It is not a deliberate income strategy. That distinction changes how the yield should be weighted. The revenue and NPATA declines in H1 FY2026 (down 4% and 7% respectively in constant currency) are the current earnings trajectory that any accumulation thesis must navigate through.
The weight of named broker opinion sits on the opportunity side. The three to five year horizon qualifier attached to virtually every positive view is not cosmetic; it is a material condition. For investors with shorter timeframes or different liquidity needs, that qualifier changes the calculus entirely.
CSL’s leadership vacuum, a period of approximately 15 months without a permanent CEO appointment as of mid-2026, has been cited by multiple brokers as the single most important near-term catalyst for a sentiment and valuation recovery, separate from the operational questions around plasma margins and the Vifor integration.
This article is for informational purposes only and should not be considered financial advice. Investors should conduct their own research and consult with financial professionals before making investment decisions. Past performance does not guarantee future results. Financial projections are subject to market conditions and various risk factors.
CSL's share price declined approximately 43% from above A$270 to near A$98 due to a sequence of pressures including plasma collection cost inflation, Vifor impairment charges, four guidance downgrades in roughly two years, and a sector-wide de-rating of ASX healthcare stocks.
The 4.04% yield is almost entirely a function of the share price falling sharply against a maintained dividend, not a management decision to increase payouts; investors should assess whether the price decline is justified before treating the elevated yield as a straightforward income signal.
NPATA stands for Net Profit After Tax and Amortisation; CSL uses it to strip out amortisation of acquired intangible assets, which can be large following acquisitions like Vifor, giving investors a clearer view of underlying operating earnings.
Bulls point to maintained free cash flow of approximately US$2.0-2.1 billion, a stable dividend, ageing population tailwinds for plasma therapies, and broker price targets implying substantial upside; bears argue that Vifor integration costs, structurally higher plasma collection expenses, and US reimbursement risk could justify a permanently lower earnings multiple.
CSL reports earnings and pays dividends in US dollars, so if the Australian dollar strengthens against the US dollar, AUD-based investors receive less in local currency terms even if the underlying business performs as expected.