Crude is trading in triple digits after the worst Strait of Hormuz disruption in recorded history, and most of the commentary still calls it a geopolitical premium. That framing treats the spike as weather: unpleasant, temporary, certain to pass. The data suggests something closer to a structural repricing that the market has not finished absorbing.
Three risk layers are now active at once. The Strait, the world’s most important energy chokepoint, was effectively closed during the war with Iran in March 2026. The US Strategic Petroleum Reserve sits at roughly 39.7% of its authorised capacity. And US shale, the backstop that was supposed to cap any spike, is running into geological limits that blunt its ability to respond quickly.
Each of those problems has a textbook policy answer when it arrives alone. The trouble is that they have not arrived alone.
This piece gives you a working framework for judging whether current crude prices reflect the actual distribution of risk, and the specific signals that would tell you the market is starting to catch up to the physical reality. The goal is not a price forecast. It is a way to read the gap between the two.
The Strait of Hormuz closure and what the history books missed
The March 2026 closure deserves to be treated as the event it was, not as headline colour. Reuters characterised the wartime episode as the worst disruption to oil and gas supplies in history. That is a high bar, and the Strait clears it.
The Hormuz shipping crisis illustrates precisely why diplomatic declarations and physical normalisation are different things: commercial transits collapsed to 3-14 vessels per day against a pre-war baseline of 120-140, and war-risk insurance premiums running at roughly 30 times normal rates mean a ceasefire announcement alone cannot restore flows.
Reuters characterised the March 2026 wartime closure of the Strait of Hormuz as the worst disruption to oil and gas supplies in history.
Consider what normally moves through. In 2024 and the first half of 2025, roughly 20 to 20.9 million barrels per day of oil transited the Strait, around 25-27% of global maritime oil trade, alongside approximately 11.4 billion cubic feet per day of LNG. Shut that corridor and you are not trimming supply at the margin. You are removing a quarter of the seaborne crude market.
The escalation was visible well before the closure. In April 2024, Iranian forces seized a Portuguese-flagged vessel using small boats and helicopters. By August 2025, a US Maritime Administration advisory was warning commercial ships of boarding, detention and seizure risk in the Strait and the Gulf of Oman.
Four crises, one repeated assumption
What makes this moment feel less like a surprise and more like an endpoint is the pattern that preceded it. Each prior scare taught the market the wrong lesson.
- 1973-74 Arab oil embargo: Showed how fast prices spike when inventories are low and spare capacity is concentrated. It did not resolve the question of what a full chokepoint closure would do.
- 1979 revolution and the 1980-88 Iran-Iraq War: Demonstrated that simultaneous disruptions across producers generate multi-year volatility, not a brief shock. The lesson was logged, then filed away.
- 2011-2012 Iranian sanctions: Threats to close Hormuz raised the risk premium, but flows largely continued. This is the most dangerous precedent, because near-miss-with-no-closure became the default reference point analysts used to price the next threat.
- 2022 European energy crisis: Proved a massive supply removal spikes prices fast, while also showing demand adaptation and stock releases can eventually dampen them.
Every one of those episodes reinforced the same quiet assumption: full closure was theoretically possible but practically unlikely. That assumption compounded into systematic underpricing of a tail that has now arrived.
Here is where the real analytical work begins. Even with the worst disruption in history underway, Brent traded in a $103.83 to $114 range and WTI between $92.12 and $100.67. Those are elevated prices, not panic prices. The market was still assigning meaningful probability to a quick resolution, which tells you the gap between price and physical reality remains open, and that gap is the thing worth watching.
When big ASX news breaks, our subscribers know first
What the SPR can and cannot do at 283 million barrels
The Strategic Petroleum Reserve is the obvious answer to a supply shock. It exists, it has been drawn on before, and it worked. The surface reading is reassuring until you look at what is actually left in the caverns.
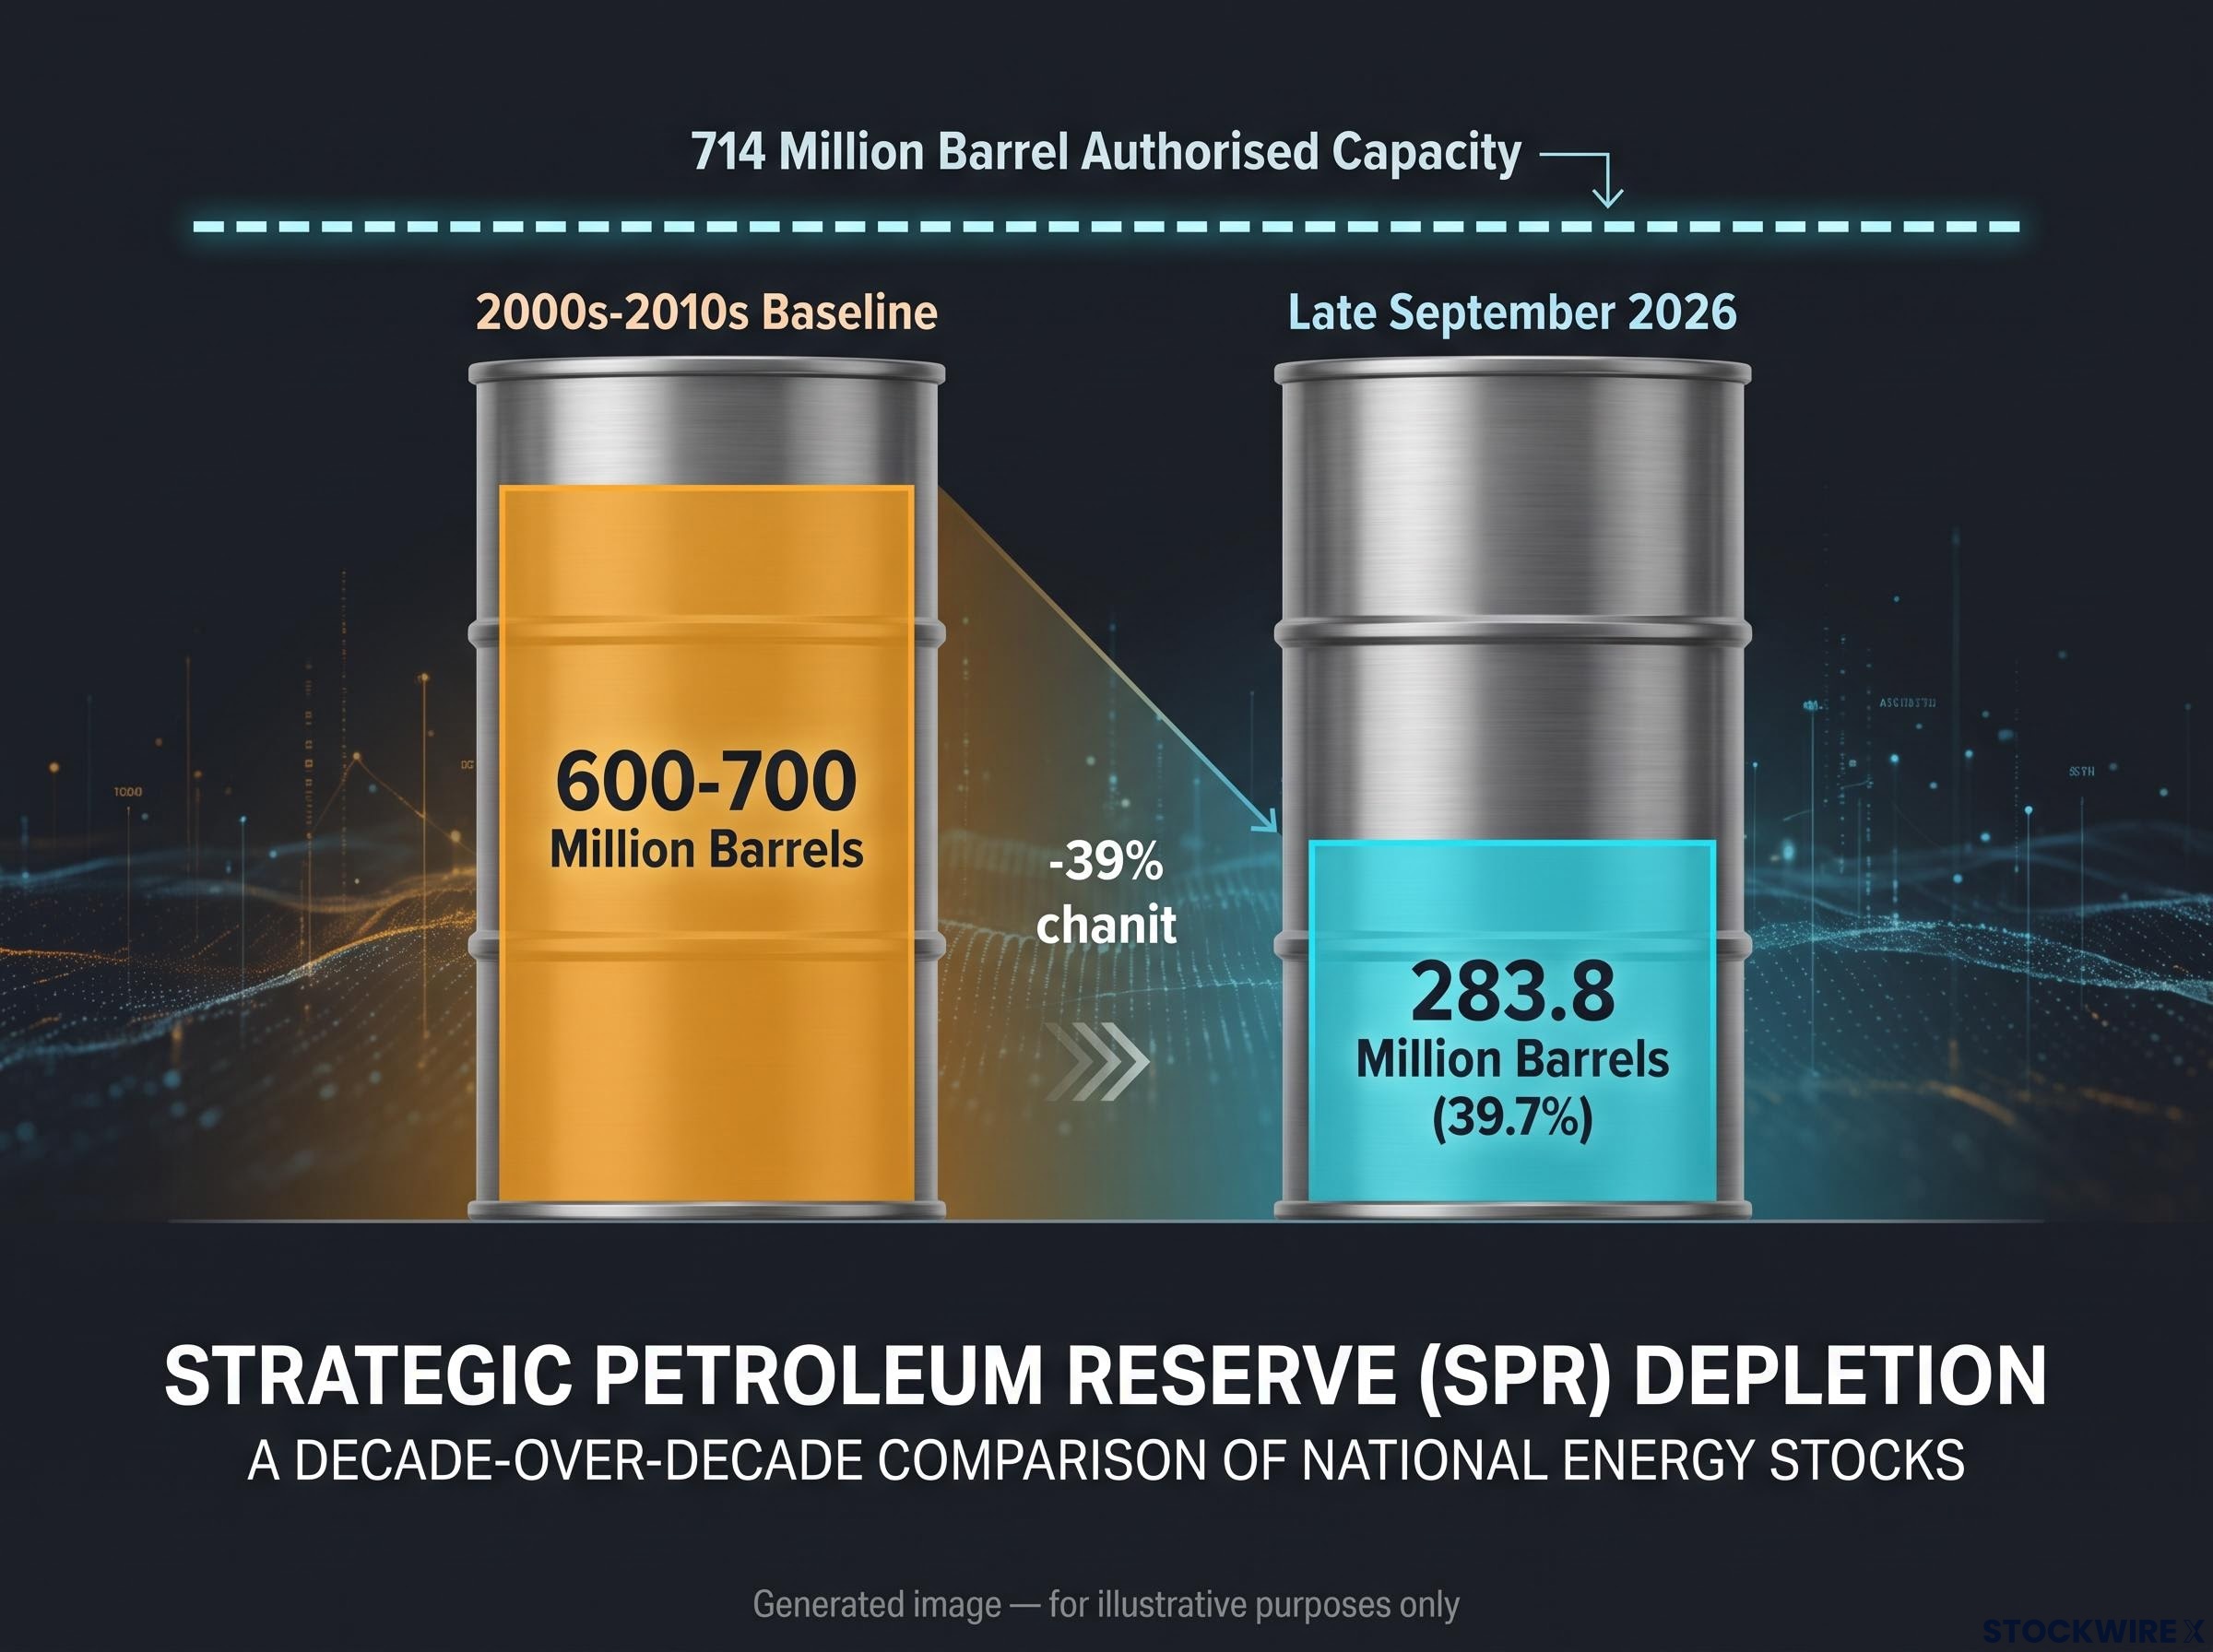
As of late September 2026, the SPR held approximately 283.8 million barrels, about 39.7% of its 714-million-barrel authorised capacity. Through the 2000s and 2010s, the reserve typically carried 600-700 million barrels. The instrument available to policymakers today is roughly half the size of the one they relied on through prior crises.
US crude stockpiles fell to 404.5 million barrels in late July 2026, with total combined commercial and SPR holdings dropping to the lowest combined buffer since 1984, a data point that frames the SPR’s 283.8-million-barrel level not as an isolated policy choice but as part of a broader system-wide inventory contraction.
| Period | SPR Level | % of Authorised Capacity | Primary Constraint |
|---|---|---|---|
| 2000s-2010s baseline | 600-700M barrels | ~84-98% | Few. Reserve near design capacity |
| Post-2022 drawdown | Sharply reduced from baseline | Declining | Depletion begins to limit response size |
| Late September 2026 | 283.8M barrels | 39.7% | Testing operational minimums |
The headline barrel count also overstates the usable buffer, because the constraints are operational, not just volumetric:
- Withdrawal speed: Delivery depends on cavern integrity, pipeline connections and receiving facilities. If Gulf Coast export or refining assets are under threat, actual flow to market slows regardless of how much oil is in storage.
- Quality mismatch: Years of storage and prior drawdowns have left inventory skewed toward heavier and sour crudes. That reduces their substitutability for the light sweet Middle Eastern grades now missing from the market.
- Political and legal sequencing: Large releases require presidential action and often coordination with Congress or allied nations, which adds delay.
- OPEC+ signalling risk: Emergency use can read as distress to large producers, potentially prompting supply policy responses or expectations of future replenishment buying that support prices rather than suppress them.
The original source credits the reserve with real impact during the earlier Strait closure, estimating that without it, crude could have reached multiples of its actual levels. That is the paradox: the SPR mattered enormously precisely when it was being spent down toward the level it now sits at.
If you know only the barrel count, you will overestimate how much cushion remains. The effective buffer is smaller and slower than 283.8 million barrels implies, and that distinction changes how a shock would propagate into refined product prices.
Why shale cannot be the swing producer it once appeared to be
Give the bull case its due first, because the numbers are genuinely strong. US crude production averaged roughly 13.939 to 13.944 million barrels per day in mid-September 2026, a year-over-year gain of approximately 438,000 to 462,000 barrels per day. On paper, American output has never been higher.
The efficiency story behind that record was real. Through roughly 2015 to 2022, operators drilled wells faster, pushed laterals longer and pumped more sand and fluid per foot. Doing more with less offset per-foot productivity declines and kept headline output climbing even as rig counts fell.
The efficiency gains that cannot be repeated
The problem is that each of those levers is now flattening. The EIA projects production will plateau or grow only modestly, averaging near 13.8 million barrels per day in 2026, and the deceleration signals sit underneath the aggregate:
- Declining well productivity: Early signs in top-tier fields show wells declining faster and new wells delivering lower initial output.
- Geological maturity: The thickest, most oil-saturated sweet spots are increasingly saturated with wells, leaving marginal acreage that yields less.
- Parent-child well interference: Aggressive infill drilling near older wells causes pressure interference, reducing recovery from both.
- Diminishing technical returns: Longer laterals and heavier sand loading have reached a threshold where incremental gains are flattening.
- Cost inflation: Post-2021 inflation in labour, pressure-pumping, tubulars and services has eroded the economic benefit of technical efficiency and raised breakeven costs.
The two most consequential constraints are parent-child interference and sweet-spot saturation, because neither can be engineered away. They are features of the rock.
SPE research on parent-child well interference documents how fracture interference and cross-well communication cause child wells to systematically underperform, providing the technical foundation for why aggressive infill drilling near producing wells reduces rather than adds to overall recovery.
Baker Hughes data shows 455 active oil rigs as of late September 2026, against a 2022 peak of roughly 750. The original source estimates approximately 200 additional rigs would be needed to meaningfully grow production into a shock, a mobilisation that requires sustained higher prices before it even begins.
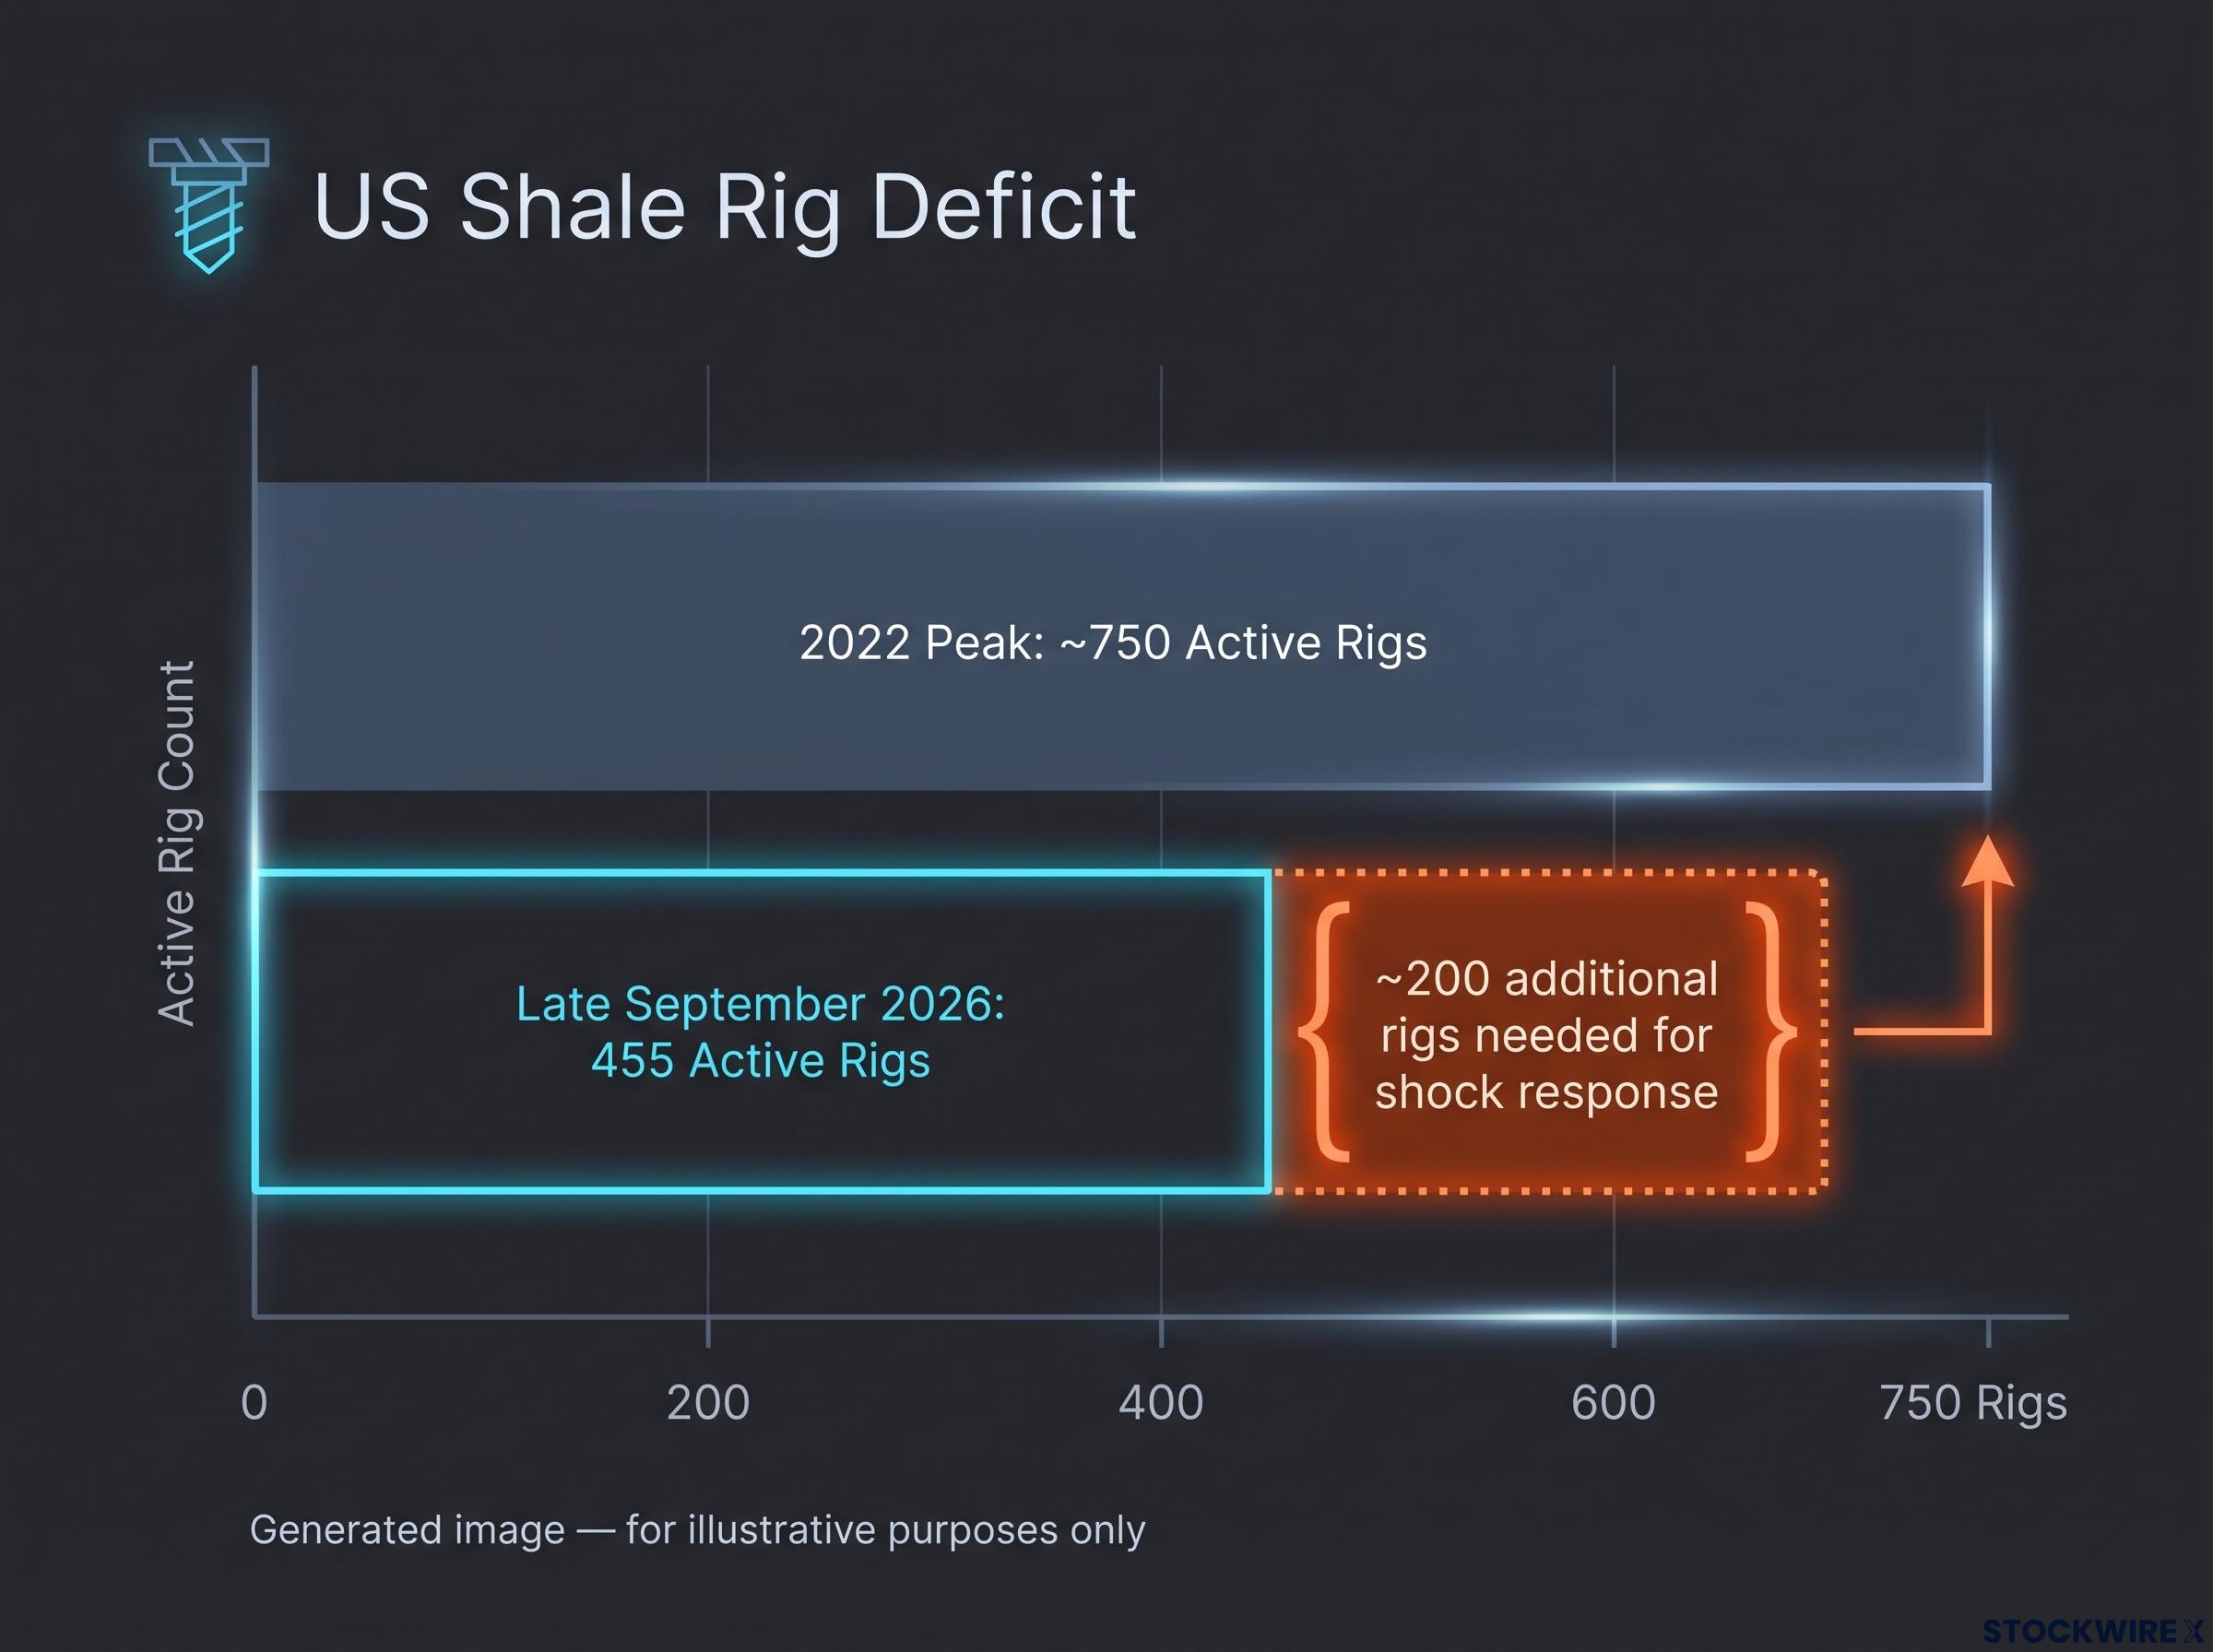
That rig gap is the crux of the swing-producer problem. A fleet of 455 active oil rigs cannot be scaled by 200 overnight. Rebuilding that capacity takes crews, equipment and, above all, a sustained price signal that persuades operators the higher level will hold.
The gap between headline production and marginal capacity is what matters here. Shale’s role as a shock absorber rests on assumptions about drilling responsiveness and geological productivity that are materially weaker today than in 2018-2019, when the swing-producer narrative took hold. The backstop still exists. It is just thinner at exactly the margin that would be tested.
How the three risk layers compound rather than add
This is where the three pictures become one. Taken separately, each risk has a response. A Strait disruption has an SPR release. A depleted SPR has a shale ramp. A slow shale sector has, in theory, the SPR. The problem is that in the current configuration, each backstop is disabled by the simultaneous failure of the others.
Walk the sequence:
- A Strait disruption removes a quarter of seaborne crude at once, demanding an SPR response large enough to matter.
- An SPR at 39.7% capacity cannot deliver that scale quickly, which shifts the burden to shale.
- Shale cannot mobilise in weeks, which removes the medium-term ceiling the market assumes will cap the spike.
That is why two bad things at once is categorically different from one bad thing twice. The responses do not stack. They cancel.
The refinery margin transmission channel
The mechanism that pushes crude pressure into consumer prices faster than usual runs through refining margins. During the peak period, refinery margins on diesel reached roughly $100-120 per barrel, and those fat margins let refiners stay profitable on tighter crude supply, absorbing some of the shock.
Refinery margin transmission from crude into consumer prices has been running at extreme levels, with diesel crack spreads at $80-100 per barrel, four to five times the historical norm, confirming that a large portion of current fuel price inflation is sitting in the refining layer rather than in crude costs alone.
But that buffer is directional and exhaustible. If refineries run above seasonal utilisation to cover product shortages, they consume more crude at exactly the wrong moment. Margins can compress toward $20-50 per barrel, and the price pressure that was sitting in the margin passes straight upstream into crude.
The EIA’s March 2026 forecast projected an average WTI price of $51 per barrel for 2026. The original source outlined a scenario in which WTI reaches $150-170 per barrel. Those are the two poles of the forecast distribution.
Treat the higher figure as a structural possibility, not a tail-risk fantasy. The 1973-74 and 1979-1980 episodes both show compounding disruptions producing multi-year volatility rather than short-lived spikes, which is precisely the regime a negated policy toolkit invites.
The spread between $51 and $170 is not noise. It is the market telling you the range of plausible outcomes is genuinely wide, and any plan that assumes outcomes cluster near the midpoint is quietly taking on uncompensated tail risk.
Historical oil shock equity returns across the 2008, 2011, and 2022 episodes show S&P 500 performance well below its long-run average in the 12 months following crude crossing $100 per barrel, a pattern that gives context to why the forecast range between $51 and $170 carries asymmetric implications for broader portfolio positioning.
What a credible oil price shock scenario actually requires you to watch
You now have the framework. What you need are the signals that would confirm the compounding thesis is building rather than releasing, so you can act on the analysis without pretending to know where crude lands.
Four variables do most of the work:
- SPR release pace and remaining capacity: Watch how fast barrels leave the 283.8-million-barrel level. Rapid drawdown against a thin base tells you the primary buffer is being spent, not replenished.
- Baker Hughes rig count trajectory: Track the 455 active oil rig figure over rolling 8-12 week windows. A sustained climb toward the needed mobilisation signals shale is responding; a flat line says the ceiling is still missing.
- Brent-WTI spread: Watch it as a read on physical tightness versus paper markets. Widening in favour of waterborne crude points to genuine scarcity rather than speculative positioning.
- Tanker rates through the Strait and alternative routes: Rising rates and rerouting confirm the chokepoint risk is live rather than priced out.
The mainstream dismissal deserves a fair hearing. The EIA’s $51 per barrel base case is not irrational given record production. But the scenario analysis here is asymmetric: being wrong about a $51 outcome is manageable, while being wrong about a $150-170 outcome is not.
The deeper point is that none of this resolves in a single season. Shale geological maturity, SPR depletion and Strait vulnerability are medium-term structural conditions, not event-specific risks that dissipate when the geopolitical temperature drops.
Tracking these variables is not a prediction. It is the honest position when the forecast range runs from $51 to $170: monitor whether the compounding conditions are tightening or easing, and let that, not a number you picked in advance, guide the decisions that depend on energy costs.
This article is for informational purposes only and should not be considered financial advice. Investors should conduct their own research and consult with financial professionals before making investment decisions. Past performance does not guarantee future results. Financial projections are subject to market conditions and various risk factors. The price scenarios discussed are speculative and subject to change based on market developments.