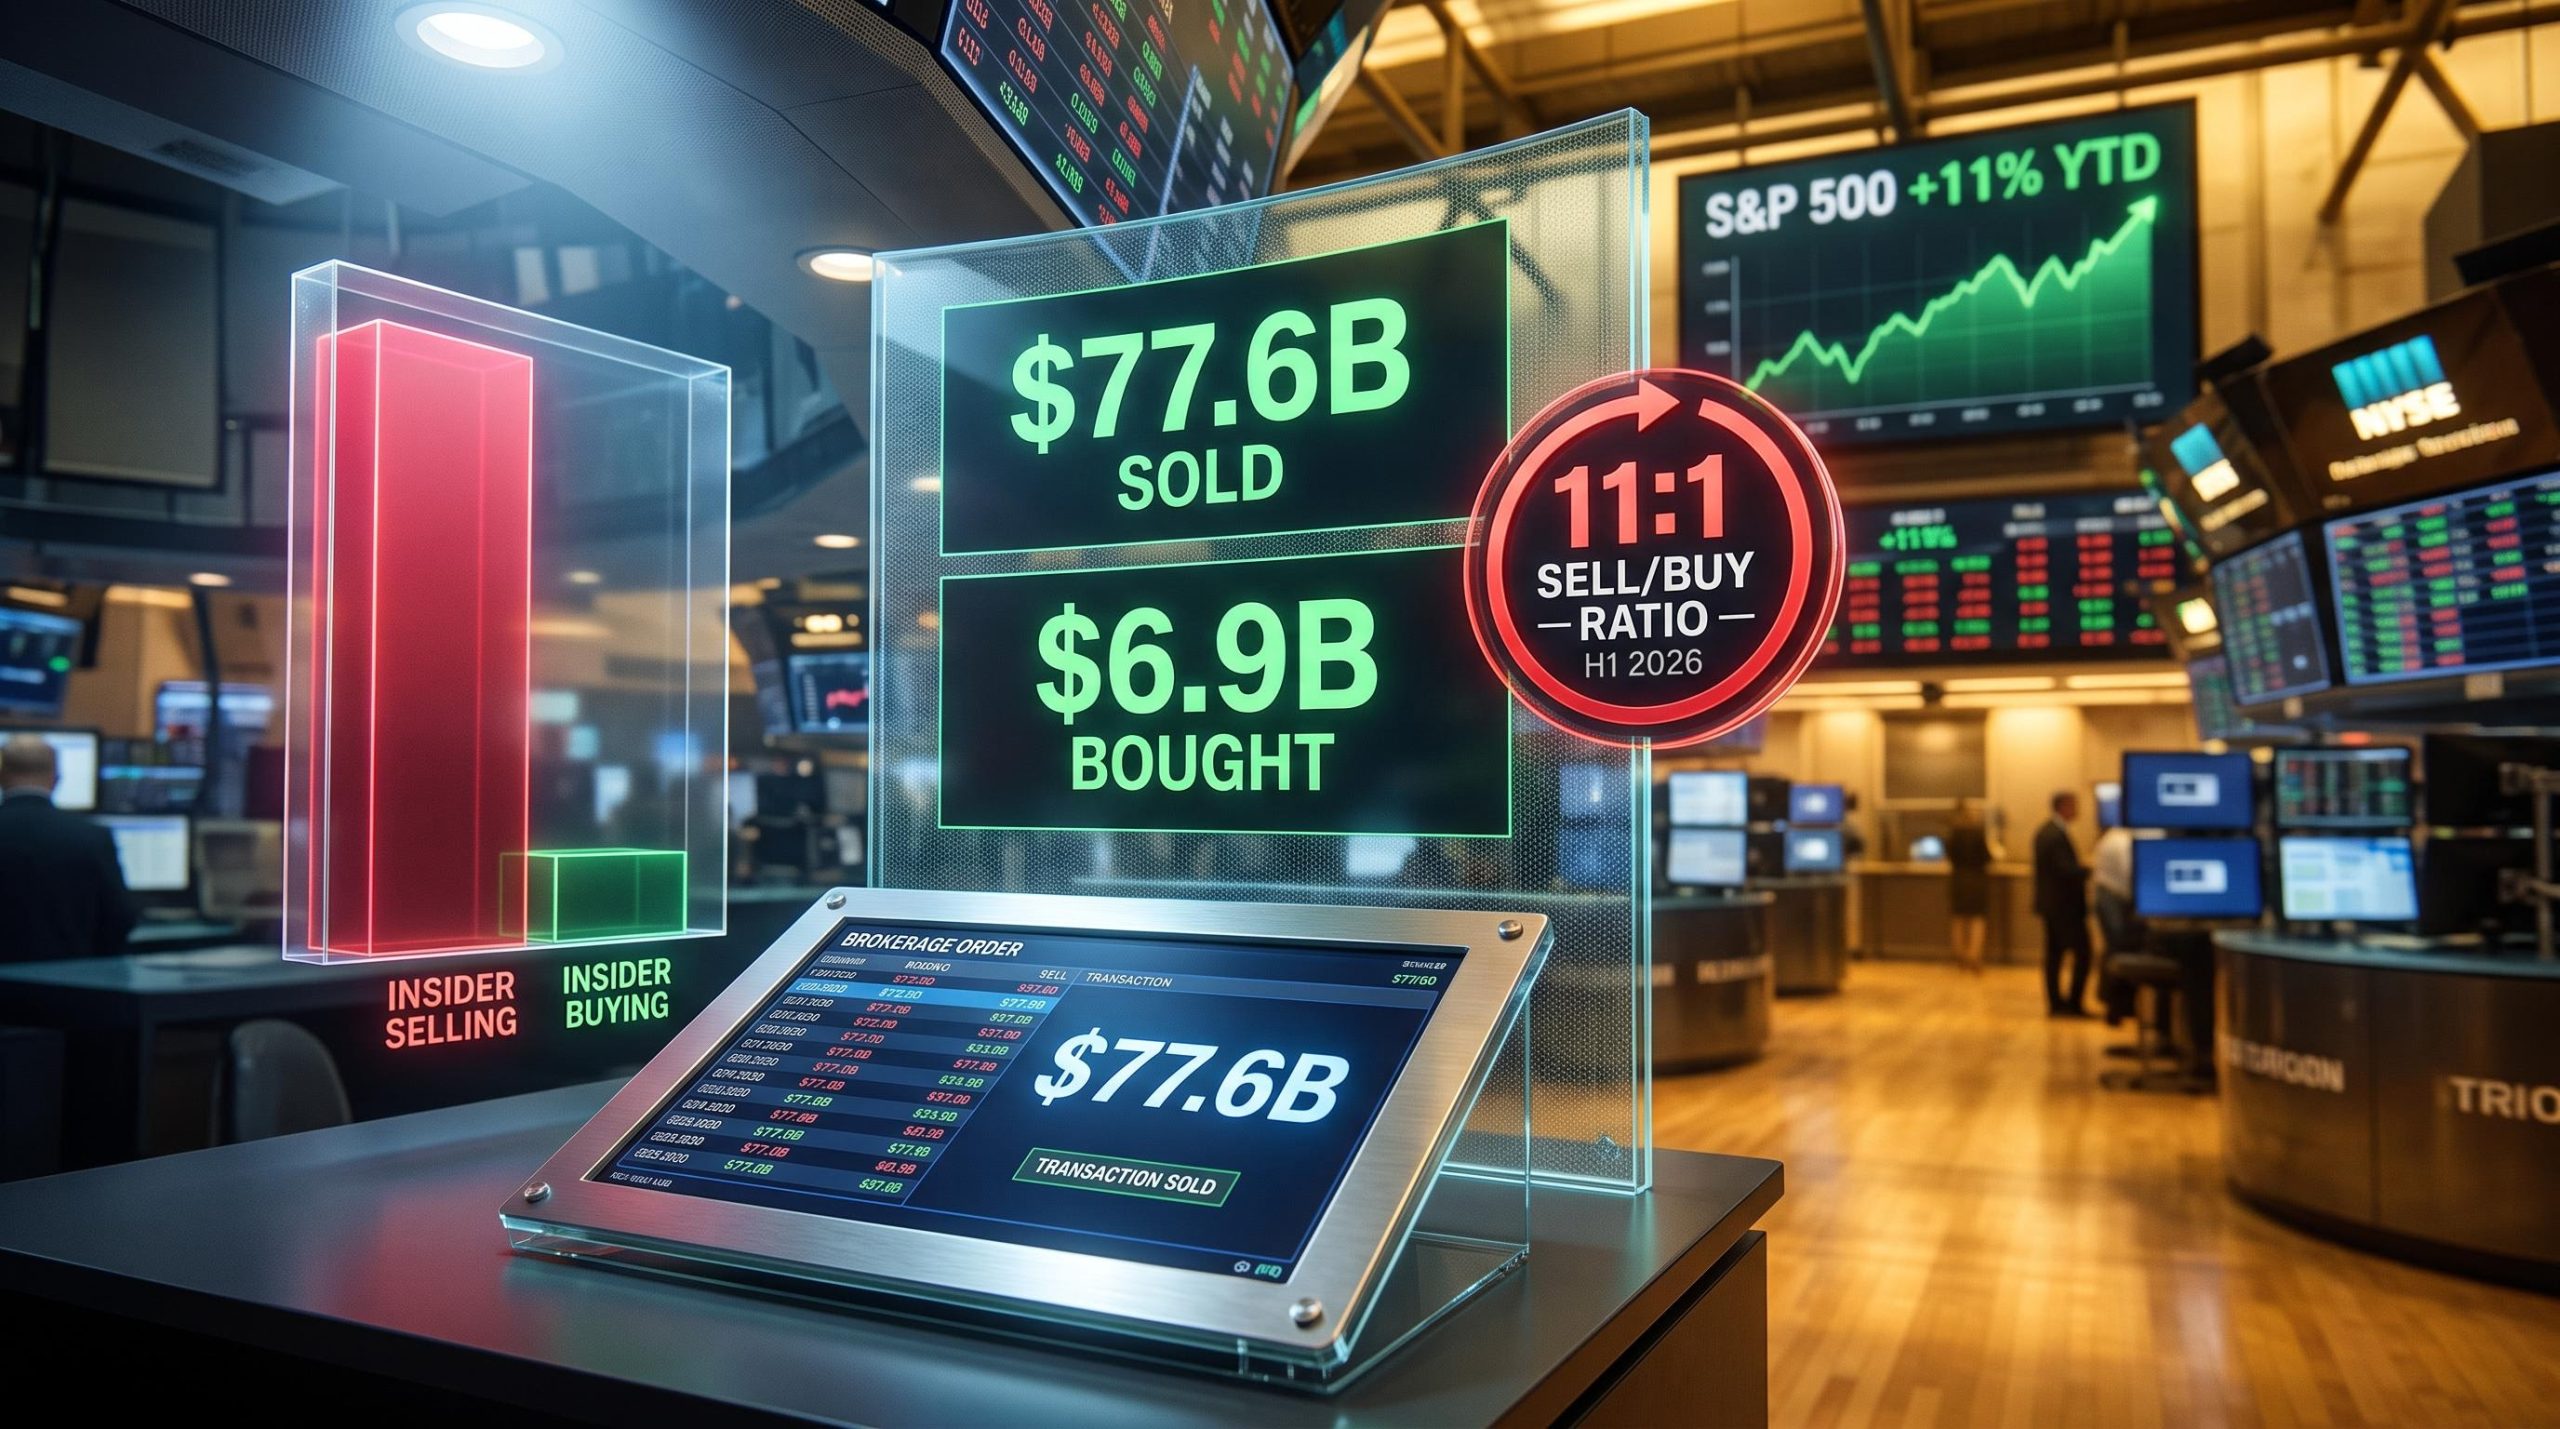
In the first half of 2026, US corporate insiders sold roughly $11 of their own stock for every $1 they bought. That is not a typo.
The ratio is striking on its own, but the backdrop makes it more so. The S&P 500 is up approximately 11% year-to-date, sitting near record levels, and the people with the deepest visibility into corporate fundamentals, the executives who see the order books, the margins, and the capital spending plans before anyone else, are using that strength to exit, not to add.
Here is a framework for reading informed-money behaviour as a risk-reward barometer, using the current data as the working case study, and a practical way to separate genuine signal from routine noise in the months ahead.
The numbers behind the sell-off insiders do not want to talk about
According to EPFR and Bloomberg data, US corporate insiders offloaded approximately $77.6 billion worth of shares in the first six months of 2026, representing a 20% rise compared with the same period a year earlier. That rate of disposal ranks as the second-highest on record over the past two-plus decades, surpassed only by the frenzied selling seen at the stimulus-driven market peak in 2021.
On the other side of the ledger: purchase activity amounted to just $6.9 billion, only a marginal step above the $6.7 billion seven-year low that insiders reached in 2025. The implied sell-to-buy ratio sits at approximately 11:1.
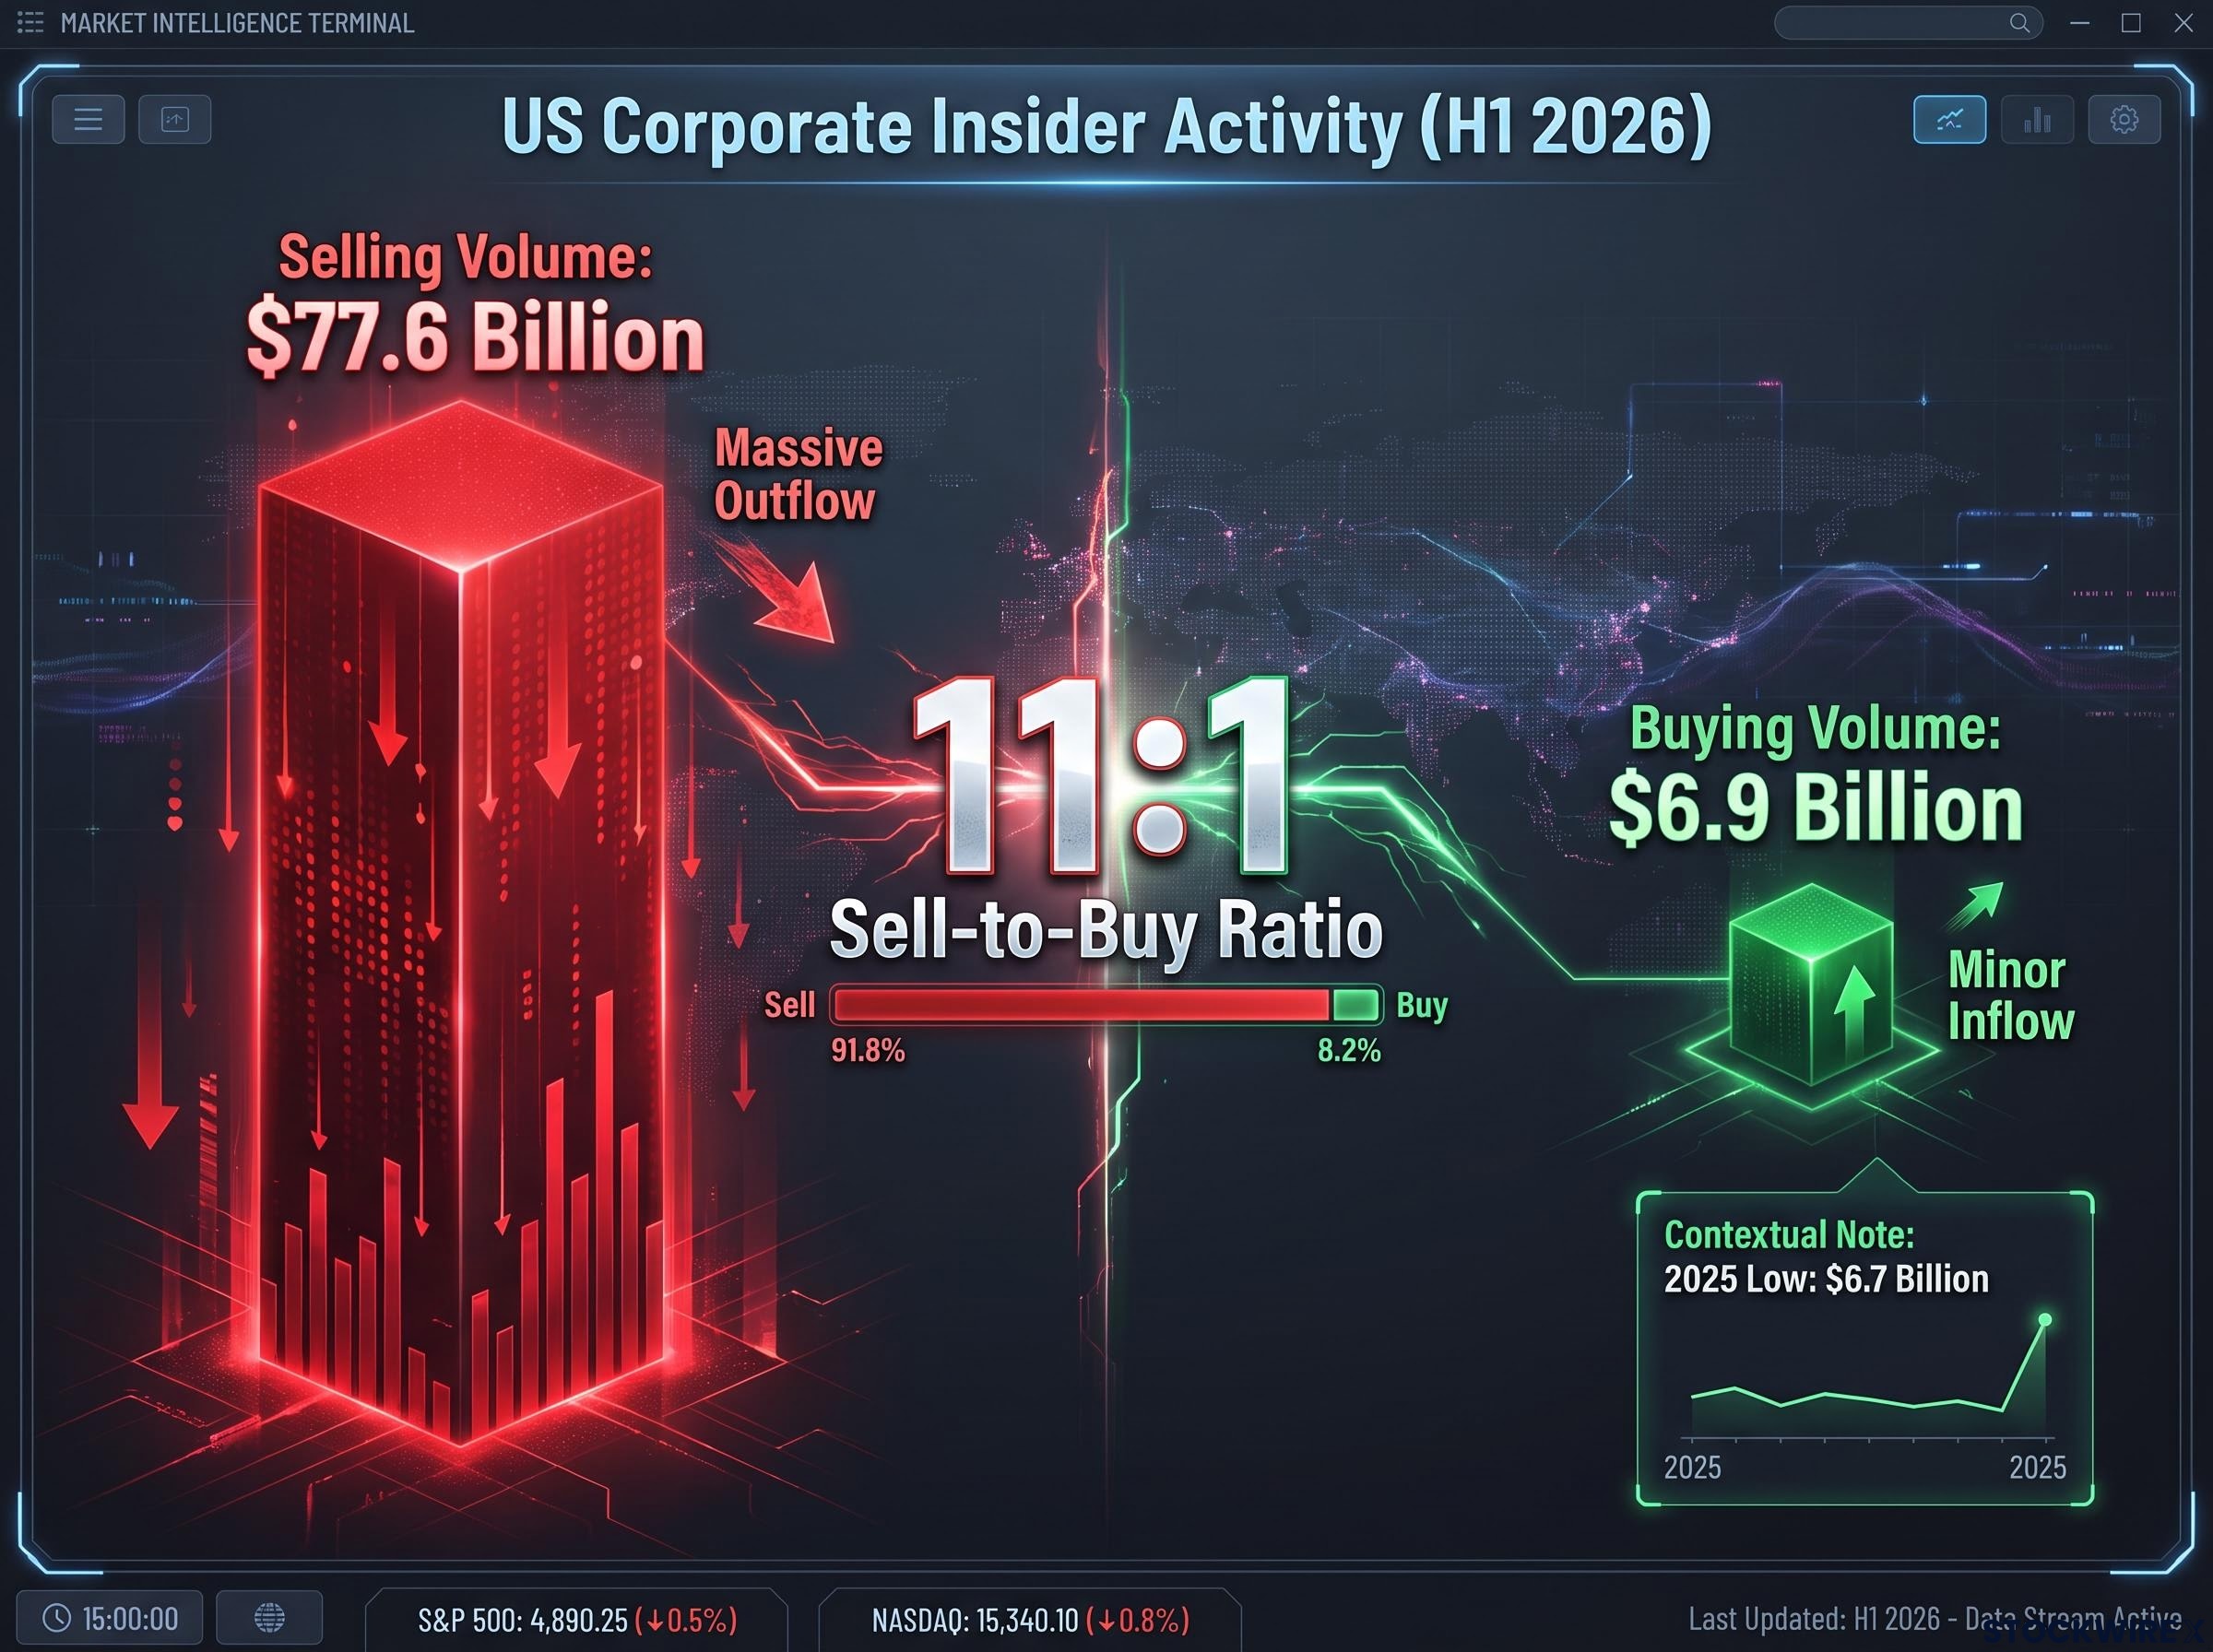
EPFR data points to a marked reluctance among corporate executives to add to their personal equity positions given current market valuations.
To appreciate the scale, consider how the current numbers compare with recent precedent.
| Period | Selling Volume | Buying Volume | Implied Sell/Buy Ratio |
|---|---|---|---|
| H1 2021 (stimulus peak) | Highest in 20+ years | Moderate | Elevated, but offset by stronger buying |
| Full year 2025 | Below 2026 pace | $6.7B (seven-year low) | High |
| H1 2026 | $77.6B | $6.9B | ~11:1 |
The 11:1 ratio is not ambiguous noise. When buying sits at a near-decade low while selling surges, executives are collectively making a directional statement about how they perceive the risk-reward available in their own companies’ stock.
When big ASX news breaks, our subscribers know first
What insider buying and selling actually measure (and what they do not)
Insider sales always carry noise. Pre-set 10b5-1 plans, which are regulatory-approved schedules that allow executives to sell shares on autopilot according to pre-determined rules, generate a constant stream of disposals that have no informational content about a company’s prospects. Diversification needs, tax obligations, and estate planning produce the rest.
The buying side is fundamentally different. There are very few non-fundamental reasons for an executive to deploy personal cash into stock they already hold at high valuations. You do not buy more of something at all-time highs for tax reasons. You buy because you believe it is undervalued.
That asymmetry is what makes the near-seven-year low in buying, $6.9 billion, the most analytically significant number in the entire dataset.
The Pfizer case illustrates how much insider buying signals can diverge from headlines: only one confirmed director-level open-market purchase appears in public Form 4 filings, while net activity over the most recent 90-day window shows selling, not accumulation, despite the stock trading near multi-year lows.
Signal strength varies depending on the type of insider activity:
- Open-market purchase near all-time highs: high signal; indicates genuine conviction
- Large, unsolicited buy by a CEO or board member: high signal; reputational and financial skin in the game
- 10b5-1 plan execution on schedule: low signal; pre-set and routine
- Post-lockup sale by a founder with concentrated holdings: moderate signal; diversification motive is legitimate
Why buying tells you more than selling
EPFR data indicates that executives have shown little appetite for increasing their personal equity exposure even as markets have pushed higher. When the people who know these companies best will not buy their own stock at current prices, that absence of conviction is itself a form of negative guidance. It tells you that the information advantage these executives hold is not producing a bullish conclusion, even in a market delivering double-digit returns.
The IPO market is sending the same message from a different angle
The insider signal does not exist in isolation. The 2026 IPO market offers a second, independent confirmation from a different part of the capital markets.
By 16 July 2026, companies that listed during the year had collectively raised approximately $157 billion in proceeds. Yet their weighted average return through 15 July stood at only around 6%, a figure that falls well short of the S&P 500’s approximately 11% advance over the same window. Most US companies that made their market debut in the two months leading up to mid-July were changing hands below what they priced at.
Structural IPO underperformance follows a consistent pattern across cycles: companies go public when market conditions maximise proceeds for insiders, not when conditions are most favourable for public buyers, and Jay Ritter’s longitudinal data shows new listings have historically trailed comparable established peers by 3.3% annually over their first five years.
Broader market stress indicators reinforce the picture:
- The Philadelphia Semiconductor Index (SOX) shed around 11% in the month running to mid-July
- A basket tracking momentum strategies dropped in excess of 8% across the same stretch
- Most US IPOs from the preceding two months were sitting below their listing prices by mid-July 2026
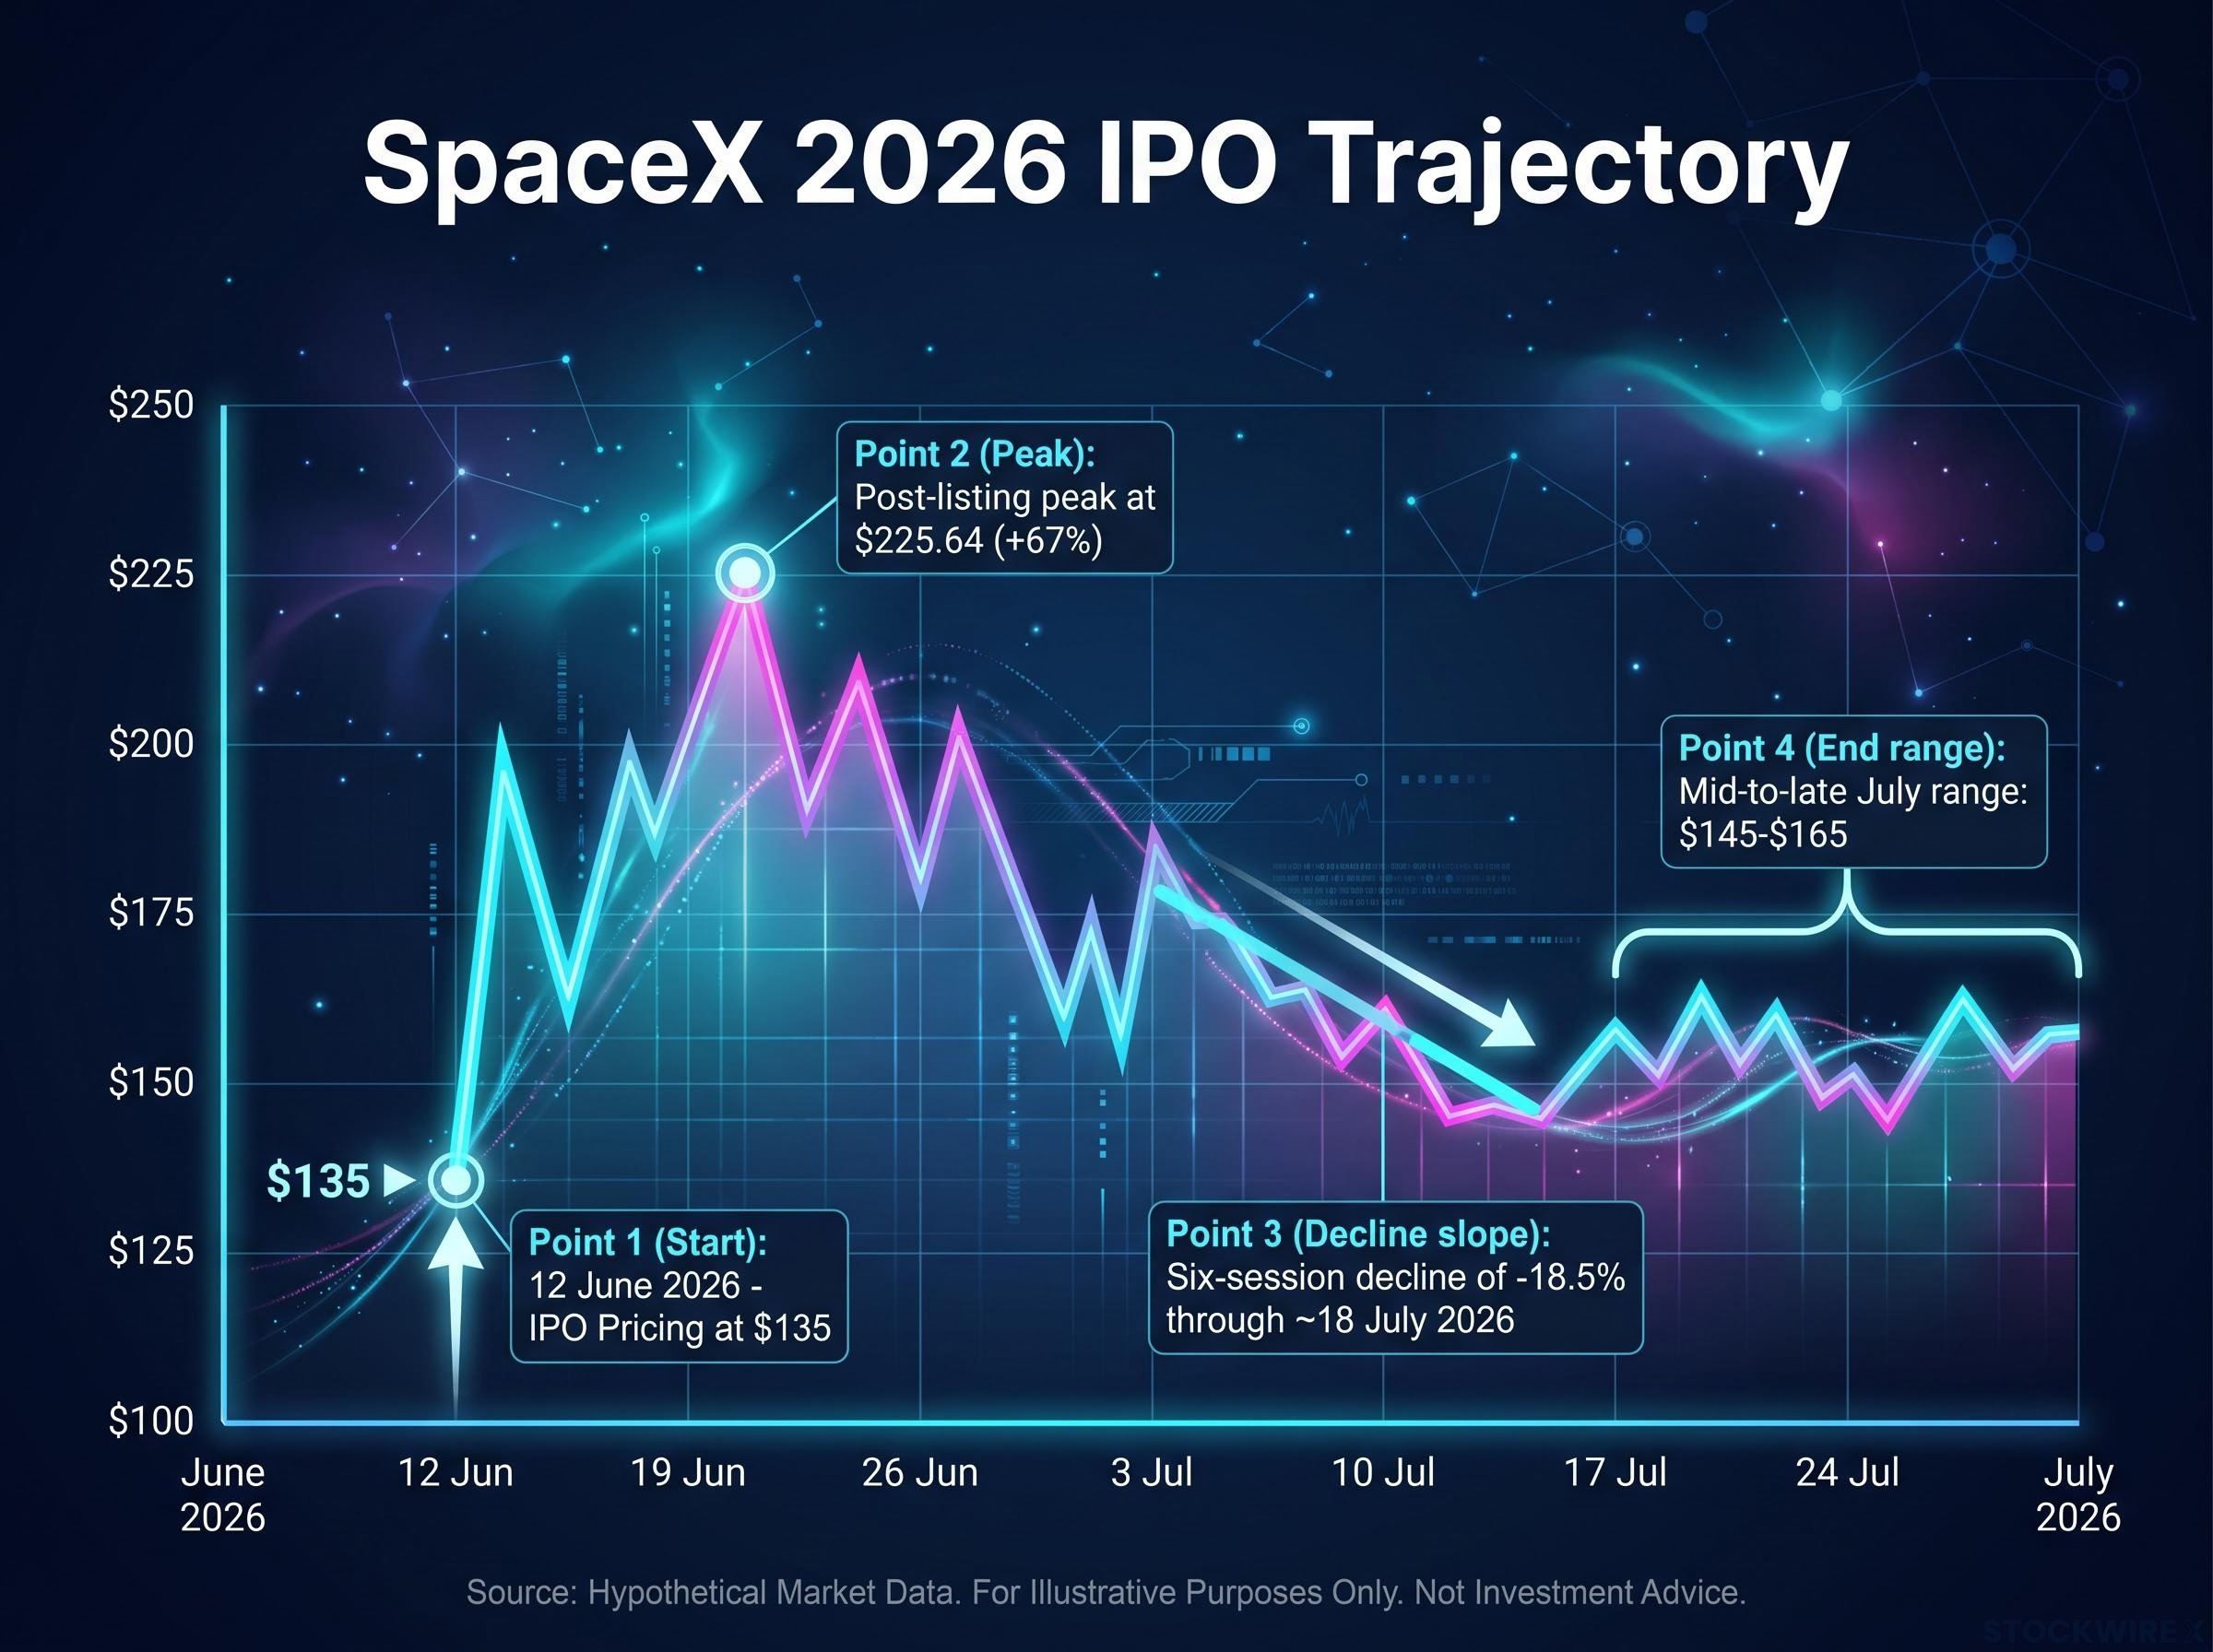
SpaceX provides the highest-profile case study. Its trajectory illustrates how quickly investor enthusiasm can hit a ceiling once shares are freely tradeable.
| Event | Date | Price/Return | Implication |
|---|---|---|---|
| IPO pricing | 12 June 2026 | $135 | One of the most valuable companies at listing |
| Post-listing peak | Shortly after listing | $225.64 | Strong initial demand; +67% above IPO price |
| Six-session decline | Through ~18 July 2026 | -18.5% | Sharp reversal; majority of post-IPO gains erased |
| Mid-to-late July range | Late June-July | ~$145-$165 | Trading modestly above IPO price; late buyers underwater |
The pattern tells you something specific: the market’s willingness to pay premium prices for growth stories has a visible ceiling, and SpaceX’s trajectory shows how quickly that ceiling is reached once price discovery moves from bankers to open-market participants.
Why valuations and AI spending are at the centre of both signals
The insider selling surge and the IPO market stress share a common root: valuations stretched by AI-driven enthusiasm that has yet to fully materialise in earnings.
The S&P 500’s double-digit year-to-date gain has been powered largely by mega-cap tech and AI-related momentum. That rally has compressed the margin of safety across the sector, pushing multiples to levels that assume near-flawless execution on capital-intensive AI spending programmes with uncertain payoff timelines.
EPFR data shows the current selling pace aligns historically with market environments where valuations have moved ahead of underlying fundamentals.
Executives who understand the long-term investment requirements, the competitive dynamics, and the uncertain revenue paths for AI infrastructure are in the strongest position to judge whether current prices already discount perfection. Their selling behaviour suggests many have concluded that they do.
AI stock valuation risk is further complicated by a distributional illusion at the index level: large opposing moves among individual winners and losers cancel each other out, leaving passive investors exposed to single-stock concentration that index-level volatility readings do not capture.
The 2021 comparison is instructive but imperfect. That era’s record selling coincided with a stimulus-inflated market; 2026’s selling is occurring in a market priced for AI-led growth that has yet to arrive in bottom-line earnings. Both were stretched-valuation environments, but the specific catalyst differs.
Three signals are now converging into a single picture:
- Insider selling pace at the second-highest level in two-plus decades, with buying near a seven-year low
- AI capital expenditure uncertainty, with executives reducing personal exposure to the companies making the largest spending commitments
- IPO market stress, with new listings underperforming the index and high-profile debutants unable to sustain their listing premiums
For the reader, this reframes the question. It is no longer “are insiders just diversifying?” The question is: what does it mean that the people closest to AI companies’ actual capital requirements and competitive realities are reducing, rather than increasing, their exposure at these prices?
How to use this signal without overreacting to it
The first thing to establish is the limitation. Insider activity is a sentiment and valuation gauge, not a market timing tool. Elevated selling has appeared in the years before corrections and the years before continued rallies alike. It does not come with a countdown clock.
The constructive way to use the signal is as a prompt to sharpen scrutiny, not as a trigger to exit equities. Pay closer attention to earnings quality, balance sheet strength, and capital intensity, particularly in AI-adjacent and semiconductor names where spending plans are large and competitive outcomes uncertain.
What to watch in the second half of 2026
Several specific indicators will tell you whether the insider caution is being validated or superseded by events:
- Insider buy/sell ratio trajectory: Does buying recover, or does the drought deepen?
- IPO reception for high-valuation AI listings: Anthropic has been flagged as a possible cornerstone deal for the second-half listings calendar, with market speculation pointing to a flotation as early as October 2026. How demand absorbs that offering at current valuations is a direct test of the market’s risk appetite.
- Earnings growth relative to index price levels: The bull resolution requires earnings to accelerate fast enough to justify current multiples. If they do not, prices adjust.
- Secondary-issuance volumes and pricing: Consumer brands Jersey Mike’s and Cumberland Farms were preparing to kick off IPO roadshows in the week of 20 July 2026, providing an early gauge of investor appetite outside the technology sector.
Two resolution paths exist. Either earnings accelerate to catch up with prices, validating the rally, or prices correct or stall until valuations more reasonably reflect realistic growth. The current insider data does not tell you which path prevails. It tells you to hold your assumptions to a higher standard while you wait to find out.
What the divergence between price and conviction tells you now
The core divergence is simple to name, even if its resolution is not. Index prices sit near highs. The people with the most granular view of corporate fundamentals are selling at an 11:1 ratio and buying at near-decade lows. IPO debutants are underperforming the index by roughly half, returning approximately 6% against the S&P 500’s approximately 11% gain.
These are two independent data points from different parts of the capital markets, and both are telling the same story about risk-reward. The only prior period that produced a comparable selling pace was 2021, a market that delivered strong short-term returns before ultimately correcting sharply.
Market sentiment indicators were flagging similar caution in May 2026, when Goldman Sachs’s U.S. Equity Sentiment Indicator reached 1.7, a level historically linked to below-average S&P 500 returns over the following two to eight weeks, even as Q1 earnings growth tracked at 16% and mega-cap tech delivered record results.
The Anthropic IPO and the second-half AI listings pipeline will serve as the next live test. If demand can absorb high-valuation supply at current multiples, the insider signal may prove early. If it cannot, the insiders will have been right about the price they were willing to pay.
The bottom line from the data: insiders are using market strength to exit rather than accumulate, and that pattern argues for more caution than headline index performance alone would suggest.
None of this constitutes a prediction of an imminent downturn. What it constitutes is a data-grounded reason to hold current portfolio assumptions to a higher standard of scrutiny than a headline index number can provide on its own. Signal literacy, the ability to read what informed money is actually doing rather than what prices are saying, is not a one-time exercise. It is a durable investment practice, and the current data makes the case for it clearly.
This article is for informational purposes only and should not be considered financial advice. Investors should conduct their own research and consult with financial professionals before making investment decisions. Past performance does not guarantee future results.